
Abstract
This study determined the ameliorative effects of the novel microorganism, Lactobacillus plantarum CQPC02 (LP-CQPC02), fermented in soybean milk, on loperamide-induced constipation in Kunming mice. High-performance liquid chromatography revealed that LP-CQPC02-fermented soybean milk (LP-CQPC02-FSM) had six types of soybean isoflavones, whereas Lactobacillus bulgaricus-fermented soybean milk (LB-FSM) and unfermented soybean milk (U-FSM) only had five types of soybean isoflavones. LP-CQPC02-FSM also contained more total and active soybean isoflavones than LB-FSM and U-FSM. Results from mouse experiments showed that the defecation factors (quantity, fecal weight and water content, gastrointestinal transit ability, and time to first black stool) in the LP-CQPC02-FSM-treated mice were better than those in the LB-FSM- and U-FSM-treated mice. The serum and small intestinal tissue experiments showed that soybean milk increased the motilin, gastrin, endothelin, acetylcholinesterase, substance P, vasoactive intestinal peptide, and glutathione levels and decreased the somatostatin, myeloperoxidase, nitric oxide, and malondialdehyde levels compared with the constipated mice in the control group. The LP-CQPC02-FSM also showed better effects than those of LB-FSM and U-FSM. Further results showed that LP-CQPC02-FSM upregulated cuprozinc-superoxide dismutase (Cu/Zn-SOD), manganese superoxide dismutase (Mn-SOD), catalase (CAT), c-Kit, stem cell factor (SCF), glial cell-derived neurotrophic factor (GDNF), neuronal nitric oxide synthase (nNOS), endothelial nitric oxide synthase (eNOS), and aquaporin-9 (AQP9) and downregulated the expression levels of transient receptor potential cation channel subfamily V member 1 (TRPV1), inducible nitric oxide synthase (iNOS), and aquaporin-3 (AQP3) in the constipated mice. LP-CQPC02-FSM increased the Bacteroides and Akkermansia abundances and decreased the Firmicutes abundance in the feces of the constipated mice and decreased the Firmicutes/Bacteroides ratio. This study confirmed that LP-CQPC02-FSM partially reversed constipation in mice.
Introduction
Chinese Sichuan pickle (Paocai) is a traditional Chinese natural fermentative food. Paocai is made by washing fresh Chinese cabbage and sealing it in a jar. Chinese cabbage is soaked in salt water and anaerobically fermented. 1 Pickles are rich in microorganisms, including Lactobacillus plantarum, Lactobacillus brevis, Lactobacillus casei, fermentation yeast, and Lactobacillus acidophilus. 2 Lactobacilli play key roles in forming pickle flavor and quality. Some lactic acid bacteria are used as probiotics and provide various benefits to human health, including preventing constipation and colitis, and facilitating weight loss. 2,3 Soybean milk is a traditional drink in China, which is made by soaking, grinding, filtering, and boiling soybeans.
Soybean milk is rich in plant protein and phospholipids and contains vitamins B1 and B2 and nicotinic acid, 4 as well as iron, calcium, and other minerals. Soybean milk is also rich in soybean isoflavones. 5 Studies have shown that soybean isoflavones can delay aging, improve menopausal symptoms, and target osteoporosis, elevated blood lipids, breast cancer, prostate cancer, heart disease, osteoporosis, and cardiovascular disease in addition to exerting other health benefits. 6 –8 One study found that soybean isoflavones alleviated intestinal inflammation, enhanced intestinal antioxidant capacity, improved intestinal barrier function, and regulated intestinal microorganisms. 9 Using lactic acid bacteria to ferment soybean milk can increase the beneficial microorganisms in the milk in addition to the original nutrients. 10
Both probiotics and harmful bacteria normally reside in the intestines in equilibrium. Intestinal probiotics are also involved in digestion; without probiotics, indigestion and digestive tract dysfunction can occur. 11 Lactic acid bacteria in the gastrointestinal (GI) tract can effectively inhibit the growth and reproduction of harmful bacteria through lactic acid metabolism and maintain the ecological balance and normal functioning of the intestinal tract. Chronic diarrhea, constipation, abdominal distension, dyspepsia, and other symptoms are related to lactic acid bacterial imbalances in the intestines. 12
Lactobacilli activate macrophage phagocytosis and play active roles in intestinal colonization. Lactobacilli can stimulate peritoneal macrophages, induce interferon, promote cell division, produce antibodies, promote cellular immunity, enhance nonspecific and specific immune responses, improve disease resistance, and promote peristalsis and defecation. 13 In addition to protein and other general components, soybean also contains soybean isoflavones with intestinal prebiotic functions. 14
Studies show that after microbial fermentation, the bound soybean isoflavones in soybean products are converted into free active soybean isoflavones, which are easier to digest and absorb and are more bioavailable for human use and absorption. 15,16 In our previous experiment, our team isolated the lactic acid bacterium, L. plantarum CQPC02 (LP-CQPC02), from Sichuan pickles and used it to ferment soybean milk for this study. The beneficial microorganisms and soybean isoflavones in L. plantarum can be used to benefit the intestinal tract.
Loperamide is a long-acting antidiarrheal drug that can prevent acetylcholine and prostaglandin release, thus inhibiting intestinal peristalsis, prolonging retention time of the intestinal contents, reducing defecation volume and frequency, and increasing stool firmness. Therefore, loperamide can also induce experimental constipation. 17 In this study, loperamide was used to induce constipation in mice to evaluate the effect of LP-CQPC02-fermented soybean milk (LP-CQPC02-FSM) on constipation and study the free active soybean isoflavones in soybean milk fermented with the natural lactic acid bacteria, LP-CQPC02.
Materials and Methods
Isolation and identification of lactic acid bacteria
One-milliliter samples of pickled vegetable water were diluted to 10−6 bacteria/mL with sterile saline, then the solutions with 10−4, 10−5, and 10−6 bacteria/mL were coated on a flat plate and cultured at 37°C for 24–48 h. Colony morphology was then observed and recorded. Different colonies on the plate were marked and separated. After incubating for 48 h at 37°C, different single colony formations on the plate were marked and separated, and then repeated two to three times until a single colony with the same morphology was obtained. Pure colonies were inoculated in 5 mL deMan, Rogosa and Sharpe (MRS) liquid medium on the selected plate and cultured at 37°C for 24 h. After centrifuging for 10 min at 4000 r/min, the supernatant was discarded. The sediment was suspended in sterile saline solution, Gram stained, and examined microscopically.
The purified suspected target strains were inoculated into MRS broth and cultured at 37°C for 18–24 h. DNA was extracted using a Bacterial Genomic DNA Extraction Kit. The 16S recombinant DNA (rDNA) was amplified by polymerase chain reaction (PCR). One microliter each of the forward primer 27F (5′-AGAGTTTGATCCTGGCTCAG-3′, SEQ ID No. 1) and reverse primer 1495R (5′-CTACGCTACCTTGTTACGA-3′, SEQ ID No. 2; Thermo Fisher Scientific, Waltham, MA, USA), 12.5 μL of 2 × Taq plus buffer (Thermo Fisher Scientific), and 1 μL of template DNA were used, and the mixture was supplemented with sterile dd H2O added to a volume of 25 μL. Sterile ultrapure water was used as a negative control.
The amplification conditions were as follows: 94°C for 5 min, 94°C for 30 sec, 55°C for 30 sec, 72°C for 1 min for 29 cycles, and a final extension at 72°C for 5 min. Five microliters of the amplified products were then detected by 1.5% agarose gel electrophoresis at 110 V for 45 min, and the 16S rDNA amplification products were sequenced.
Soybean milk fermentation
Twice activated LP-CQPC02 and Lactobacillus bulgaricus (LB; No. AB 200048; China Center for Type Culture Collection, Beijing, China) were used to ferment the soybean milk. Soybeans (1 kg) were soaked in water at three times the weight of the soybeans for 12 h. The soaked soybeans were crushed and filtered. LP-CQPC02 and LB at 105 colony-forming units (CFU)/mL were inoculated into the soybean milk and fermented at 37°C for 12 h. The total Lactobacillus count was determined by agar plate counting.
High-performance liquid chromatography assay
Daidzin (20 mg), glycitin (20 mg), genistin (20 mg), daidzein (20 mg), glycitein (20 mg), and genistein (20 mg) were precisely weighed and dissolved in 20-mL volumetric flasks with 80% methanol and diluted to scale as a single standard reserve solution. Each single standard reserve solution was diluted 6, 12, 24, 36, and 48 times to form a 6-dilution series of the single-standard solution using 80% methanol in 10-mL volumetric bottles as mixed standard solutions. The chromatographic conditions were as follows: Pntulips QS-C18 column (4.6 × 250 mm; 5 μm); mobile phase: acetonitrile-0.1_phosphoric acid; detection wavelength: 254 nm; column temperature: 40°C; flow rate: 1 mL/min; injection volume: 10 mL (UltiMate3000 HPLC [high-performance liquid chromatography] System; Thermo Fisher Scientific).
Table 1 shows the gradient elution flow ratios. The retention times of the daidzin, glycitin, genistin, daidzein, glycitein, and genistein were 16.899, 18.298, 26.582, 39.483, 41.325, and 48.525 min, respectively. Two milliliters each of unfermented soybean milk (U-FSM), L. bulgaricus-fermented soybean milk (LB-FSM), and LP-CQPC02-FSM were added to 50-mL volumetric flasks. Next, 80% methanol was added to the flasks to near-scale, and ultrasonicated at 50°C for 1 h. The 80% methanol was diluted to scale, mixed, and centrifuged for 15 min at 9000 r/min. The supernatant was then filtered through a 0.45-μm membrane as the test solution. A single-standard solution of a precisely absorbed series concentration was injected into the liquid chromatograph at 5 μL of each concentration.
Gradient Elution Ratio of the Mobile Phase
The chromatogram was recorded, and the injection volume (X) was linearly regressed by the peak area (Y; daidzin: Y = 498451X − 11455, R 2 = 0.9925; glycitin: Y = 441374X − 9367.1, R 2 = 0.9893; genistin: Y = 523823X − 12158, R 2 = 0.9896; daidzein: Y = 785168X − 19192, R 2 = 0.9916; glycitein: Y = 228932X − 5739.8, R 2 = 0.9918; genistein: Y = 918414X − 10251, R 2 = 0.9894).
Animal experiment
Fifty specific-pathogen-free (SPF)-grade 6-week-old female Kunming mice were purchased from the Laboratory Animal Center of Chongqing Medical University. The mice were housed in a standardized laboratory at a room temperature of 25°C ± 2°C, relative humidity of 50% ± 5%, and a 12-h light/12-h dark cycle. The experiment began 1 week after adaptive feeding. Fifty mice were randomly divided into 5 groups of 10 mice per group: the normal group, control group, U-FSM group, LB-FSM group, and LP-CQPC02-FSM group. The experiment lasted 9 days.
The normal and control groups were given saline daily by gavage. The U-FSM, LB-FSM, and LP-CQPC02-FSM groups were given U-FSM, LB-FSM, and LP-CQPC02-FSM, respectively, four times daily for a total of 2 mL per day. From days 7 to 9, all groups, except the normal group received loperamide (10 mg/kg) daily by gavage. During the experiment, the mice were weighed daily, the feces were collected, and the fecal water content was calculated. 18 After day 9 of gavage administration, all mice were fasted for 24 h, and on day 10, all mice were given 0.2 mL of 10% activated carbon ice water. Each group was then divided into two groups. Five mice were given activated carbon ice water to determine the time when they excreted their first black stool. The remaining five mice received water by gastric administration.
Activated carbon ice water was administered 30 min later, and blood was collected and preserved. The mice were sacrificed, and their small intestines from the pylorus to the ileocecal region were removed to measure the length of the small intestine and the propulsive distance of the activated carbon in the small intestine. The propulsive rate of the small intestine was calculated using the formula: activated carbon propulsive rate (%) = activated carbon propulsion distance/length of small intestine (cm) × 100. The Animal Ethics Committee of Chongqing Collaborative Innovation Center for Functional Food approved the experimental protocol (201810002B).
Determination of serum indexes in the mice
The mouse blood was left at room temperature for 1 h, then the hemorrhagic serum was separated by centrifugation (1500 × g, 15 min), and the motilin (MTL), gastrin (Gas), endothelin (ET), somatostatin (SS), acetylcholinesterase (AChE), substance P (SP), and vasoactive intestinal peptide (VIP) indexes were determined using kits (Nanjing Jiancheng Bioengineering Institute, Nanjing, China).
Determination of small intestinal tissue indexes in the mice
Saline (1.8 mL) was added to 0.2 g of the small intestinal tissue. After homogenizing, the myeloperoxidase (MPO), nitric oxide (NO), malondialdehyde (MDA), and glutathione (GSH) indexes were determined using kits (Nanjing Jiancheng Bioengineering Institute).
Hematoxylin and eosin staining of the small intestinal tissue sections
The small intestinal tissue (0.5 cm2) was immediately fixed in 10% formalin solution for 48 h, then dehydrated, cleared, immersed and embedded in paraffin, and sectioned. The sections were stained with Hematoxylin and Eosin (H&E) to visualize the morphological changes in the small intestinal tissue under an optical microscope (BX43; Olympus, Tokyo, Japan).
Quantitative polymerase chain reaction assay
Total RNA from the small intestines and microorganisms from the feces were extracted using TRIzol reagent as per the manufacturer's instructions (Thermo Fisher Scientific). The purity and concentration of the total RNA were determined using an ultramicrospectrophotometer, and the RNA concentration in each sample was adjusted to the same level (1 μg/μL). Next, 1 μg/μL of the RNA was added to 1 μg/μL primer dT and 10 μL sterile super pure water, and the mixture was reacted at 65°C for 5 min. When the reaction was complete, 1 μL Ribolock RNase Inhibitor, 2 μL 100 mM dNTP, 4 μL 5 × Reaction Buffer, and 1 μL Revert Aid M-mu/RT (Thermo Fisher Scientific) were added to the reaction system.
After homogeneous mixing of the 20 μL of liquid, the DNA was synthesized at 42°C for 60 min and 70°C for 5 min. The genes were synthesized under the following conditions: denaturation at 95°C for 15 min, annealing at 60°C for 1 h, and 40 cycles of extension at 95°C for 15 min. 19 The relative expressions of the target gene were calculated using the 2−ΔΔCT method with glyceraldehyde-3-phosphate dehydrogenase (GAPDH) as the housekeeping gene (Table 2). The target gene was then retranscribed and amplified.
Sequences of Primers Used in This Study
AQP3, aquaporin-3; AQP9, aquaporin-9; CAT, catalase; Cu/Zn-SOD, cuprozinc-superoxide dismutase; eNOS, endothelial nitric oxide synthase; GAPDH, glyceraldehyde-3-phosphate dehydrogenase; GDNF, glial cell-derived neurotrophic factor; iNOS, inducible nitric oxide synthase; Mn-SOD, manganese superoxide dismutase; nNOS, neuronal nitric oxide synthase; SCF, stem cell factor; TRPV1, transient receptor potential cation channel subfamily V member 1.
Western blot assay
Protein was extracted from the small intestinal tissue using a kit (Thermo Fisher Scientific), and the protein concentration was regulated to 30 μg/mL. Gel electrophoresis was used to separate proteins from the small intestinal tissue (2 h) using 10% gel and 5% layer gel, sealed with 5% skim milk, reacted with the primary antibody (Thermo Fisher Scientific) for 2 h at 25°C, reacted with the secondary antibody (Thermo Fisher Scientific) for 1 h at 25°C, then washed with tris-buffered saline Tween 20 (TBST) three times and photographed using a GIS gel image system (iBright™ FL1000 Imaging System; Thermo Fisher Scientific). 20
Statistical analysis
Serum and tissue testing were performed on each mouse in triplicate, and the averages were used. SAS 9.1 statistical software (SAS Institute Inc., Cary, NC, USA) was used to analyze data. One-way analysis of variance was used to analyze significant differences among the data, and P < .05 was considered statistically significant.
Results
Isolation and identification of LP-CQPC02
LP-CQPC02 colony morphology was observed macroscopically (Fig. 1A). The colonies were mostly white or milky white and round with neat edges and a smooth surface. The strain was identified as lactic acid bacteria through positive Gram staining and microscopy. Figure 1B shows the cell morphology of the strain under 100 × oil immersion microscopy. The cells were long and short rods with no germination. The agarose gel electrophoresis results for the amplified 16S rDNA products showed no stripe in the negative control lane, indicating that no contamination occurred during the PCR amplification process. The strain sequence was ∼1500 bp, which is consistent with the expected length of the amplified fragment.

Colony morphology
The Basic Local Alignment Search Tool (BLAST) program of NCBI was used to compare and analyze the measured sequences. The results showed that the CQPC02 strain was L. plantarum. Its homology with known lactic acid bacteria in GenBank was 99% (GenBank accession No. NC_004567.2), and it was preserved under the name LP-CQPC02.
Soybean isoflavones in soybean milk
Five microliters of the precisely absorbed sample solution was injected into the liquid chromatograph, and the chromatogram was recorded. The peak areas of the six soybean isoflavones in the soymilk were calculated using the regression equation listed in the Materials and Methods section.
Figure 2B–D show the chromatograms for U-FSM, LB-FSM, and LP-CQPC02-FSM, respectively. U-FSM and LB-FSM contained daidzin, glycitin, genistin, daidzein, and genistein. LP-CQPC01-FSM contained glycitein in addition to the above five isoflavones. Table 3 shows the results for the soybean isoflavones in U-FSM, LB-FSM, and LP-CQPC02-FSM. Compared with U-FSM and LB-FSM, LP-CQPC02-FSM had the highest total soybean isoflavone content, with more free glycosides (daidzin, glycitin, and genistin) and fewer conjugated glycosides (daidzein, glycitein, and genistein). These results show that, compared with L. bulgaricus, LP-CQPC02 produced more active soybean isoflavones during the soymilk fermentation process.
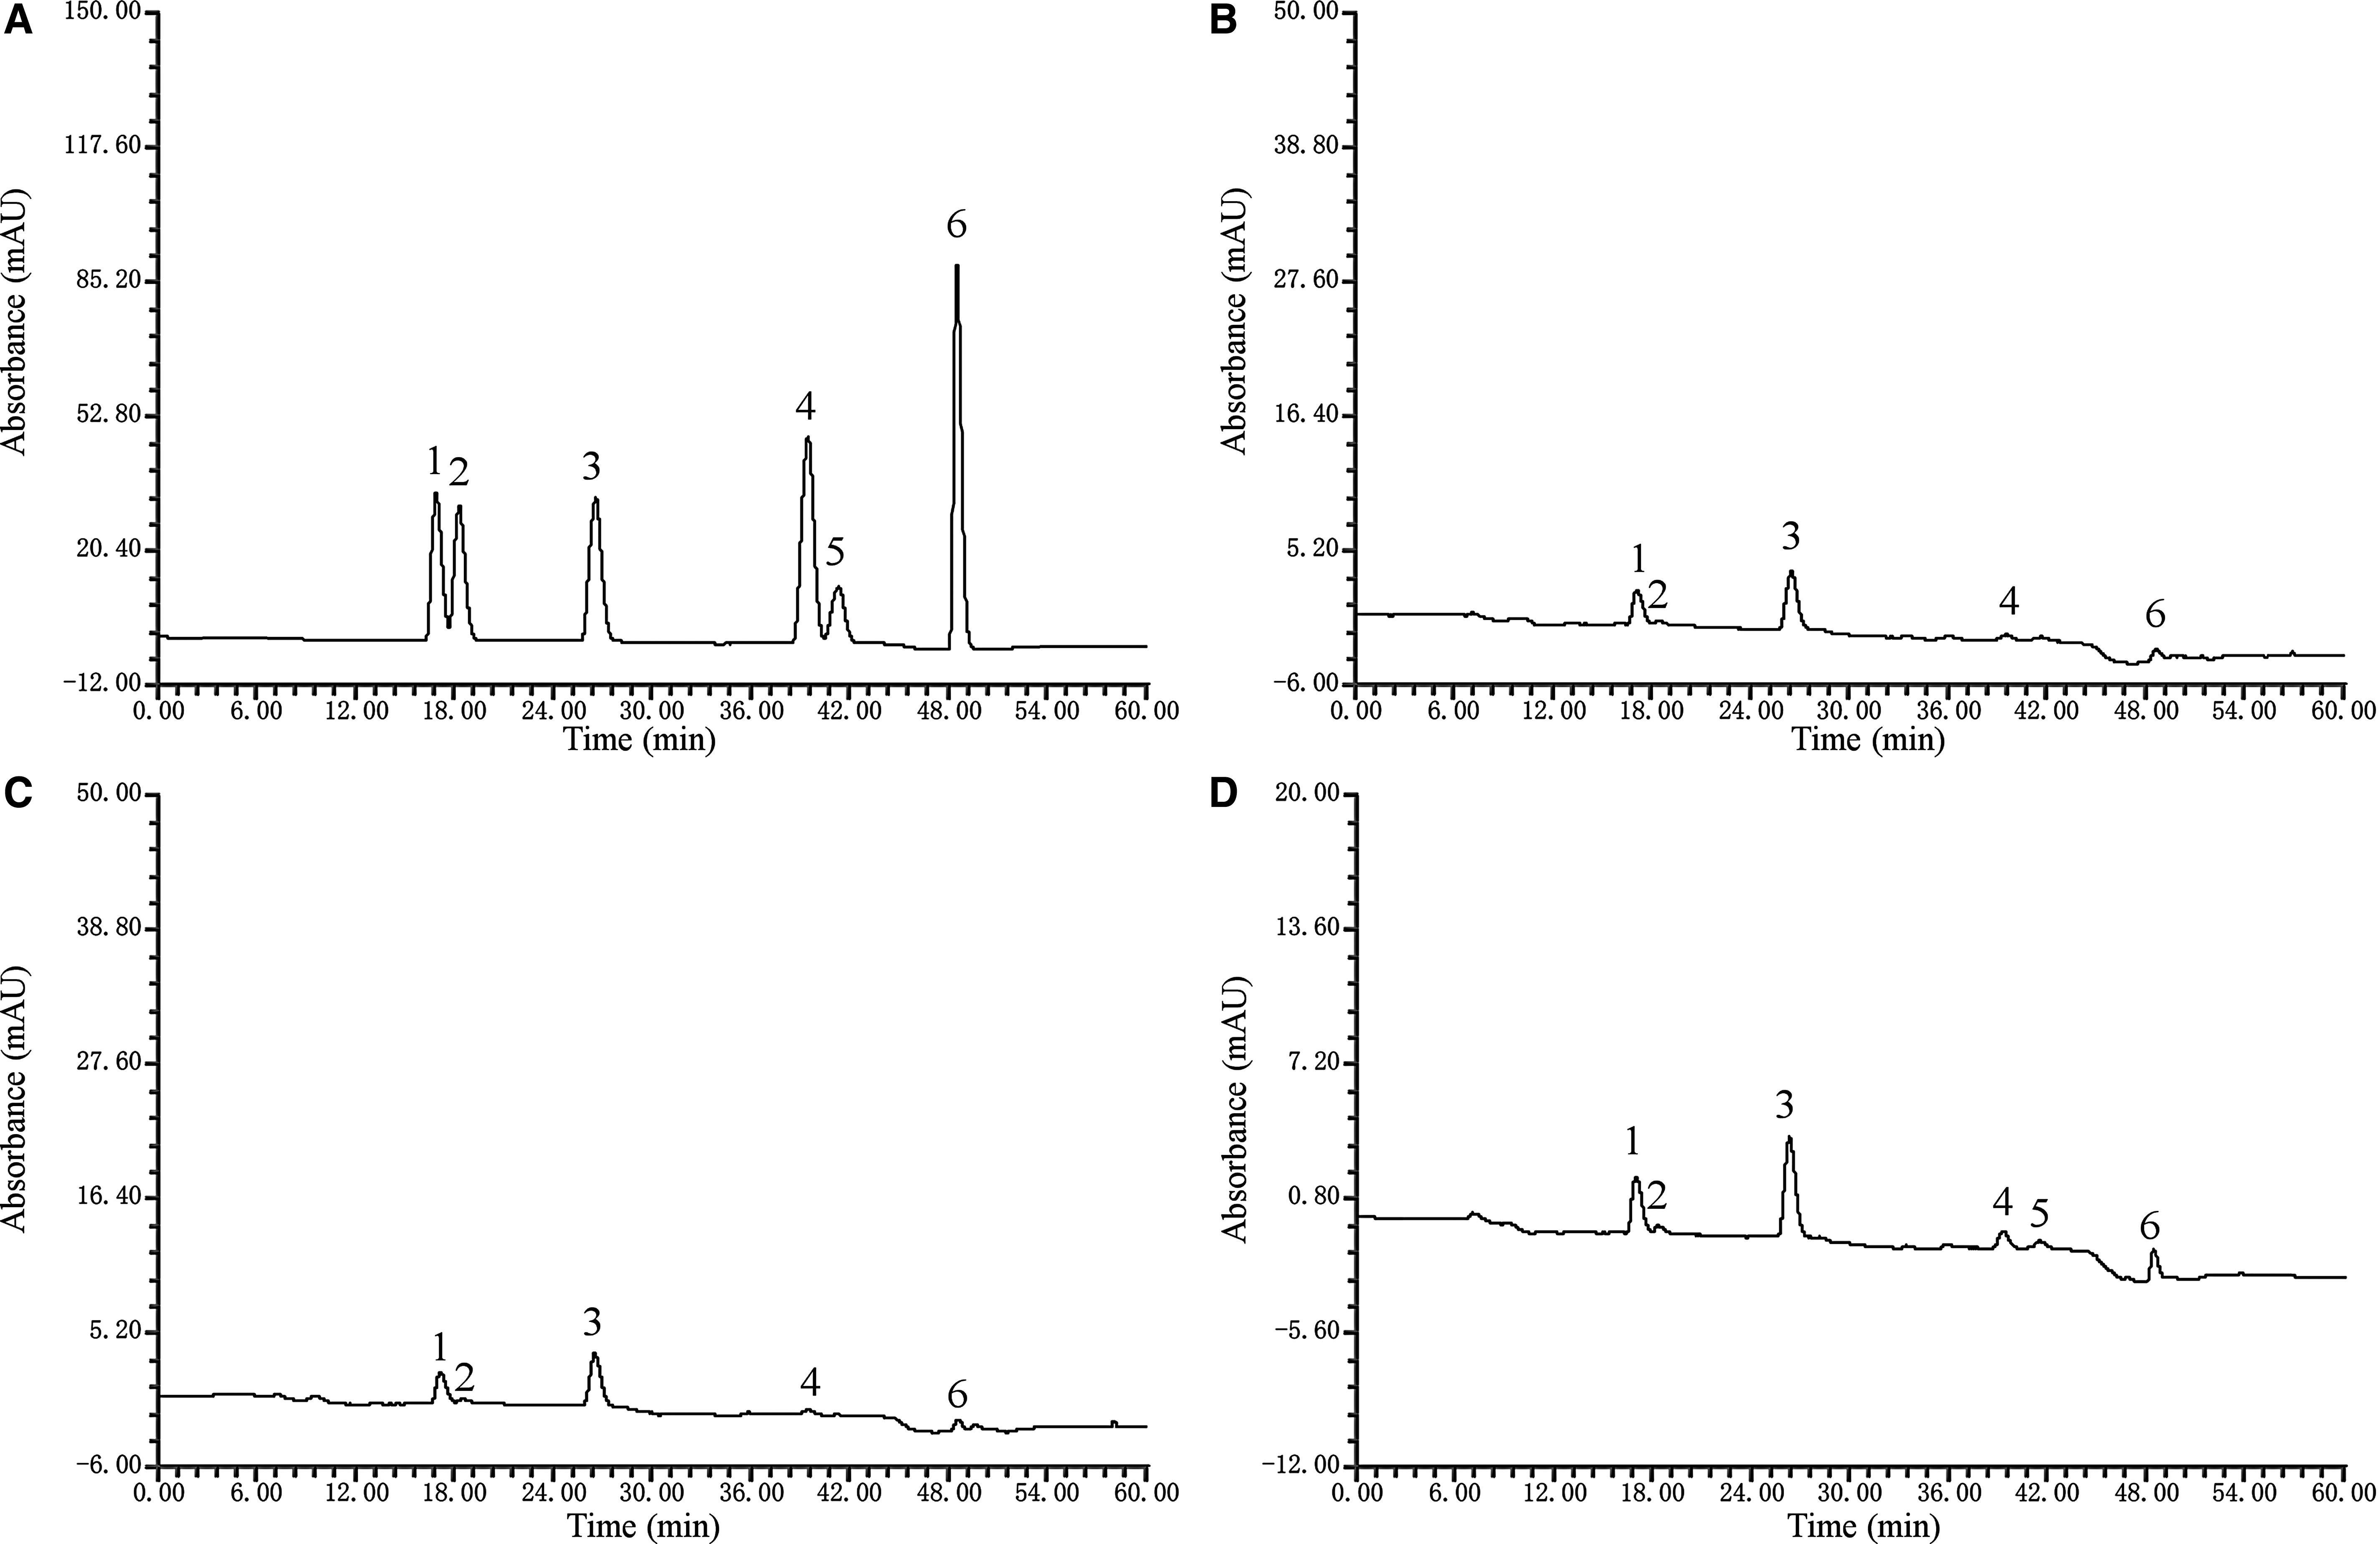
HPLC for soybean isoflavones in fermented soybean milk.
Soybean Isoflavone Contents in the Fermented Soybean Milk (μg/mL)
LB-FSM, Lactobacillus bulgaricus-fermented soybean milk; LP-CQPC02-FSM, Lactobacillus plantarum CQPC02-fermented soybean milk; U-FSM, unfermented soybean milk.
Stool statuses of the mice
From days 1 to 14 of the experiment, no significant differences were found in stool weight, stool particle count, or stool water content among the groups (P > .05) (Table 4). From days 15 to 17, due to induced constipation, the stool weight, particle count, and water content were the lowest in the control group. After the mice received soybean milk, the stool weight, particle count, and water content were increased in the constipated mice. LP-CQPC02-FSM was better able to increase the stool weight, particle count, and water content than were LB-FSM and U-FSM. LP-CQPC02-FSM enabled the stool weight, particle count, and water content in the constipated mice to be closer to those of the normal mice.
Stool Parameters of Mice Treated with Soybean Milk
Values presented are the mean ± standard deviation (N = 10/group).
Mean values with different letters in the same row differ significantly (P < .05) by Duncan's multiple-range test.
LB-FSM group, mice treated with Lactobacillus bulgaricus-fermented soybean milk; LP-CQPC02-FSM group, mice treated with Lactobacillus plantarum CQPC02-fermented soybean milk; U-FSM group, mice treated with unfermented soybean milk.
First black stool defecation time
Time to the first black stool is an important index for evaluating constipation severity. When constipation symptoms occur, intestinal peristalsis slows, and the feces remain in the intestine longer. To evaluate the effect of soybean milk on defecation in mice with activated carbon-induced constipation, the time of the first black stool excretion was observed after the last oral administration of activated carbon ice water.
Figure 3 shows that the time to first black stool was the longest in the control group, which was significantly longer than that of the normal group (P < .05). The defecation times for the U-FSM, LB-FSM, and LP-CQPC02-FSM groups were higher than that of the normal group and differed significantly from that of the control group (P < .05). The time to first black stool time was significantly shorter (P < .05) for the LP-CQPC02-FSM group than for the other two soybean milk groups.
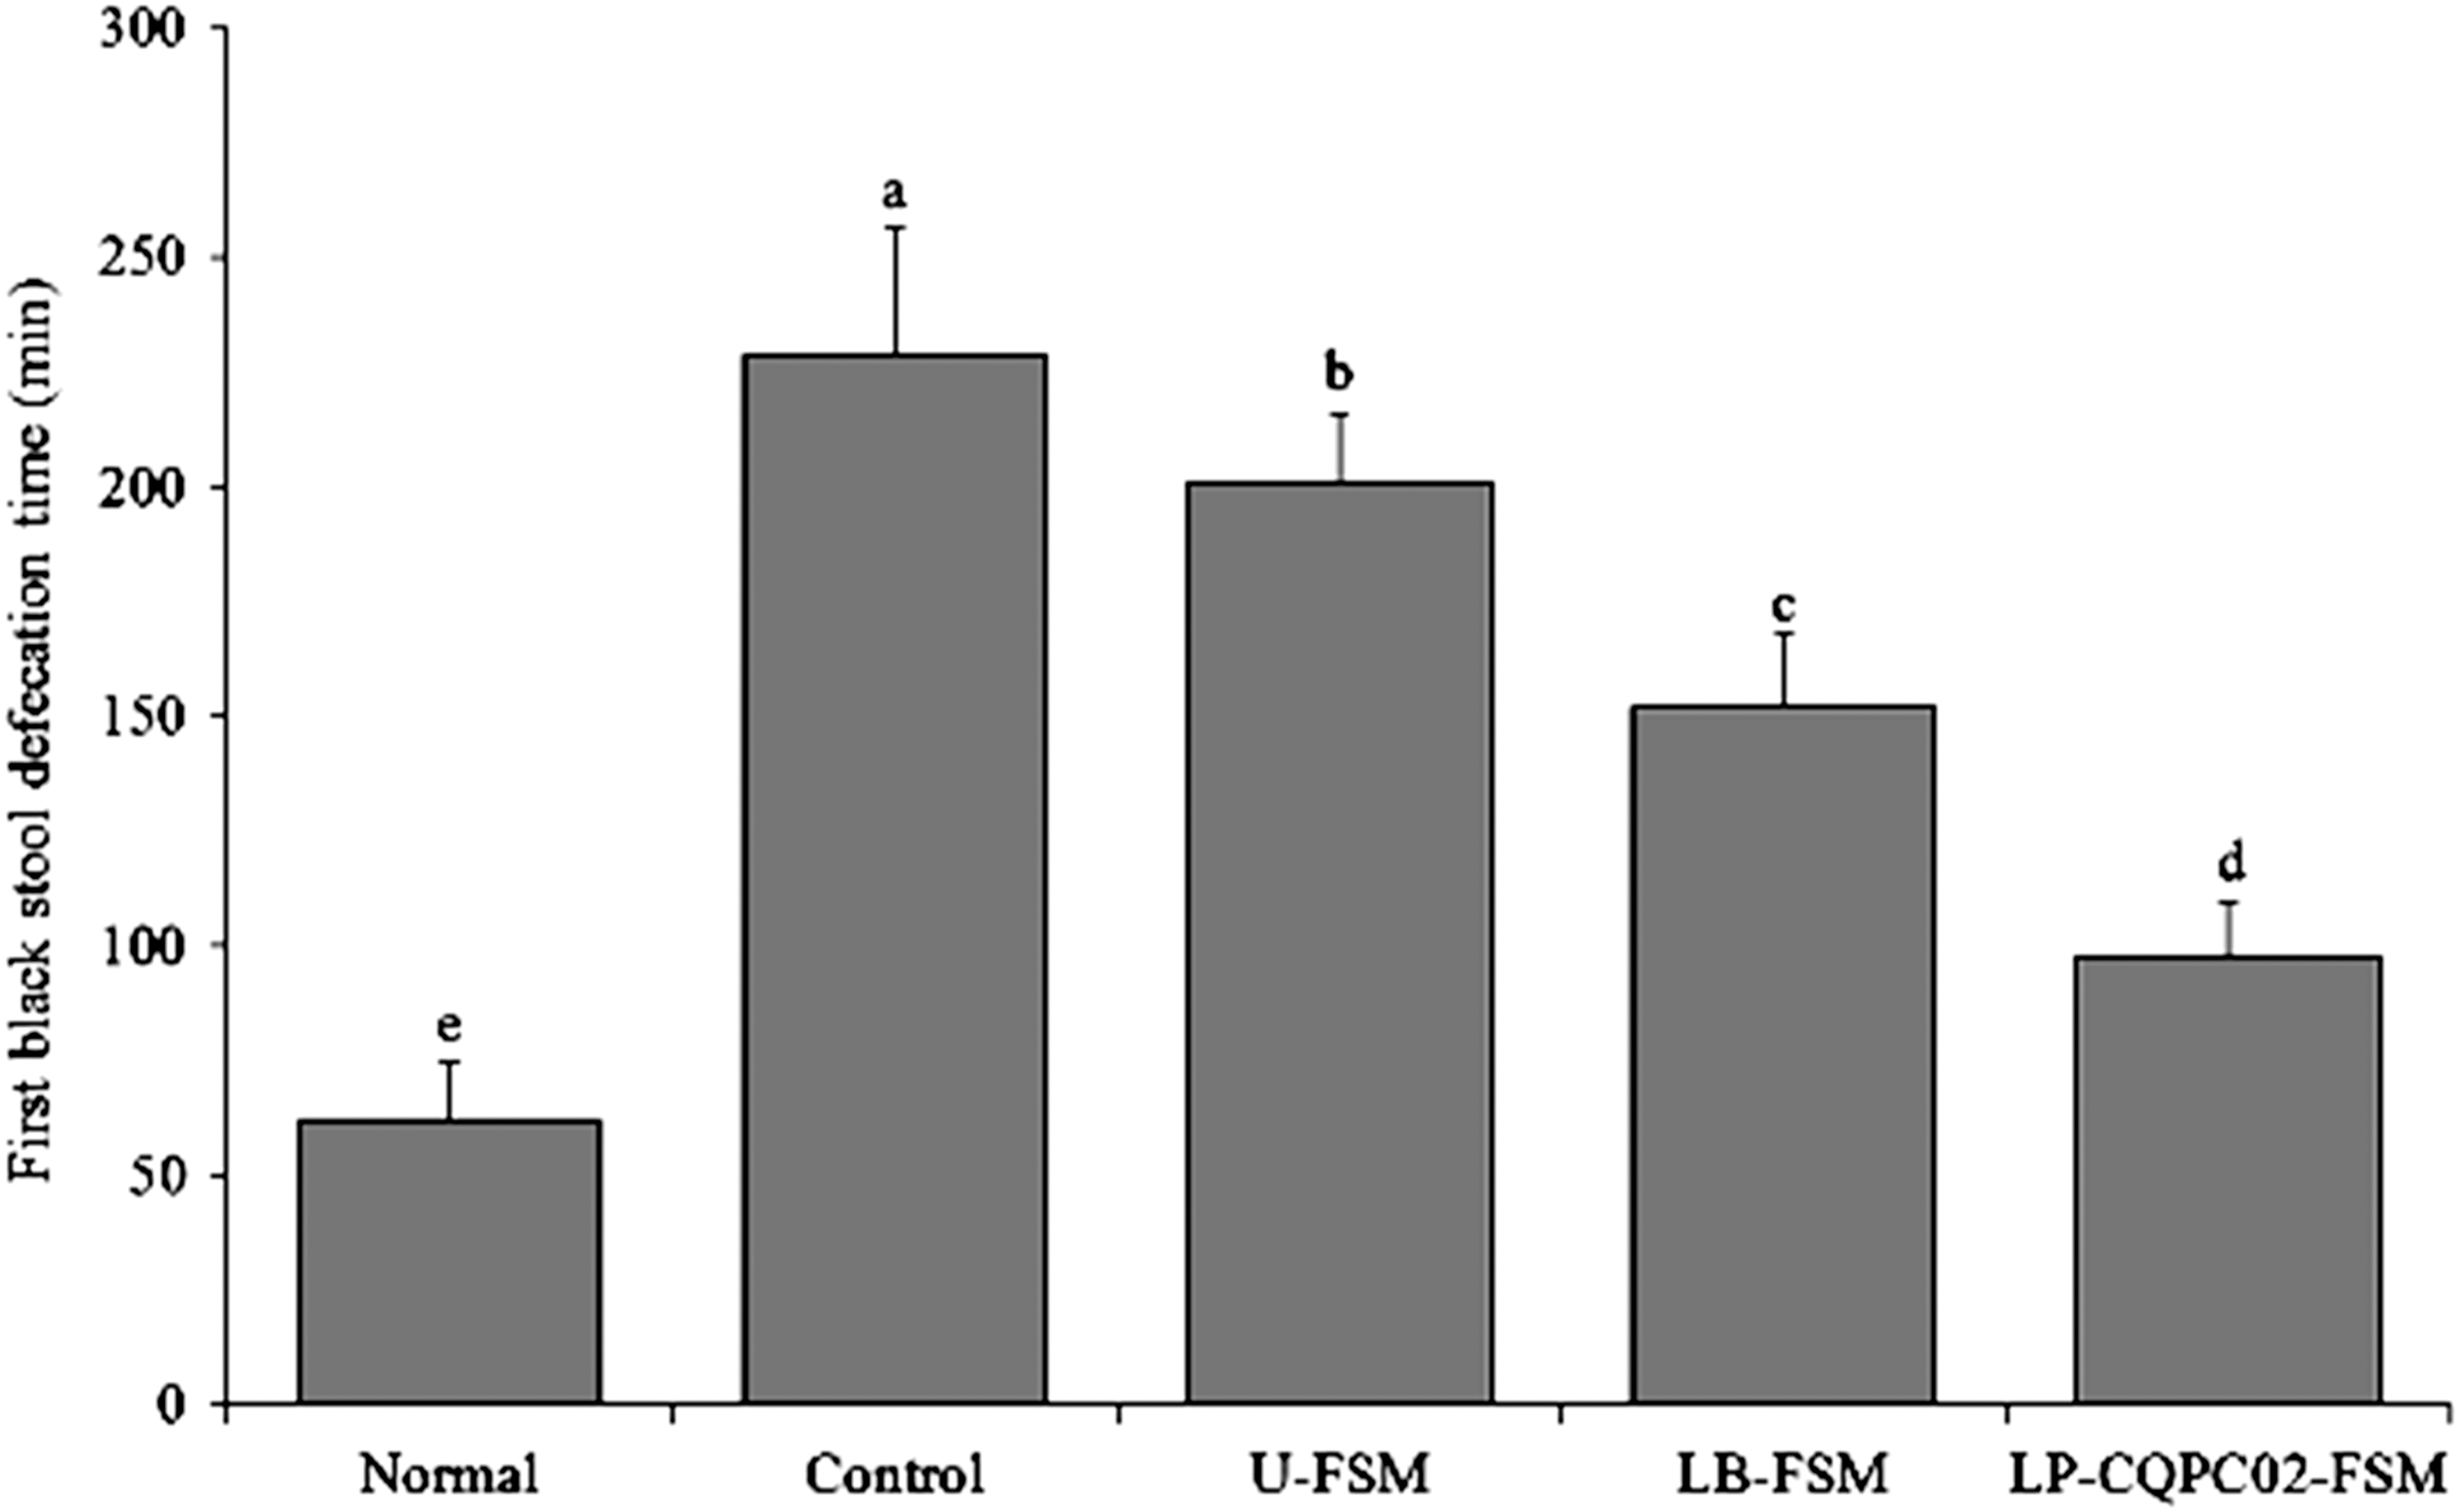
Time to first black stool defecation by the mice. a-eMean values with different letters in the same bars differ significantly (P < .05) by Duncan's multiple-range test.
GI transit abilities of the mice
After gavaging for 30 min with 10% activated carbon ice water, all mice were sacrificed, the distance of the activated carbon in the small intestine was measured, and the small intestinal propulsive rate was calculated.
Table 5 shows that the intestinal length did not differ significantly between groups (P > .05), indicating that activated carbon modeling did not affect intestinal length. The activated carbon propulsive rate was the lowest in the control group, which was significantly lower than that of normal group (P < .05). The activated carbon propulsive rate of constipated mice treated with U-FSM, LB-FSM, and LP-CQPC02-FSM was significantly higher than that of the control group (P < .05), and the activated carbon propulsive rate in the LP-CQPC02-FSM group was the closest to that of the normal group. Thus, LP-CQPC02-FSM promoted small intestinal peristalsis and accelerated the speed of the activated carbon in the small intestine, thus reducing the retention time of the activated carbon in the small intestine and helping alleviate constipation.
Gastrointestinal Transit in Mice with Activated Carbon-Induced Constipation
Values presented are the mean ± standard deviation (N = 10/group).
Mean values with different letters in the same row differ significantly (P < .05) by Duncan's multiple-range test.
GI, gastrointestinal.
Serum MTL, Gas, ET, SS, AChE, SP, and VIP levels in mice
The serum levels of MTL, Gas, ET, SS, AChE, SP, and VIP in each group were determined (Table 6). Compared with the other four groups, the serum levels of MTL, Gas, ET, AChE, SP, and VIP were the highest in the normal group, while the serum levels of SS were the lowest in the control group. In the control group, the serum levels of SS were the highest, and the serum levels of MTL, Gas, ET, AChE, SP, and VIP were the lowest. The serum MTL, Gas, ET, AChE, SP, and VIP levels were significantly increased in the LP-CQPC02-FSM group (P < .05), whereas the SS levels were significantly decreased (P < .05).
MTL, Gas, ET, SS, AChE, SP, and VIP Serum Levels in Mice with Activated Carbon-Induced Constipation
Values presented are the mean ± standard deviation (N = 10/group).
Mean values with different letters in the same row differ significantly (P < .05) by Duncan's multiple-range test.
AChE, acetylcholinesterase; ET, endothelin; Gas, gastrin, MTL, motilin; SP, substance P; SS, somatostatin; VIP, vasoactive intestinal peptide.
MPO, NO, MDA, and GSH levels in the mouse small intestinal tissue
Table 7 shows that the MPO, NO, and MDA levels in small intestine tissues of the normal mice were the lowest, whereas the GSH levels were the highest. These levels showed the opposite trend in the control mice, with the MPO, NO, and MDA levels being the highest and the GSH levels being the lowest. U-FSM, LB-FSM, and LP-CQPC02-FSM reduced the MPO, NO, and MDA levels and increased the GSH levels in the mice with constipation, and LP-CQPC02-FSM had the strongest effect.
MPO, NO, MDA, and GSH Levels in the Small Intestinal Tissues of Mice with Activated Carbon-Induced Constipation
Values presented are the mean ± standard deviation (N = 10/group).
Mean values with different letters in the same column differ significantly (P < .05) by Duncan's multiple-range test.
GSH, glutathione; MDA, malondialdehyde; MPO, myeloperoxidase; NO, nitric oxide.
Small intestinal tissue morphology
Damage to the small intestinal villi affects the intestinal tissue to varying degrees, and intestinal peristalsis and slowing of the peristalsis can cause constipation; thus, the small intestinal villus integrity is important in evaluating constipation (Fig. 4). Small intestinal villi in the normal group were arranged uniformly without breakage or shrinkage, whereas in the model group, the small intestinal villi showed severe breakage and shrinkage, with incomplete goblet cells. Although the small intestinal villi in the LP-CQPC02-FSM, U-FSM, and LB-FSM groups had some shrinkage and rupturing, the small intestinal villi of the LP-CQPC02-FSM group were more complete than those of the model mice, and the small intestinal villi in the LP-CQPC02-FSM group were almost identical to those of the normal mice.

Morphological observation of small intestinal tissue in mice with activated carbon-induced constipation. LB-FSM group, mice treated with Lactobacillus bulgaricus-fermented soybean milk; LP-CQPC02-FSM group, mice treated with Lactobacillus plantarum CQPC02-fermented soybean milk; U-FSM group, mice treated with unfermented soybean milk.
Messenger RNA expression levels of cuprozinc-superoxide dismutase, manganese superoxide dismutase, and catalase in small intestinal tissue
Figure 5 shows that the messenger RNA (mRNA) expressions of cuprozinc-superoxide dismutase (Cu/Zn-SOD), manganese superoxide dismutase (Mn-SOD), and catalase (CAT) in the small intestines of the mice in the normal group were the strongest, whereas those in the control group were the weakest. The three soybean milks significantly (P < .05) increased the expressions of Cu/Zn-SOD, Mn-SOD, and CAT in the small intestines of the constipated mice, and the effect of LP-CQPC02-FSM was the strongest.

mRNA expression levels of Cu/Zn-SOD, Mn-SOD, and CAT in the small intestinal tissues of mice. Values presented are the mean ± standard deviation (N = 10/group). a-eMean values with different letters in the same bars differ significantly (P < .05) by Duncan's multiple-range test. CAT, catalase; Cu/Zn-SOD, cuprozinc-superoxide dismutase; Mn-SOD, manganese superoxide dismutase; mRNA, messenger RNA.
mRNA expression levels of c-Kit and stem cell factor in the small intestinal tissue
Figure 6 shows that the mRNA expressions of c-Kit and stem cell factor (SCF) in the small intestines of the constipated mice (control group) were significantly (P < .05) lower than those of the other groups. LP-CQPC02-FSM, LB-FSM, and U-FSM upregulated the expressions of c-Kit and SCF in the small intestines of the constipated mice, and the effects of LP-CQPC02-FSM were greater than those of LB-FSM and U-FSM.

mRNA expression levels of c-Kit and SCF in the small intestinal tissues of mice. Values presented are the mean ± standard deviation (N = 10/group). a-eMean values with different letters in the same bars differ significantly (P < .05) by Duncan's multiple-range test. SCF, stem cell factor.
mRNA expression levels of TRPV1 and glial cell-derived neurotrophic factor in the small intestinal tissue
Figure 7 shows that transient receptor potential cation channel subfamily V member 1 (TRPV1) mRNA expression was the weakest in the normal group, whereas glial cell-derived neurotrophic factor (GDNF) mRNA expression was the strongest. After inducing constipation, TRPV1 expression was the strongest in the model group, whereas GDNF expression was the weakest. Soybean milk treatments significantly (P < .05) decreased the TRPV1 and increased the GDNF expressions in the constipated mice. LP-CQPC02-FSM brought the TRPV1 and GDNF expressions in the constipated mice closer to those of normal mice than did LB-FSM and U-FSM.
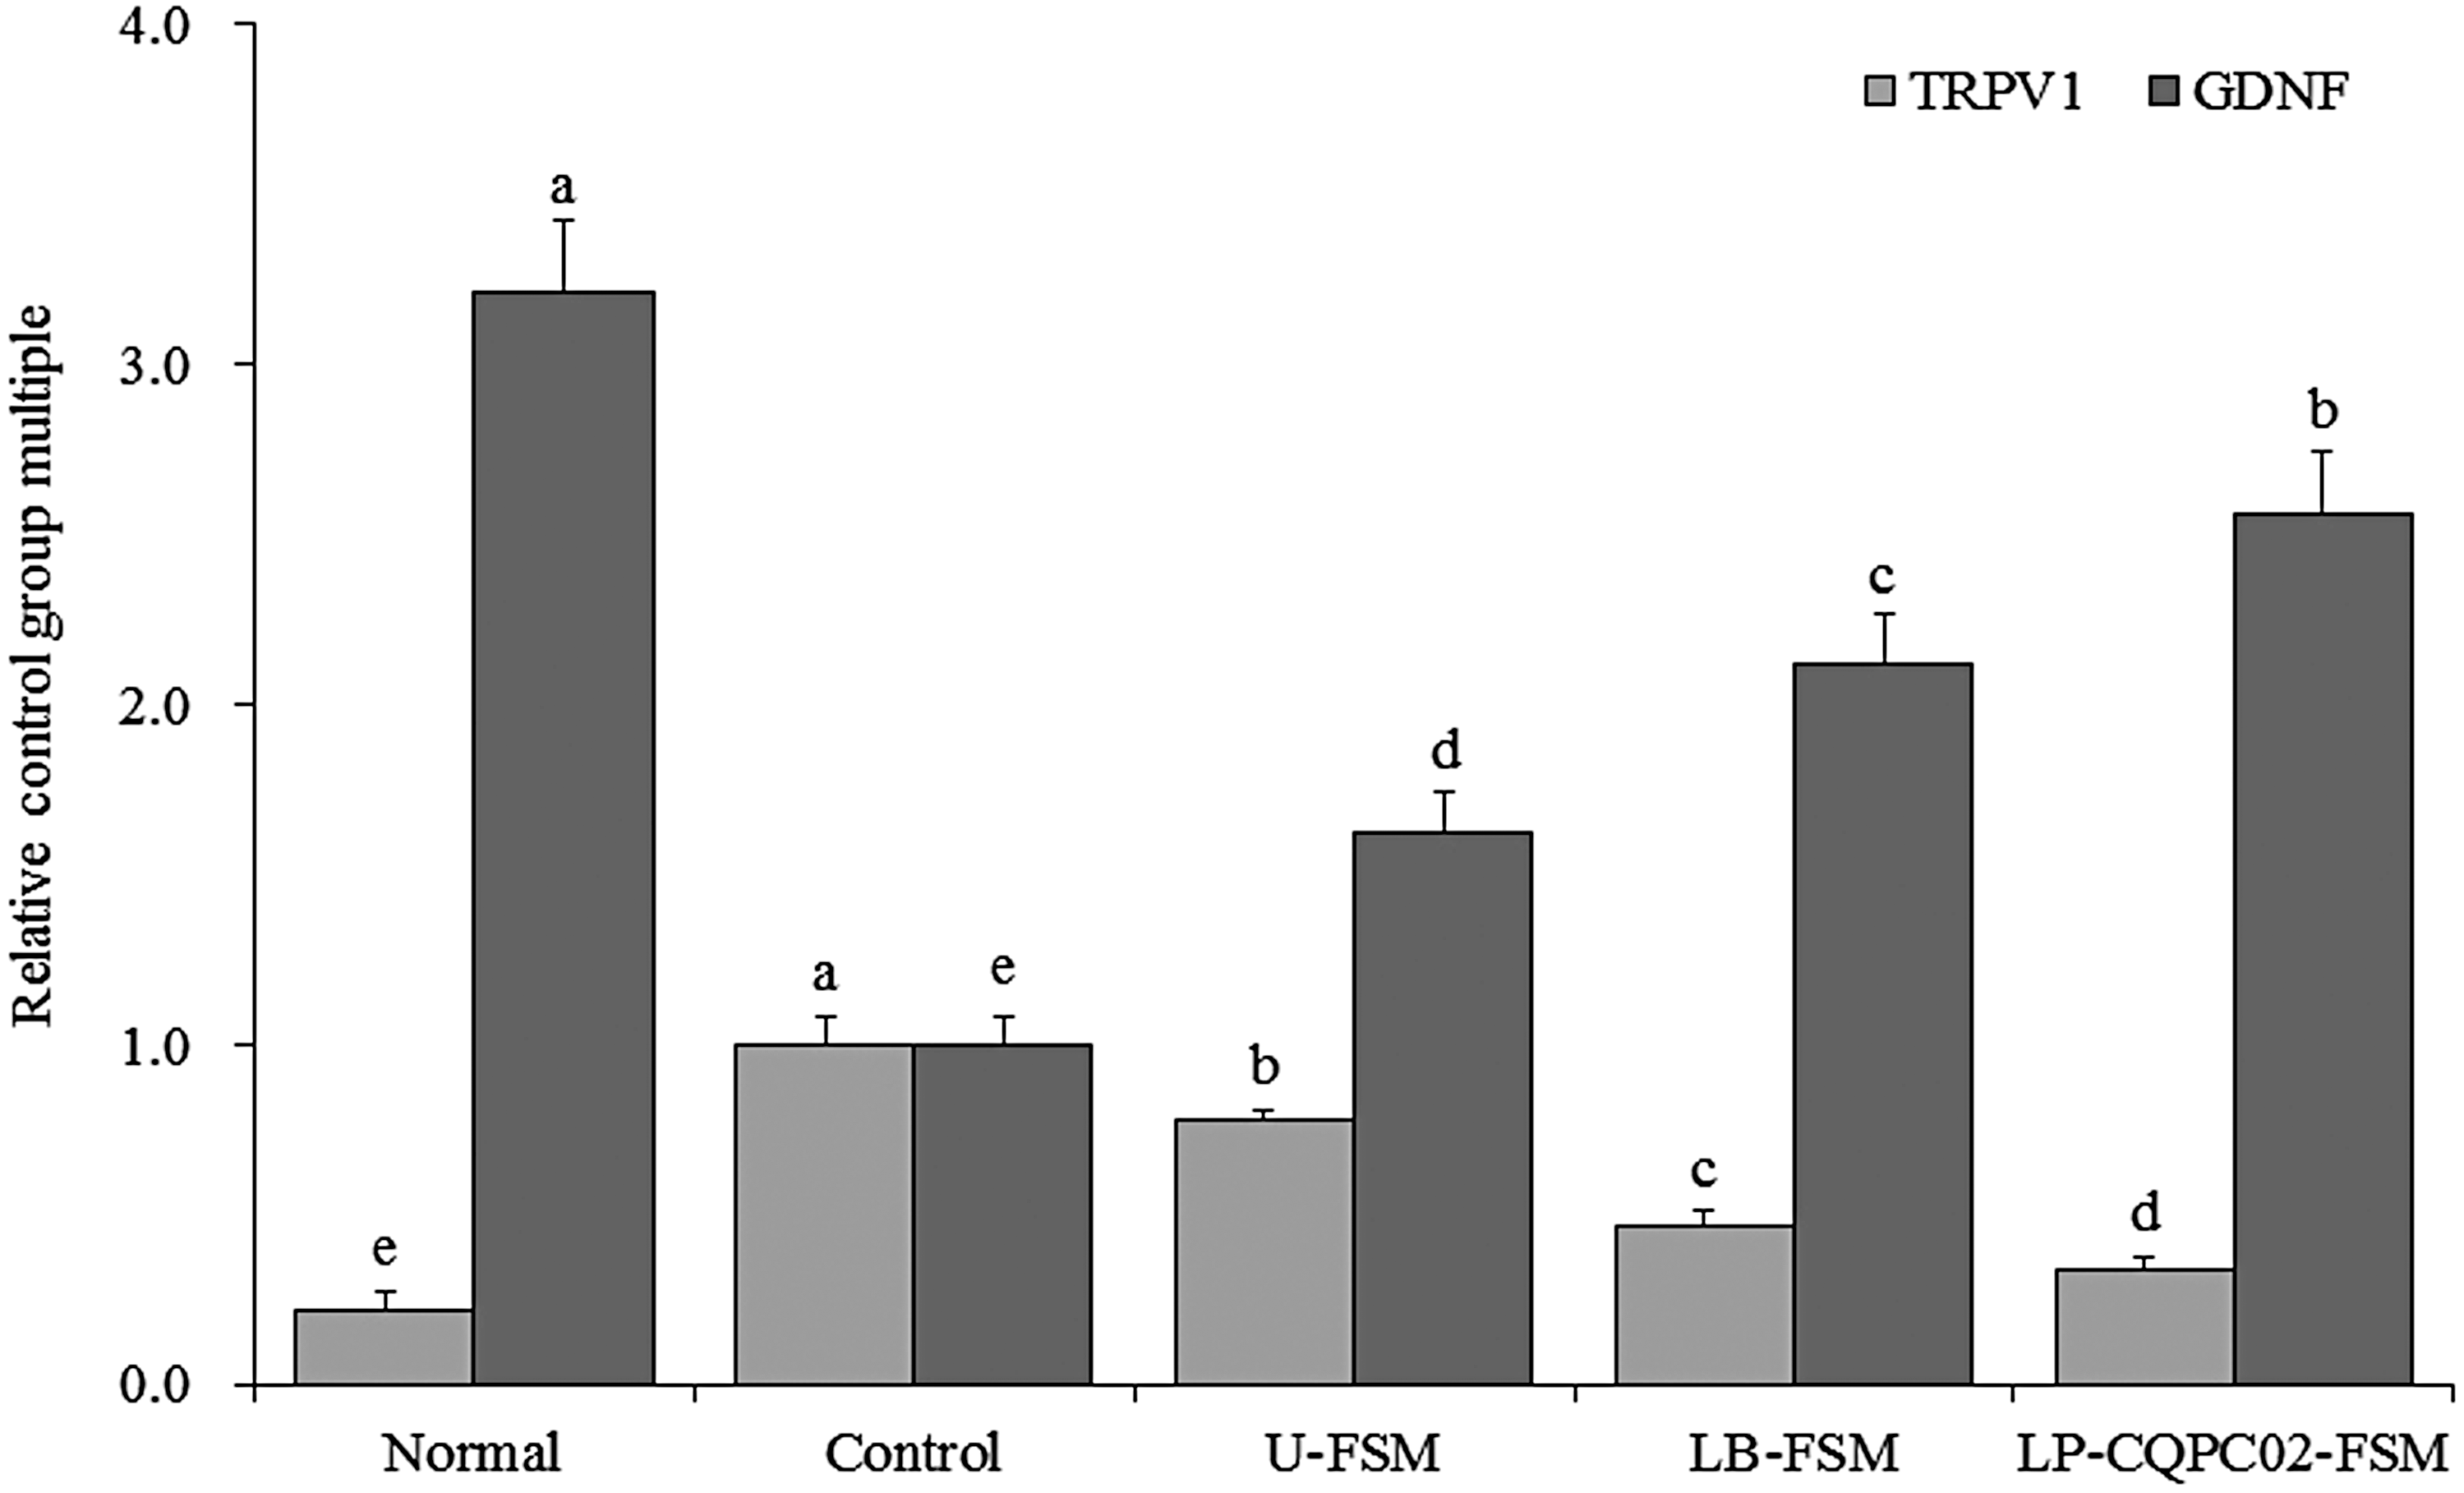
mRNA expression levels of TRPV1 and GDNF in the small intestinal tissues of mice. Values presented are the mean ± standard deviation (N = 10/group). a-eMean values with different letters in the same bars differ significantly (P < .05) by Duncan's multiple-range test. GDNF, glial cell-derived neurotrophic factor; TRPV1, transient receptor potential cation channel subfamily V member 1.
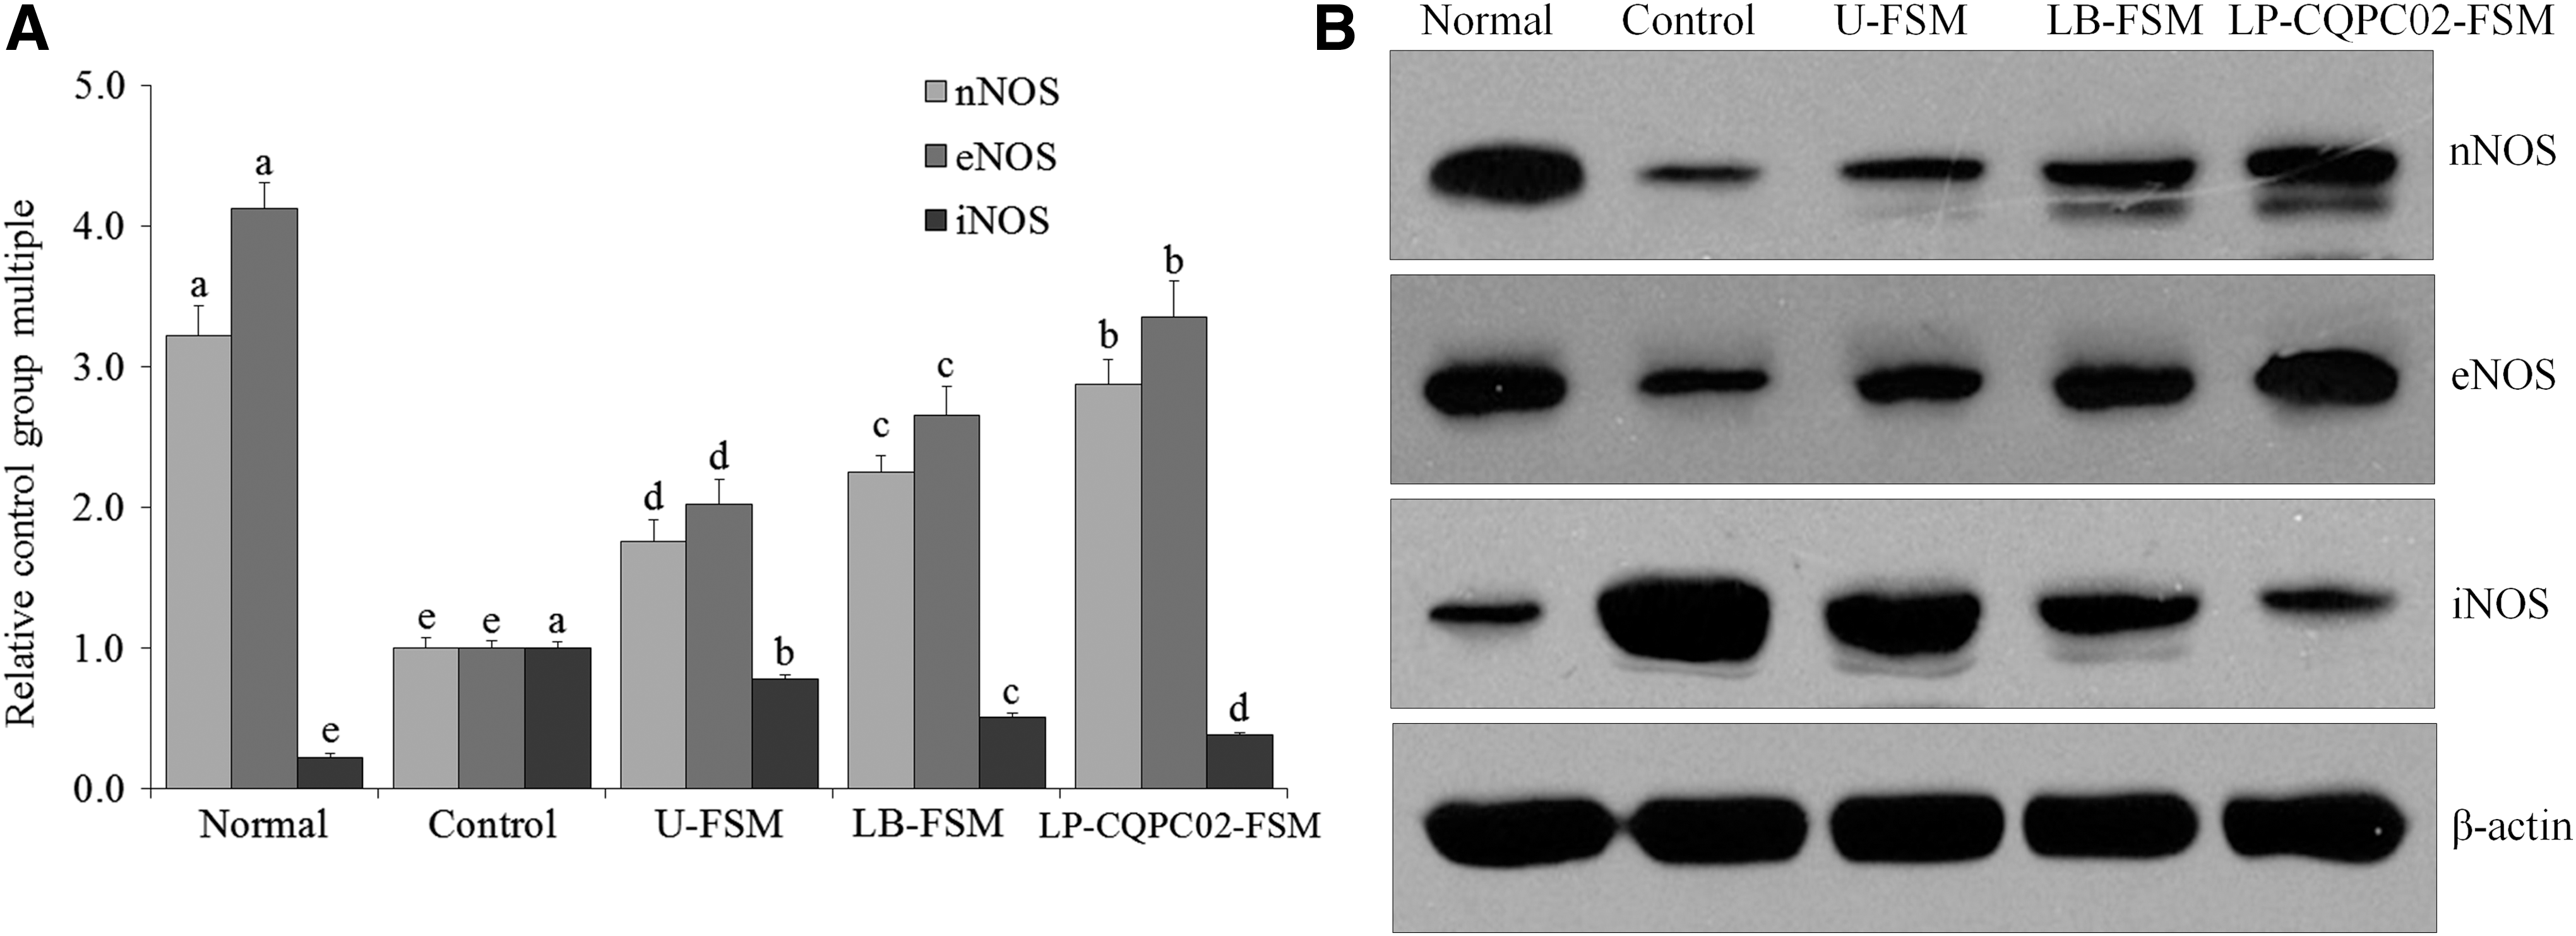
mRNA and protein expression levels of neuronal nitric oxide synthase, endothelial nitric oxide synthase, and inducible nitric oxide synthase in the small intestinal tissue
The mRNA and protein expressions of neuronal nitric oxide synthase (nNOS) and endothelial nitric oxide synthase (eNOS) were the strongest in the small intestines of the normal mice, whereas nNOS expression was the weakest (Fig. 8). Experimental constipation weakened the nNOS and eNOS expressions in the small intestines, whereas inducible nitric oxide synthase (iNOS) expression was enhanced. LP-CQPC02-FSM, LB-FSM, and U-FSM inhibited constipation-induced nNOS, weakened eNOS expression, and enhanced iNOS expression. The effects of LP-CQPC02-FSM were better than those of LB-FSM and U-FSM.
mRNA
mRNA and protein expression levels of aquaporin-3 and aquaporin-9 in small intestinal tissues
Figure 9 shows that the aquaporin-3 (AQP3) mRNA and protein expressions were the strongest in the control group, whereas those of aquaporin-9 (AQP9) were the weakest. In the normal group, AQP3 mRNA and protein expressions were weakest in the small intestines, whereas those of AQP9 were the strongest. LP-CQPC02-FSM upregulated AQP9 expression and downregulated AQP3 expression in the constipated mice, making the AQP9 expression from LP-CQPC02-FSM stronger than that from LB-FSM and U-FSM, whereas AQP3 expression from LP-CQPC02-FSM was weaker than that from LB-FSM and U-FSM.
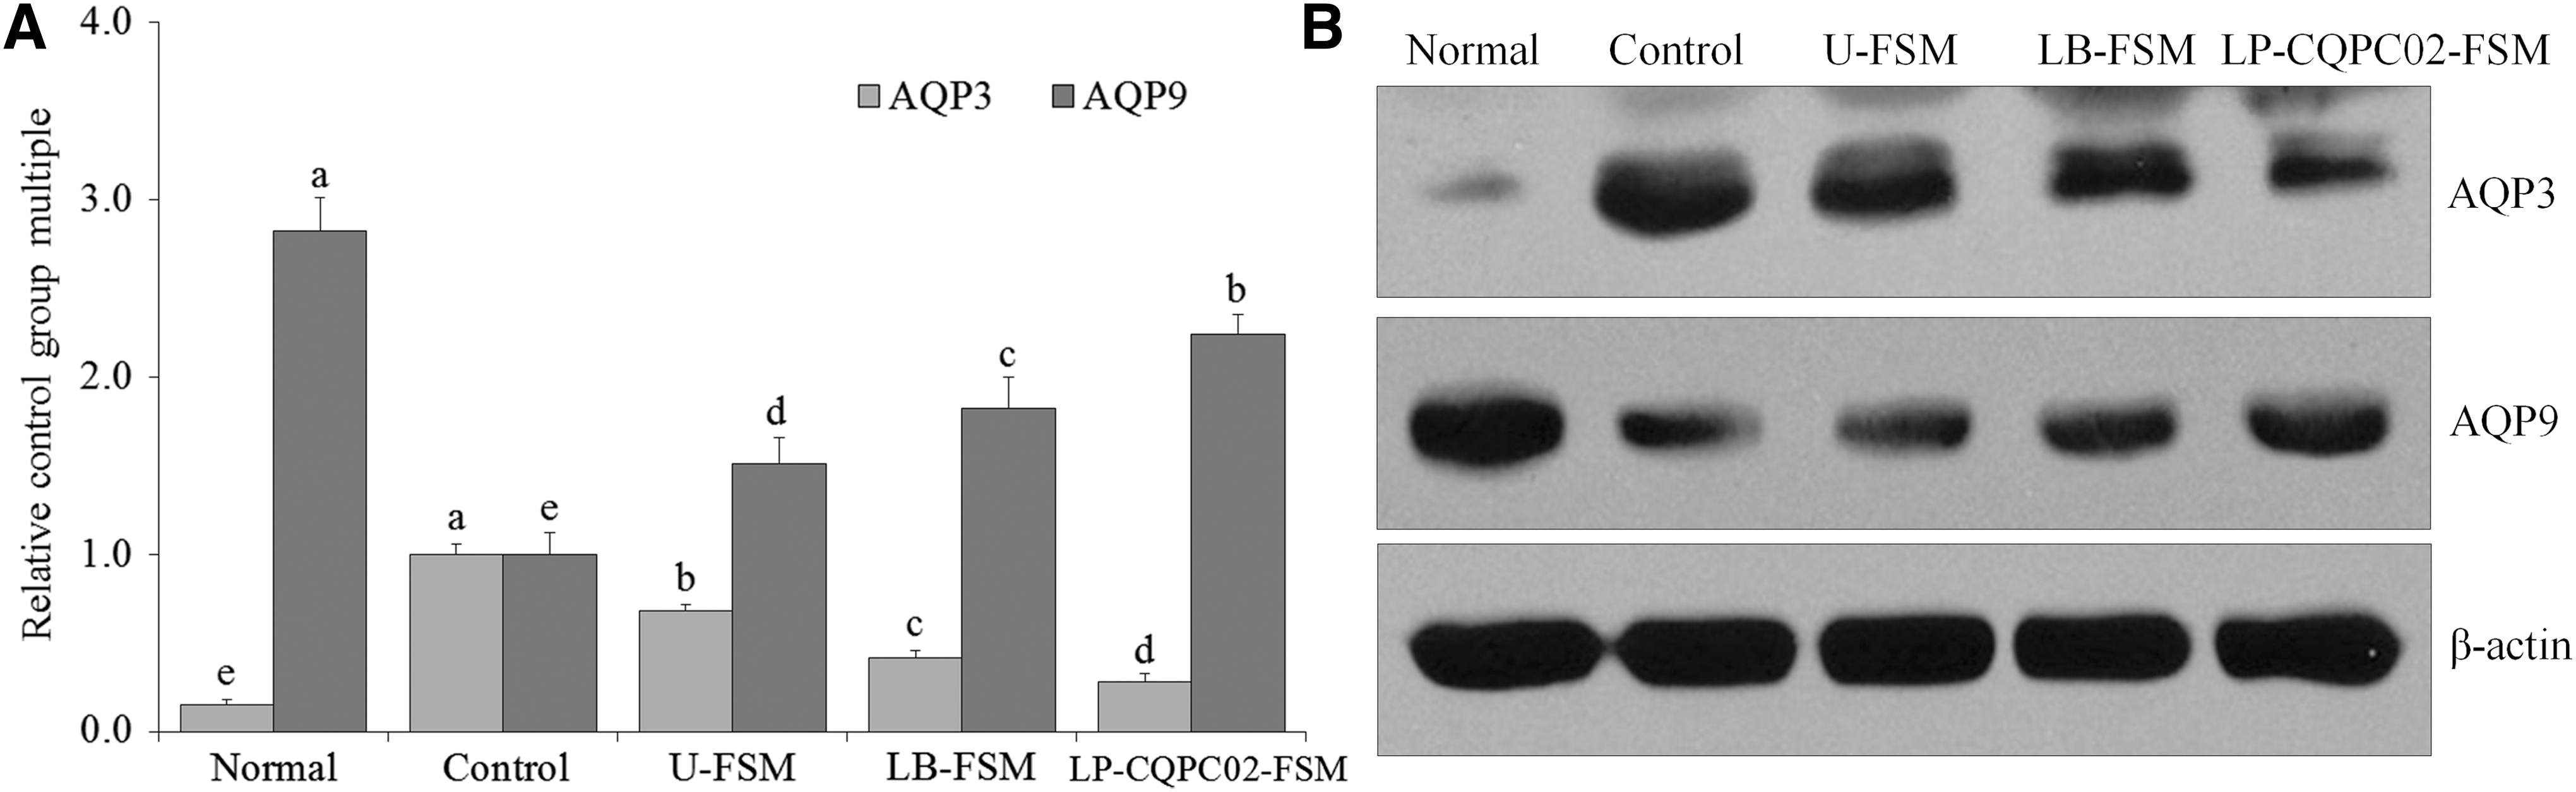
mRNA
Expression of microbial mRNA in mouse feces
Figure 10 shows that the Firmicutes abundance in the normal mouse feces was the lowest, whereas the Bacteroides and Akkermansia levels were the highest, and the Firmicutes/Bacteroides ratio was significantly lower than that of the other groups (P < .05).
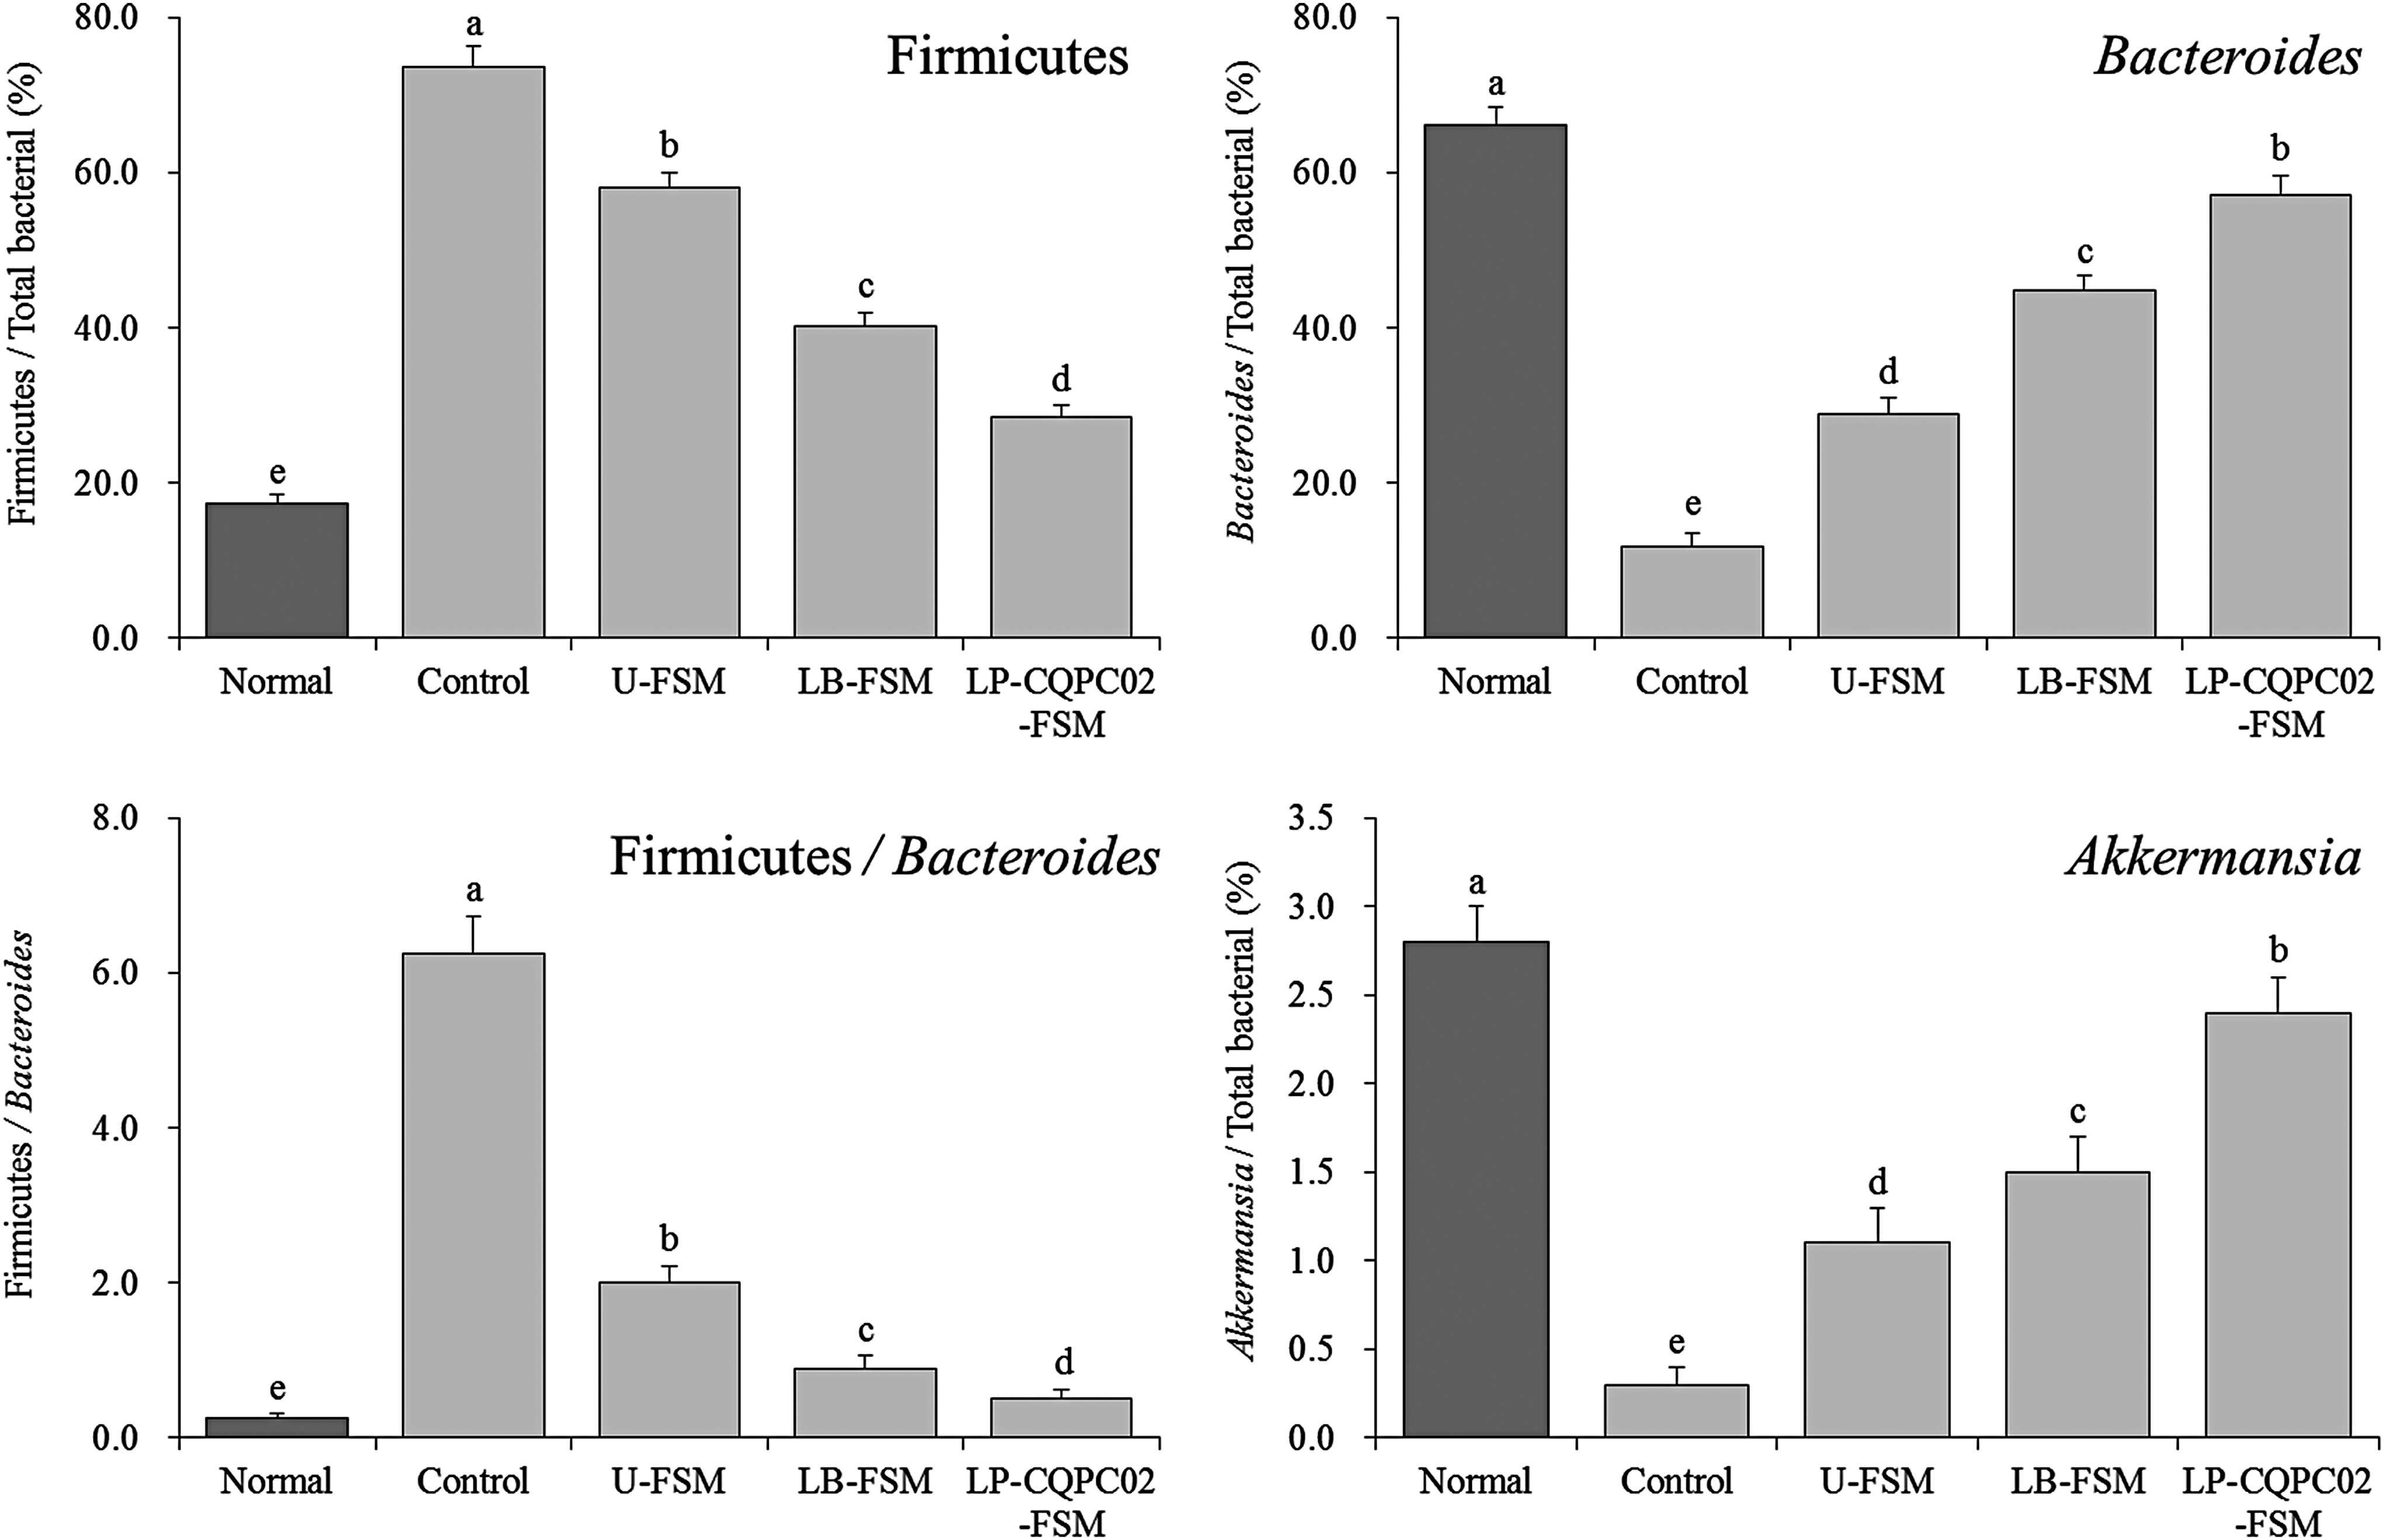
mRNA expression of microorganisms in the mouse feces. Values presented are the mean ± standard deviation (N = 10/group). a-eMean values with different letters in the same bars differ significantly (P < .05) by Duncan's multiple-range test.
The effects of soybean milk showed that, compared with the control group, the fecal levels of Firmicutes in the LP-CQPC02-FSM-, LB-FSM-, and U-FSM-treated mice decreased and the levels of Bacteroides and Akkermansia increased, and the Firmicutes/Bacteroides ratio significantly decreased (P < .05). LP-CQPC02-FSM also decreased the fecal level of Firmicutes in the constipated mice, increased the levels of Bacteroides and Akkermansia, and decreased the Firmicutes/Bacteroides ratio by significantly more than did LB-FSM and U-FSM, making the fecal microbial status of the U-FSM-treated mice near that of the normal mice.
Discussion
In experimental constipation animal models, weight, quantity, fecal water content, time to excretion of the first black stool, and the propulsive rate of activated carbon after gavage with activated carbon water are indicators of constipation status. 21 Studies have confirmed that more severe degrees of constipation significantly reduce the fecal quantity, weight, water content, time to discharge of first black stool, and the activated carbon propulsion rate in experimentally constipated mice. 21,22 In this study, fermented soybean milk inhibited the effects of constipation in mice. LP-CQPC02-FSM better alleviated constipation than did LB-FSM and U-FSM, confirming that LP-CQPC02-FSM can alleviate defecation difficulty in constipated mice.
A clinical study showed changes in neurotransmitter levels, including, MTL, Gas, ET, SS, AChE, SP, and VIP, in some patients with constipation. 23 MTL is an important index for evaluating GI peristalsis. MTL promotes movement in various parts of the GI tract, and abnormal reductions in MTL release will reduce GI peristalsis. 24 Gastrin is an important GI hormone, which promotes gastric juice secretion, increases GI peristalsis, accelerates gastric emptying, and promotes pyloric sphincter relaxation. 25 ET maintains normal intestinal function by maintaining vascular tension and cardiovascular stability. SS inhibits the release of GI hormones and reduces the gastric emptying speed and smooth muscle contractions, thereby exacerbating constipation. 26 AChE promotes GI peristalsis by binding to AChE receptors. 27
SP is an excitatory transmitter of GI motor neurons. It strongly promotes contraction of GI smooth muscle, stimulates water and electrolyte secretion from the small intestinal and colonic mucosa, and promotes GI peristalsis. 28 VIP stimulates intestinal peristalsis, thus promoting GI motility. 29 The results of this study showed that MTL, Gas, ET, AChE, SP, and VIP levels in the serum of the control group were significantly lower than those of the normal group, whereas the SS levels were higher than those of the normal group. LP-CQPC02-FSM may help return the levels of these neurotransmitters to a normal state in the constipated mice and help alleviate constipation.
Studies have shown that constipation can cause a series of abnormalities in the body, including obvious oxidative stress. MPO, NO, MDA, and GSH are indicators of significant changes after oxidative stress. 30,31 In this study, LP-CQPC02-FSM inhibited the constipation-induced abnormalities of MPO, NO, MDA, and GSH in mice.
In human metabolism, superoxide anions (O2 −) and oxygen-free radicals are involved in the body's physiological and biochemical reactions. When the body is unbalanced and oxygen-free radicals increase substantially, the body's metabolism will be abnormal. 32
A clinical study showed that Cu/Zn-SOD activity in constipated patients was lower than that in nonconstipated people, likely due to the long-term retention and stimulation of hard stool in the patient's intestines resulting in intestinal inflammation. 33 Mn-SOD is also decreased in cases of intestinal inflammation. 34 SOD can convert harmful superoxide-free radicals into hydrogen peroxide. Although hydrogen peroxide is a harmful reactive oxygen species, CAT can decompose it into harmless water. SOD and CAT can form an antioxidant chain to alleviate intestinal damage caused by constipation. 35 Our results showed that soybean milk improved constipation by regulating oxidation-related expressions, and LP-CQPC02-FSM had the best effect.
Another study showed that abnormal numbers, cell morphology, and network structures of interstitial cells of Cajal (ICC) can slow colonic peristalsis, which can induce constipation. c-Kit is a specific marker of ICC, and SCF is a c-Kit receptor ligand. Decreased ICC density in the small intestines of constipated patients is related to downregulated c-Kit gene expression in the sigmoid colon as well as downregulated c-Kit protein and gene expression. 36 The results of this study also showed that LP-CQPC02-FSM inhibited decreases in c-Kit and SCF expression in the small intestines of constipated mice, suggesting that LP-CQPC02-FSM can increase the number of ICC in constipated mice by upregulating c-Kit and SCF expressions, thereby alleviating constipation.
Activating TRPV1 can cause neurotransmitter release, intestinal dyskinesia, intestinal injury, and impaired intestinal function. Abnormal TRPV1 expression in patients with constipation has been demonstrated clinically. 37 GDNF regulates ganglion cells, which help repair intestinal tract damage and improve constipation. Constipation is associated with the intestinal nervous system and can cause muscle tension and weakened GI motility. 38 In this study, LP-CQPC02-FSM also played a role in ameliorating constipation in mice by regulating TRPV1 and GDNF expression levels.
NO is an inhibitory nonadrenergic and noncholinergic neurotransmitter in the GI tract and plays an important role in the regulation of GI motility. NO is ubiquitous in intestinal mucosa of patients with constipation. The abnormal increase of NO in intestinal mucosa of patients with constipation leads to the decrease of colonic motility and excitability. It can also cause relaxation of smooth muscle by increasing the concentration of cGMP in GI smooth muscle. The increase of NO content plays a promoting role in the pathogenesis of patients with constipation. Studies have shown that NO levels in serum and colonic mucosa of patients with constipation are significantly increased, and NO plays an important role in the pathogenesis of constipation. 39,40
Nitric oxide synthase (NOS) is the only rate-limiting enzyme in the process of NO synthesis. The change of its activity can directly affect the production of NO and its biological effects. 39 Therefore, NOS participates in regulating intestinal motility. NOS abnormalities can lead to imbalanced NO levels, affecting intestinal function and causing constipation. 41 Continuous increases in NO can cause more severe colonic dyskinesia. The three NOS subtypes include NOS1 (nNOS), NOS2 (iNOS), and NOS3 (eNOS). 42
Under normal conditions, NO in the vascular endothelial cells mainly comes from eNOS, and appropriate amounts of NO maintain the normal physiological functions of these cells. 43 nNOS expression in experimental animals with constipation is decreased significantly. 44 iNOS is not expressed in the normal state, but in cases of intestinal damage, a large amount of iNOS is produced, leading to excessive NO. Controlling these expressions can reduce NO content and alleviate obstetric constipation. 45 In this study, LP-CQPC02-FSM significantly upregulated eNOS and nNOS expression and downregulated iNOS expression, thus alleviating constipation.
AQP can induce constipation by affecting excessive water absorption and decreasing intestinal secretions in the intestine. 46 AQP3 participates in absorbing water in the intestinal cavity, and AQP3 overexpression aggravates water absorption in the colonic mucosa, leading to constipation. 47 AQP9 participates in colonic mucosal secretions, protects the mucosa and lubricates the intestinal tract to promote fecal excretion. Low AQP9 expression decreases mucus secretion in goblet cells leading to constipation. 48 In this study, LP-CQPC02-FSM helped inhibit constipation-induced decreases in AQP9 expression and increases in AQP3 expression.
Constipation can lead to intestinal flora disorders, induce many harmful bacteria (especially flagellated Gram-negative bacteria), lead to inflammation in various organs and body tissues, and eventually cause systemic low-grade chronic inflammation. The organs and tissues will show dysfunction, and the intestinal tract can directly reflect dysfunction due to intestinal microecology. 49
Intestinal flora disorders reduce the abundance of harmful bacteria, such as Firmicutes, and increase the abundance of beneficial bacteria, such as Bacteroides. Increases in Akkermansia abundance can significantly inhibit constipation occurrence and development. 50 Regulating the proportions of these microorganisms in the intestines can improve the intestinal environment, thereby alleviating constipation. 51 In this study, LP-CQPC02-FSM gavage also helped improve the intestinal microbial status in constipated mice and helped prevent constipation.
This study was the first to evaluate the effects of LP-CQPC02-FSM on constipation. LP-CQPC02-FSM worked well in improving constipation in mice, and its effect was better than that of commercial LB-FSM. Compared with LB-FSM, LP-CQPC02-FSM converted soybean isoflavones into free soybean isoflavones, which were more easily absorbed and used, so that the contents of the active substances could be increased to promote the inhibitory effect of soybean milk on constipation. In addition, LP-CQPC02-FSM improved the mice's intestinal microecology, thereby improving the intestinal environment and alleviating constipation. LP-CQPC02 may be a potential new high-quality functional food starter from fermented soybeans. The development and mechanisms of LP-CQPC02 in functional foods requires further in-depth study.
Footnotes
Author Disclosure Statement
No competing financial interests exist.
Funding Information
The present research was supported by the Program for Innovation Team Building at Institutions of Higher Education in Chongqing (CXTDX201601040) and the Research Project of Chongqing University of Education (KY2015TBZC), China.