
Abstract
Both serum and hepatic fatty acid (FA) compositions differ among nonalcoholic hepatic steatosis, nonalcoholic steatohepatitis, and healthy subjects. The severity of the above liver disease is closely associated with the concentration and composition of FAs. Our previous study found that phytosterol ester (PSE) could alleviate hepatic steatosis in nonalcoholic fatty liver disease rats. The aims of this work were to explore the effects of PSE (0.05/100 g·body weight) on FA profiles and the mRNA levels of FA metabolism-related genes. Compared with a high-fat diet alone group, PSE treatment significantly decreased hepatic saturated fatty acid levels (P < .05) and increased monounsaturated fatty acid (especially C16:1 n-7) levels in the liver, serum, and adipose tissue and polyunsaturated fatty acid levels in the serum and liver (P < .05) after 12 weeks of intervention. In particular, PSE treatment increased the level of C22:5 n-3, an FA that was negatively correlated with the degree of hepatic steatosis in the serum, liver, and adipose tissue. The increases in some unsaturated fatty acids are probably related to the upregulation of stearoyl-coenzyme A desaturase-1 and fatty acid desaturase-1.
Introduction
Nonalcoholic fatty liver disease (NAFLD) is emerging as one of the most common liver disorders around the world. Epidemiological data show that the prevalence of NAFLD ranges from 20% to 30% of the general population; in western countries, 1 it varies from 5% to 40% in the Asian-Pacific region. 2
Although NAFLD is a benign form of liver dysfunction, it can gradually progress to nonalcoholic steatohepatitis (NASH) (a necroinflammatory condition that affects 2–3% of adults). Approximately 20% of NASH patients are at risk for developing cirrhosis, and 2–5% cirrhosis patient may progress to hepatocellular carcinoma. 3 Previously, studies showed that both serum and liver fatty acid (FA) composition differed among nonalcoholic steatosis subjects, NASH patient and healthy controls. 4,5 The disease severity is well correlated with the levels and composition of FAs.
Kalhan et al. 6 investigated the plasma profiles of subjects with NAFLD, steatosis, and NASH, and showed that the plasma long-chain FA levels were lower in NASH subjects. One study that examined the role of diet-environment interactions on fatty liver disease showed that the metabolites of short-chain and medium-chain FA decreased when the animals were treated with arsenic and a high-fat diet (HF). 7 Another study demonstrated that steatosis and fibrosis were ameliorated in thioacetamide-induced cirrhosis in rats fed a diet rich in C18:1 (oleic acid) for 2 weeks. 8 These data suggested that the composition of different FAs is an important factor influencing liver damage. 9
Intracellular triglyceride is hydrolyzed into free fatty acids (FFAs) and glycerol by various lipases, and then released into the blood and utilized by the body tissues. For example, the hormone-sensitive lipase is an essential enzyme for hydrolysis of diacylglycerol and cholesteryl ester in adipose tissue, which needs the intrinsic ligands or proligands for PPAR-γ (peroxisome proliferator-activated receptor-γ) to modulate adipose metabolism. 10 PPAR-γ activation is an important factor in the development of fatty liver. Decreased PPAR-γ can lead to reduced energy expenditure, resulting in FA accumulation in the liver to form fatty liver. 11
Phytosterols (PSs) are a group of compounds that exist in plant oils, grain, and other food materials, and are well known for their cholesterol-lowering bioactivities. 12 Esterification treatment (phytosterol ester, PSE) can improve the dissolution characteristics of PSs. Our previous study found that PSE treatment (0.05/100 g·body weight [BW], which equates to 3 g/day in humans) could significantly reduce the levels of hepatic triglyceride, total cholesterol, and especially, hepatic FFAs in comparison with the high-fat treatment alone group. The levels of inflammatory factors, such as transforming growth factor-β, interleukin-10, and C-reactive protein, were significantly decreased after PSE treatment. Furthermore, PSE treatment increased the superoxide dismutase activity and decreased xanthine oxidase activity and malondialdehyde levels.
The above data indicated that PSE intervention could effectively ameliorate the “two hit” pathological process of NAFLD. The upregulation of mRNA expression of hepatic PPAR-α, PPAR-γ, liver X receptor-a (LXR-a) and elongation of very-long-chain fatty acid enzyme-2 (ELOVL-2) after PSE treatment might also contribute to these beneficial effects. 13 The ELOVL family is involved in the elongation of FAs of different lengths and regulates FA metabolism. For example, ELOVL-2 is involved in prolonging the polyunsaturated fatty acids (PUFAs) C:20 and C:22 (C20:4, n-6; C20:5, n-3; C22:4, n-6; and C22:5, n-3). Hence, we hypothesize that PSE may exert its ameliorating effect on NAFLD partly by the regulation of FA metabolism.
To verify the above hypothesis, we performed gas chromatography-mass spectrometry (GC-MS) to analyze the FA profiles of plasma, liver, and adipose tissues of rats after treatment with PSE and an high fat diet, and the preliminary mechanism was investigated by detection of the mRNA levels of FA metabolism-related genes.
Materials and Methods
Composition of PSE
The PSE product was supplied by BASF China Ltd (Shanghai, China). PSEs (total PSE and PS content ≥97%: PSE content ≥91%, free PS content ≤6%) had the following chemical composition: β-sitosterol 42.0–55.0%, campesterol 20.0–29.0%, stigmasterol 12.0–23.0%, brassicasterol ≤6%, D5-oats sterol ≤4%, D7-stigmasterol ≤2%, D7-oats sterol ≤2%, cholesterol ≤2%, and other ≤5%.
The preparation of PSE-fortified skimmed milk
Fat-soluble PSE was added into skimmed milk, fully liquefied in a 65°C water bath, and homogenized with skimmed milk at high pressure to obtain a homogeneous emulsion (0.05 g/mL).
Reagents
Chloroform (102445, analytical grade) and methanol (100837, chromatographic grade) were purchased from Merck KGaA (Shanghai, China). Analytical grade sulfuric acid (10021618) and n-hexane (40115184000) were purchased from Sinopharm Chemical Reagent company (Shanghai, China), respectively. An internal standard substance, nonadecanoic acid-methyl ester (N5377-1G [purity 98.9%]), was purchased from Sigma-Aldrich (Shanghai, China).
Rats and intervention
Male Sprague Dawley rats (120 ± 10 g, 4 weeks old) were purchased from Shanghai Slack Laboratory Animal Company (Laboratory animal production license no. SCXK(Hu) 2012-0002) (Shanghai, China). The rats were caged under specific pathogen-free conditions and fed mouse chow and tap water ad libitum. All of the animal experiment protocols used in this study were approved by the Experimental Animal Research Committee of Shanghai Jiaotong University.
Following a 7-day acclimatization period, 18 Sprague Dawley rats were randomized into the following three groups: normal control (NC), HF, and PSE intervention (HF+PSE). The NC group was provided with basic feed (≤10% moisture content, ≥20% crude protein, ≤5% crude fiber, ≥4% crude fat, ≤8% crude ash, and 1.6–5.1% minerals and amino acids), whereas the HF and HF+PSE groups were provided with high-fat feed (54.0% standard diet, 18.4% lard, 10% saccharose, 10% casein, 2% choline salt, 1% cholesterol, 2.7% maltodextrin, and 1.9% other). The animals in the PSE treatment group were administered orally with PSE-fortified skimmed milk (1 mL/100 g·BW) once a day for 12 consecutive weeks. The PSE intervention group was administered 0.05/100 g·BW of PSE. Skimmed milk was used as a control in the NC and HF groups.
After 12 weeks of intervention, the rats were fasted overnight, weighed, anaesthetized with pentobarbital sodium (2%, 40 mg/kg·BW), and euthanized by cervical dislocation. Blood samples were drawn from the abdominal aorta, and the serum was obtained after coagulation and low-speed centrifugation (3509 × g at 4°C for 10 min). Livers and bilateral perirenal lipids were rapidly removed and weighed.
The fresh liver samples from each rat were immediately fixed in 10% phosphate-buffered formalin, and the other tissues were flash-frozen in liquid nitrogen, and then kept at −80°C.
Determination of liver index, abdominal index, liver function, and serum FA levels
The liver index = liver weight/body weight, and the abdominal index = bilateral perirenal lipid weight/body weight. Serum FA levels and liver function were analyzed using a Hitachi 7600 analyzer (Hitachi Ltd., Tokyo, Japan).
Sample preparation
Hepatic tissue (200 mg) or adipose tissue (40 mg) was ground and the total lipids were ultrasonically extracted for 20 min using chloroform/methanol (2:1, v/v) as the solvent. The samples were transesterified in methanol in the presence of 5% (v/v) H2SO4 (80°C, 1.5 h). Water (1.5 mL) and n-hexane (1 mL) were sequentially added, vortexed for 3 min, and centrifuged for 10 min to obtain FA methyl esters. Organic phases were evaporated under N2 gas. Then the samples were taken up into the n-hexane before GC analysis. 14
The lipids in the serum (200 μL) were transesterified using the same method as that for the tissue mentioned above without the extraction process.
Analysis of FA profiles in the liver, serum, and adipose tissue
GC-MS analysis was performed using gas chromatography coupled to a quadrupole mass spectrometer (Agilent, USA; 7890-5975). Separation was done on a capillary column (JQW122-5532 DB5MS, 30 m × 250 μm × 0.25 μm). Helium was used as the carrier gas at a flow rate of 1 mL/min. The temperature of the injector was 270°C and was splitless. FA methyl esters were separated at a constant flow with the following temperature program: (1) 75°C for 5 min; (2) increase to 200°C (25°C/min); (3) increase to 260°C (2°C/min); (4) increase to 280°C (20°C/min); and (5) 280°C for 9 min. The transfer line was kept at 280°C. The ionic source temperature was set at 230°C, and the electron energy was set at 70 eV. The temperature of the quadrupole was set at 150°C; the full scanning mode, the mass spectrometer scanning range: 33–550 m/z. Determination of the nature of the FA methyl esters was performed using a standard spectrogram of FAs from the NIST Mass Spectral Database. Quantitation was determined after normalization to the internal standard (nonadecanoic acid-methyl ester).
Histological analysis
The fixed liver samples (1 × 0.6 × 0.2 cm) were embedded in paraffin blocks and sliced. Five-micrometer tissue sections were subjected to hematoxylin and eosin staining and observed using an optical microscope.
RNA preparation and quantitative real time-polymerase chain reaction
Approximately 50–100 mg liver tissues of each sample was extracted using a TRIzol reagent (TakaRa, Dalian, China). Then the cDNA was synthesized promptly using SuperScript III reverse transcriptase (Invitrogen, USA). mRNA expression levels of fatty acid desaturase-1 (FADS1), FADS2, carnitine palmitoyltransferase 1 (CPT1), and stearoyl-coenzyme A desaturase-1 (SCD1) were detected using SYBR Premix Ex Taq™ (Takara) commercial kit. All signals were normalized against β-actin and the 2−ΔΔCt was used to quantify the fold change. The primers used are listed in Table 1.
Primer Sequence of Genes
Hepatic fat content determination
The hepatic fat content was analyzed according to Folch J's method. 14 Briefly, 1 g of liver tissue sample was weighed, 10 mL of chloroform/methanol was added (2:1), and the mixture was homogenized, sonicated at 400 W for 20 min, and centrifuged at 444 g for 5 min. The supernatant was evaporated in a 70°C water bath until dry and oven-heated to a constant weight, and the total mass of fat in 1 g of liver was obtained by weighing.
Statistical analysis
Data are presented as the mean ± standard deviation. Comparisons among groups as well as Pearson correlation analysis between specific FAs and the degree of hepatic steatosis (described as liver lipid content) were carried out using SPSS 19.0. Comparisons among groups were statistically analyzed using one-way analysis of variance (ANOVA) followed by least significant difference multiple comparison tests. P < .05 was considered to indicate statistical significant significance. Partial least square-discriminant analysis (PLS-DA) was carried out using SIMCA-P 11.5.
Results
PSE intervention ameliorated the degree of hepatic steatosis in NAFLD rats
Pathological changes in the degree of liver steatosis in different groups were examined, and some of the observed results are shown in Figure 1A–C. Our results indicated that the morphology of the NC group exhibited obvious lobular structures, the hepatic sinusoid was orderly, and the boundaries between the liver cells were obvious (Fig. 1A). Rat livers from the HF group showed damaged lobular structures and significant steatosis, which exhibited enlarged liver cells, absence of the hepatic sinusoid, damaged cell membranes and a large number of lipid droplets (Fig. 1B). Compared to the HF group, the boundaries of the liver cell from the PSE group became more obvious and it was possible to identify the lobular structures. Furthermore, liver cell did not display large lipid vacuoles or numerous lipid droplets, and the area covered with lipid droplets was greatly reduced (Fig. 1C).

Liver histology examination and lipids content of NAFLD rats in each groups.
These results suggested that an HF led to fat accumulation in the liver, causing steatosis, and that PSE intervention alleviates the degree of steatosis. Hepatic lipid quantitative analysis directly proved the above histopathology results, showing that the HF significantly increased the hepatic lipid levels (P < .01). After PSE intervention, the hepatic lipid levels significantly declined when compared to the HF group (P < .05) (Fig. 1D).
In our previous study, the average food consumption of the rats in HF and HF+PSE groups was only slightly lower compared with the rats in the NC group, whereas the weights of the rats in the HF group were slightly higher than those in the NC group at the end of the experiment. 13 This result suggests that PSE treatment had no influence on the growth and food intake of rats and that the ameliorating effect of PSE on liver steatosis is attributable to its regulatory role in lipid metabolism instead of BW control.
PSE intervention could improve other biological parameters in NAFLD rats
To further verify the beneficial effect of PSE on NAFLD, the liver index, abdominal index, partial parameters of liver function, and serum FA levels were determined (as shown in Fig. 2A–C and Table 2). The results showed that PSE treatment could significantly reduce the liver index (P < .01) and the abdominal index (P = .059) relative to those of rats in the HF group (Fig. 2A, B).
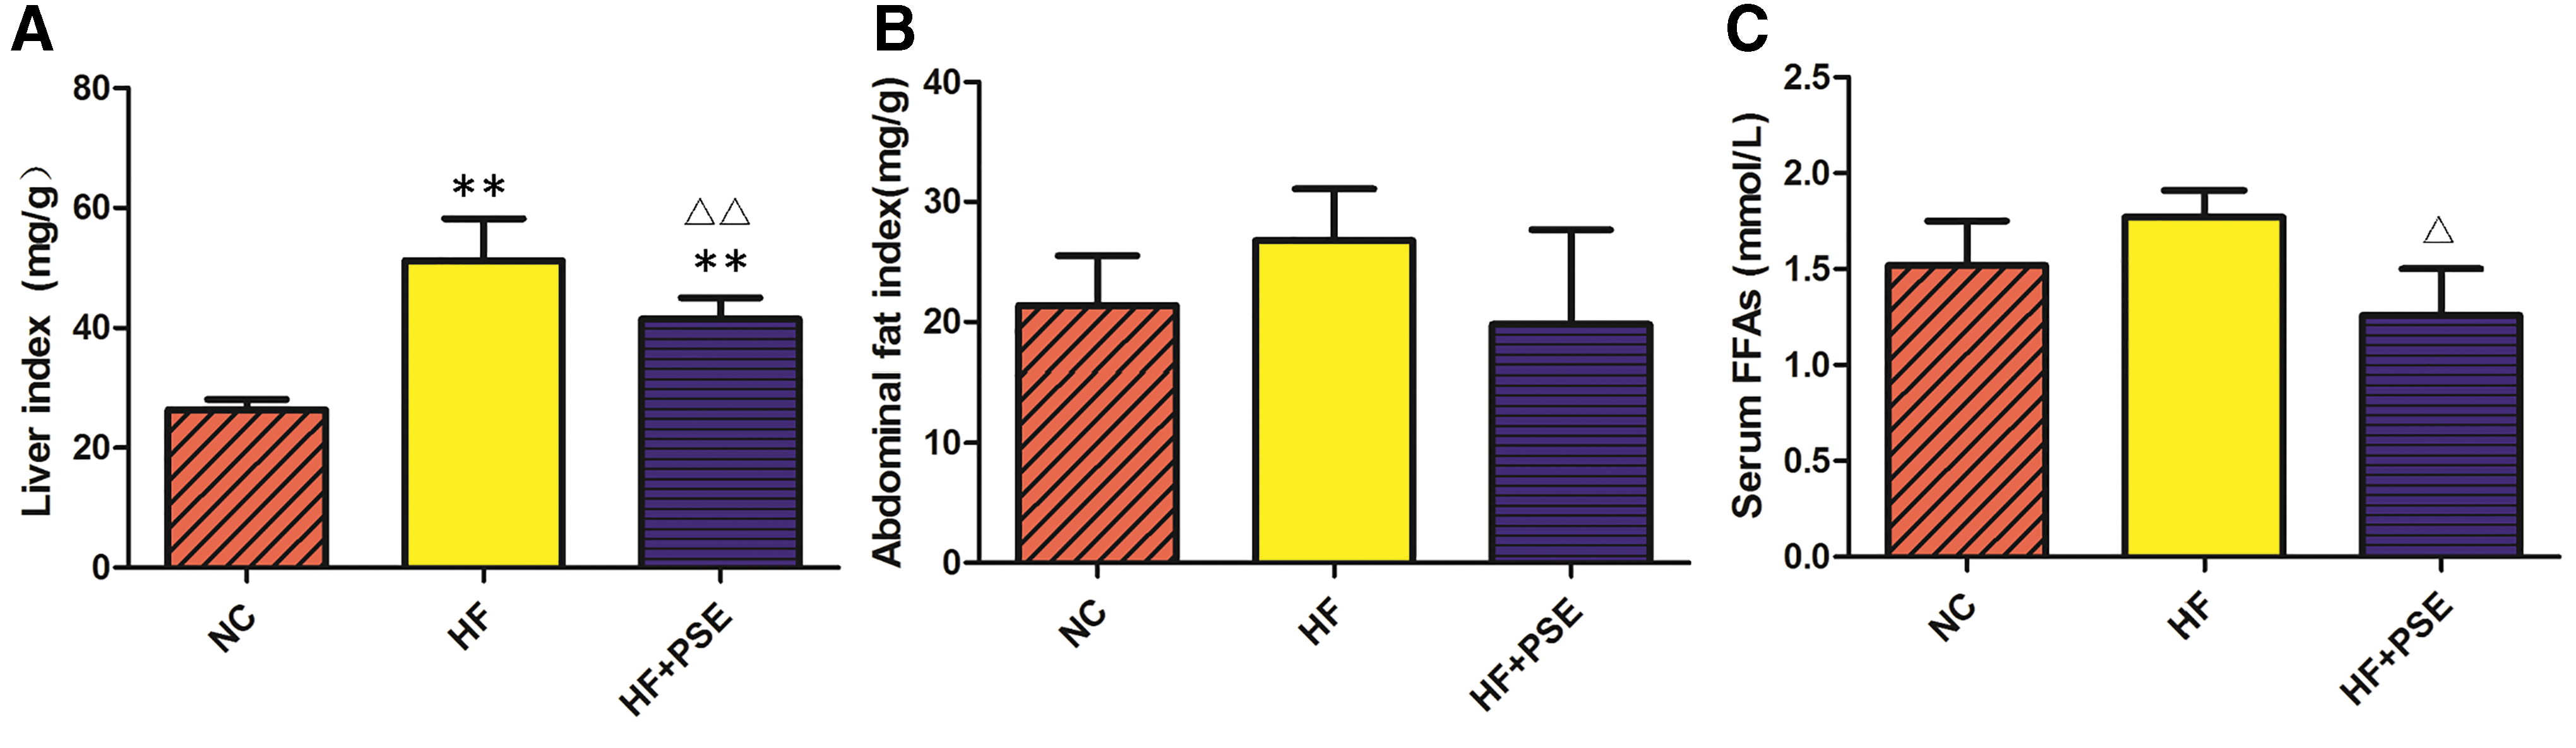
Effect of PSE on the liver index, abdominal index, ALT/AST, and serum FFA levels of NAFLD rats in each group.
Effect of Phytosterol Ester on Partial Liver Function Parameters of Rats
Data are presented as the mean ± standard deviation (n = 6). * P < .05 versus NC, ** P < .01 versus NC, Δ P < .05 versus HF.
ALT, alanine aminotransferase; AST, aspartate aminotransferase; HF group, high-fat diet group; HF+PSE group, high-fat diet and PSE treatment group (0.05/100 g·body weight); NC group, normal control group; PSE, phytosterol ester.
Importantly, aspartate aminotransferase (AST) and alanine aminotransferase (ALT) are commonly used indicators for the clinical detection of liver function. When liver cells are damaged and the permeability of the liver cell membrane is increased, the activity of these two enzymes in the serum rapidly increases. Clinically, the ratio of AST to ALT is often used to understand the recovery state of liver function and damage to liver cells. This study indicated that HF promotes hepatic steatosis, which was harmful to liver cells and increased the activities of serum AST and ALT; the ratio of ALT to AST in the HF group also significantly increased in comparison with that in the NC group (P < .01). While PSE treatment could alleviate damage from the high fat diet to liver cells. The ALT and AST activities, as well as the ratio between ALT and AST (P < .05) in the PSE group were lower than those in HF group (Table 2).
PSE treatment reduced the levels of saturated fatty acids and increased the levels of monounsaturated fatty acids and PUFAs in NAFLD rats
Considering that relatively high levels of FFAs are toxic and can lead to insulin resistance, the serum FFA content of each group was analyzed. The results showed that PSE treatment significantly reduced serum FFA levels in comparison with the HF group (P < .01) (Fig. 2C). Then, the FA profiles in serum and hepatic and adipose tissue in the PSE treatment group were determined in this study. The levels of hepatic total saturated fatty acids (SFAs) and monounsaturated fatty acids (MUFAs) in the HF group were significantly increased in comparison with those in the NC group. In contrast, PSE treatment significantly reduced the levels of SFAs by 26.69% and increased the levels of MUFAs and PUFAs by 39.66% and 21.68%, respectively, in comparison with those of the HF group (P < .05) (Fig. 3A).
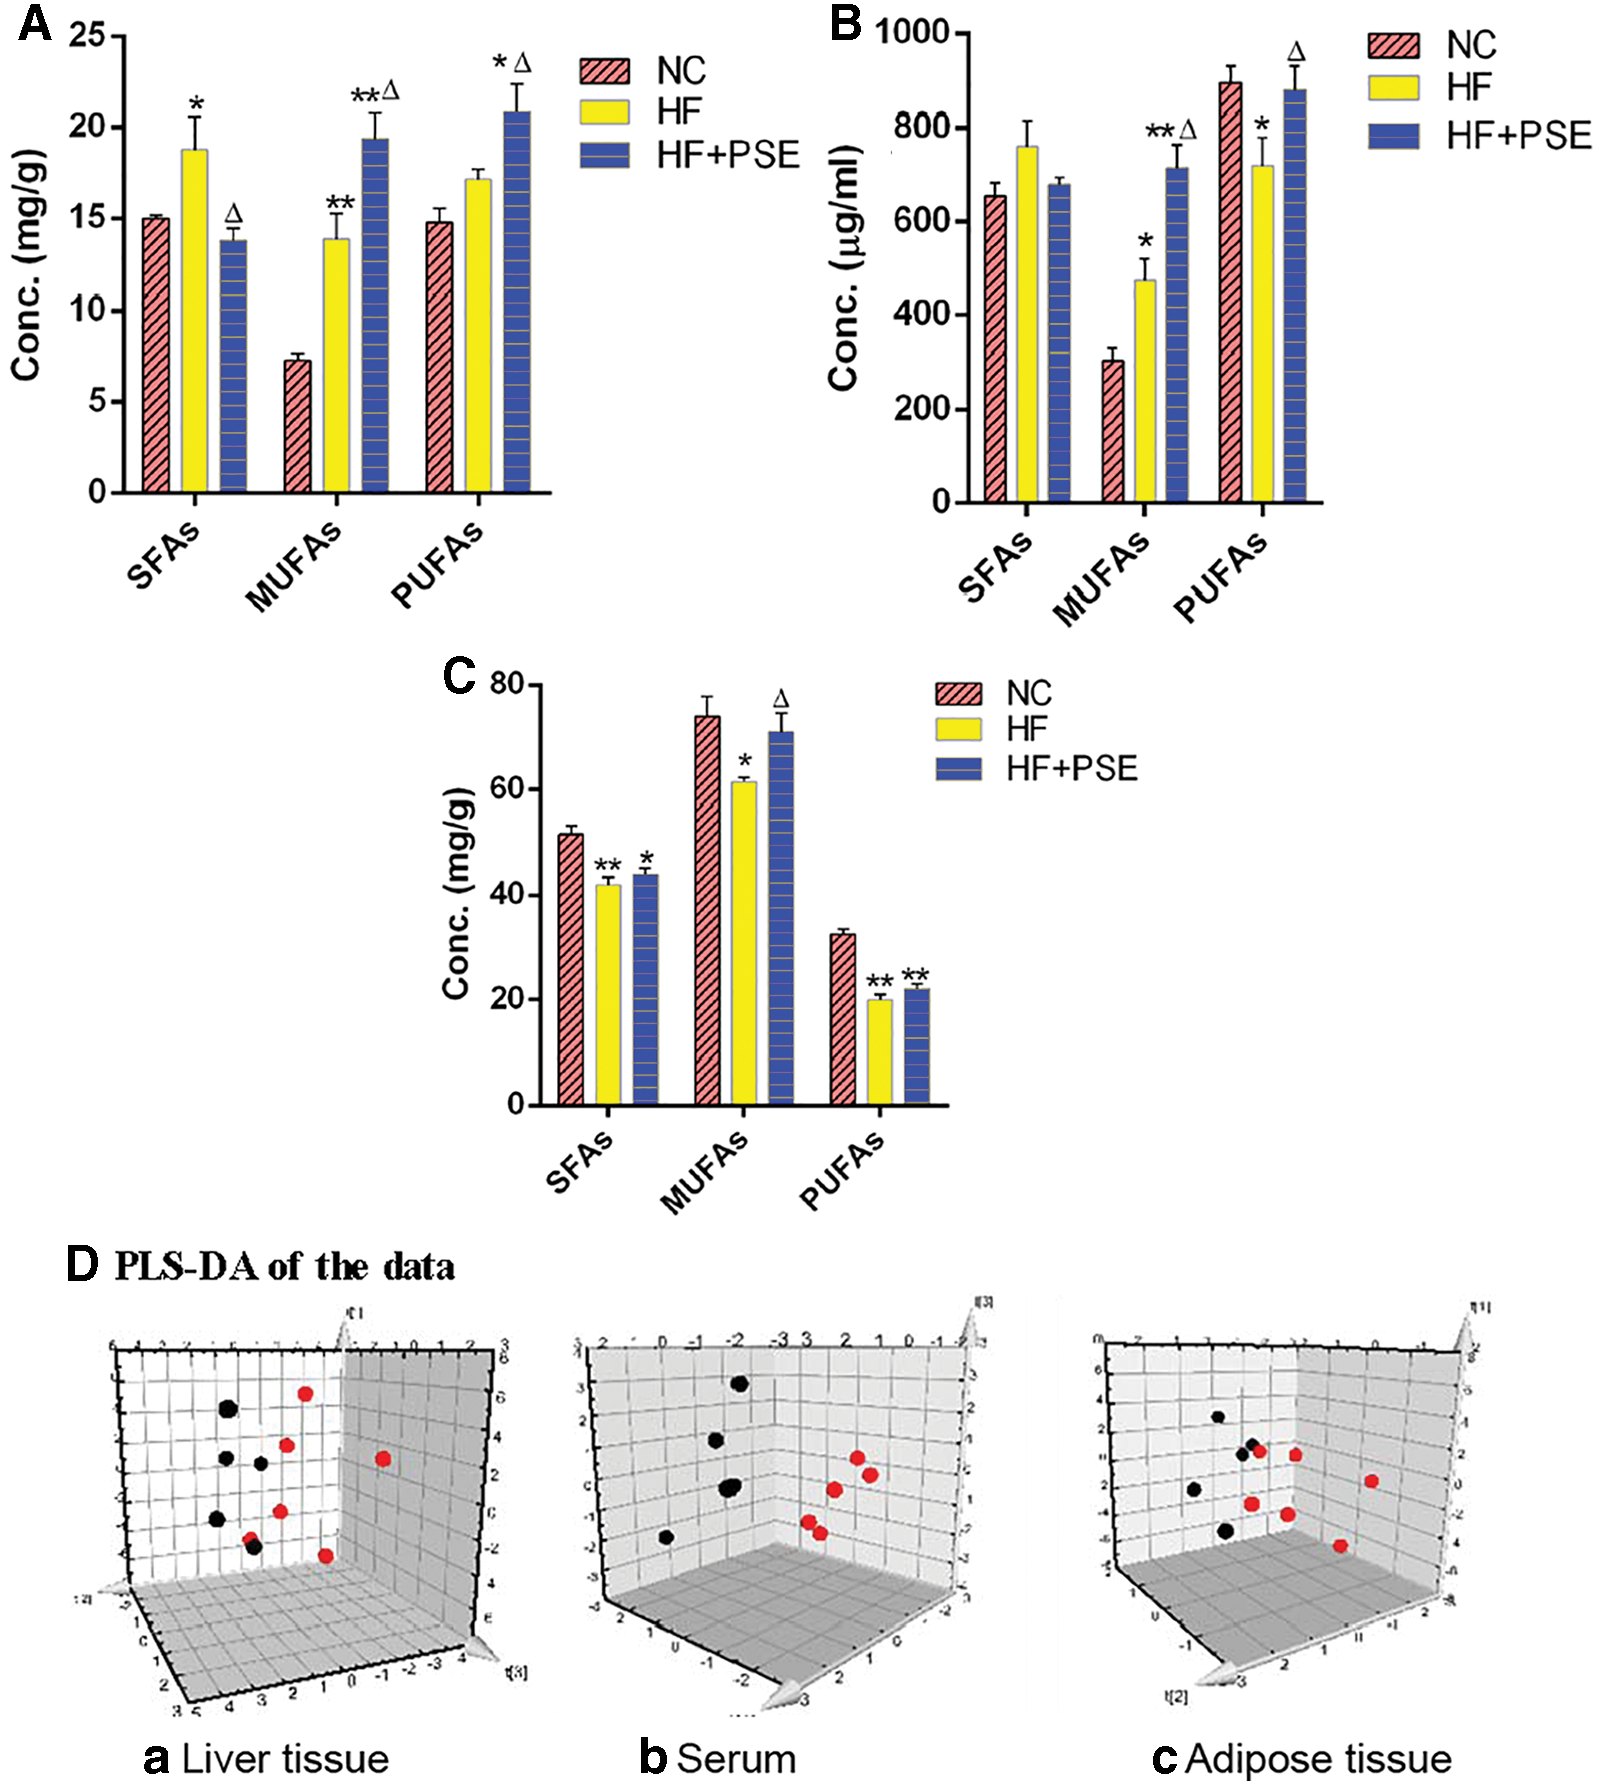
The effect of PSE on total levels of SFAs, MUFAs, and PUFAs.
The variations in serum SFAs and MUFAs in each group showed similar trends to those of the liver. Total SFA and MUFA levels in the HF group were increased compared with those in the NC group (P < .05), whereas PSE treatment reduced SFA levels and significantly increased MUFA levels (P < .05) in comparison with those of the HF group. It is worth mentioning that the levels of serum PUFAs in the PSE treatment group significantly increased by 22.26% in comparison with those in the HF group, which were close to those of the NC group (Fig. 3B).
The FA profiles of adipose tissue were also investigated in our study. As shown in Figure 3C, SFA, MUFA, and PUFA levels in the HF group were significantly lower than those in the NC group. MUFA levels in the PSE group were significantly higher relative to the HF group. SFA and PUFA levels in the PSE group were slightly higher than those in the HF group.
To further explore the differences between the PSE intervention and HF groups, a three-component PLS-DA model was established. The FA composition of rats from the HF group significantly changed, since most of the dots in the HF group were far from those in the PSE group (Fig. 3D [a–c]). These results indicate that PSE intervention can result in FA profiles that are distinct from those produced by feeding HF diets alone.
PSE treatment could change the FA lipid profiles of NAFLD rats
Figure 4A shows that the C14:0, C18:0, C20:0, C22:0, C23:0, and C24:0 SFAs significantly increased in the HF group in comparison with those in the NC group, whereas PSE intervention decreased the levels of those SFAs compared with those in the HF group (except C14:0).
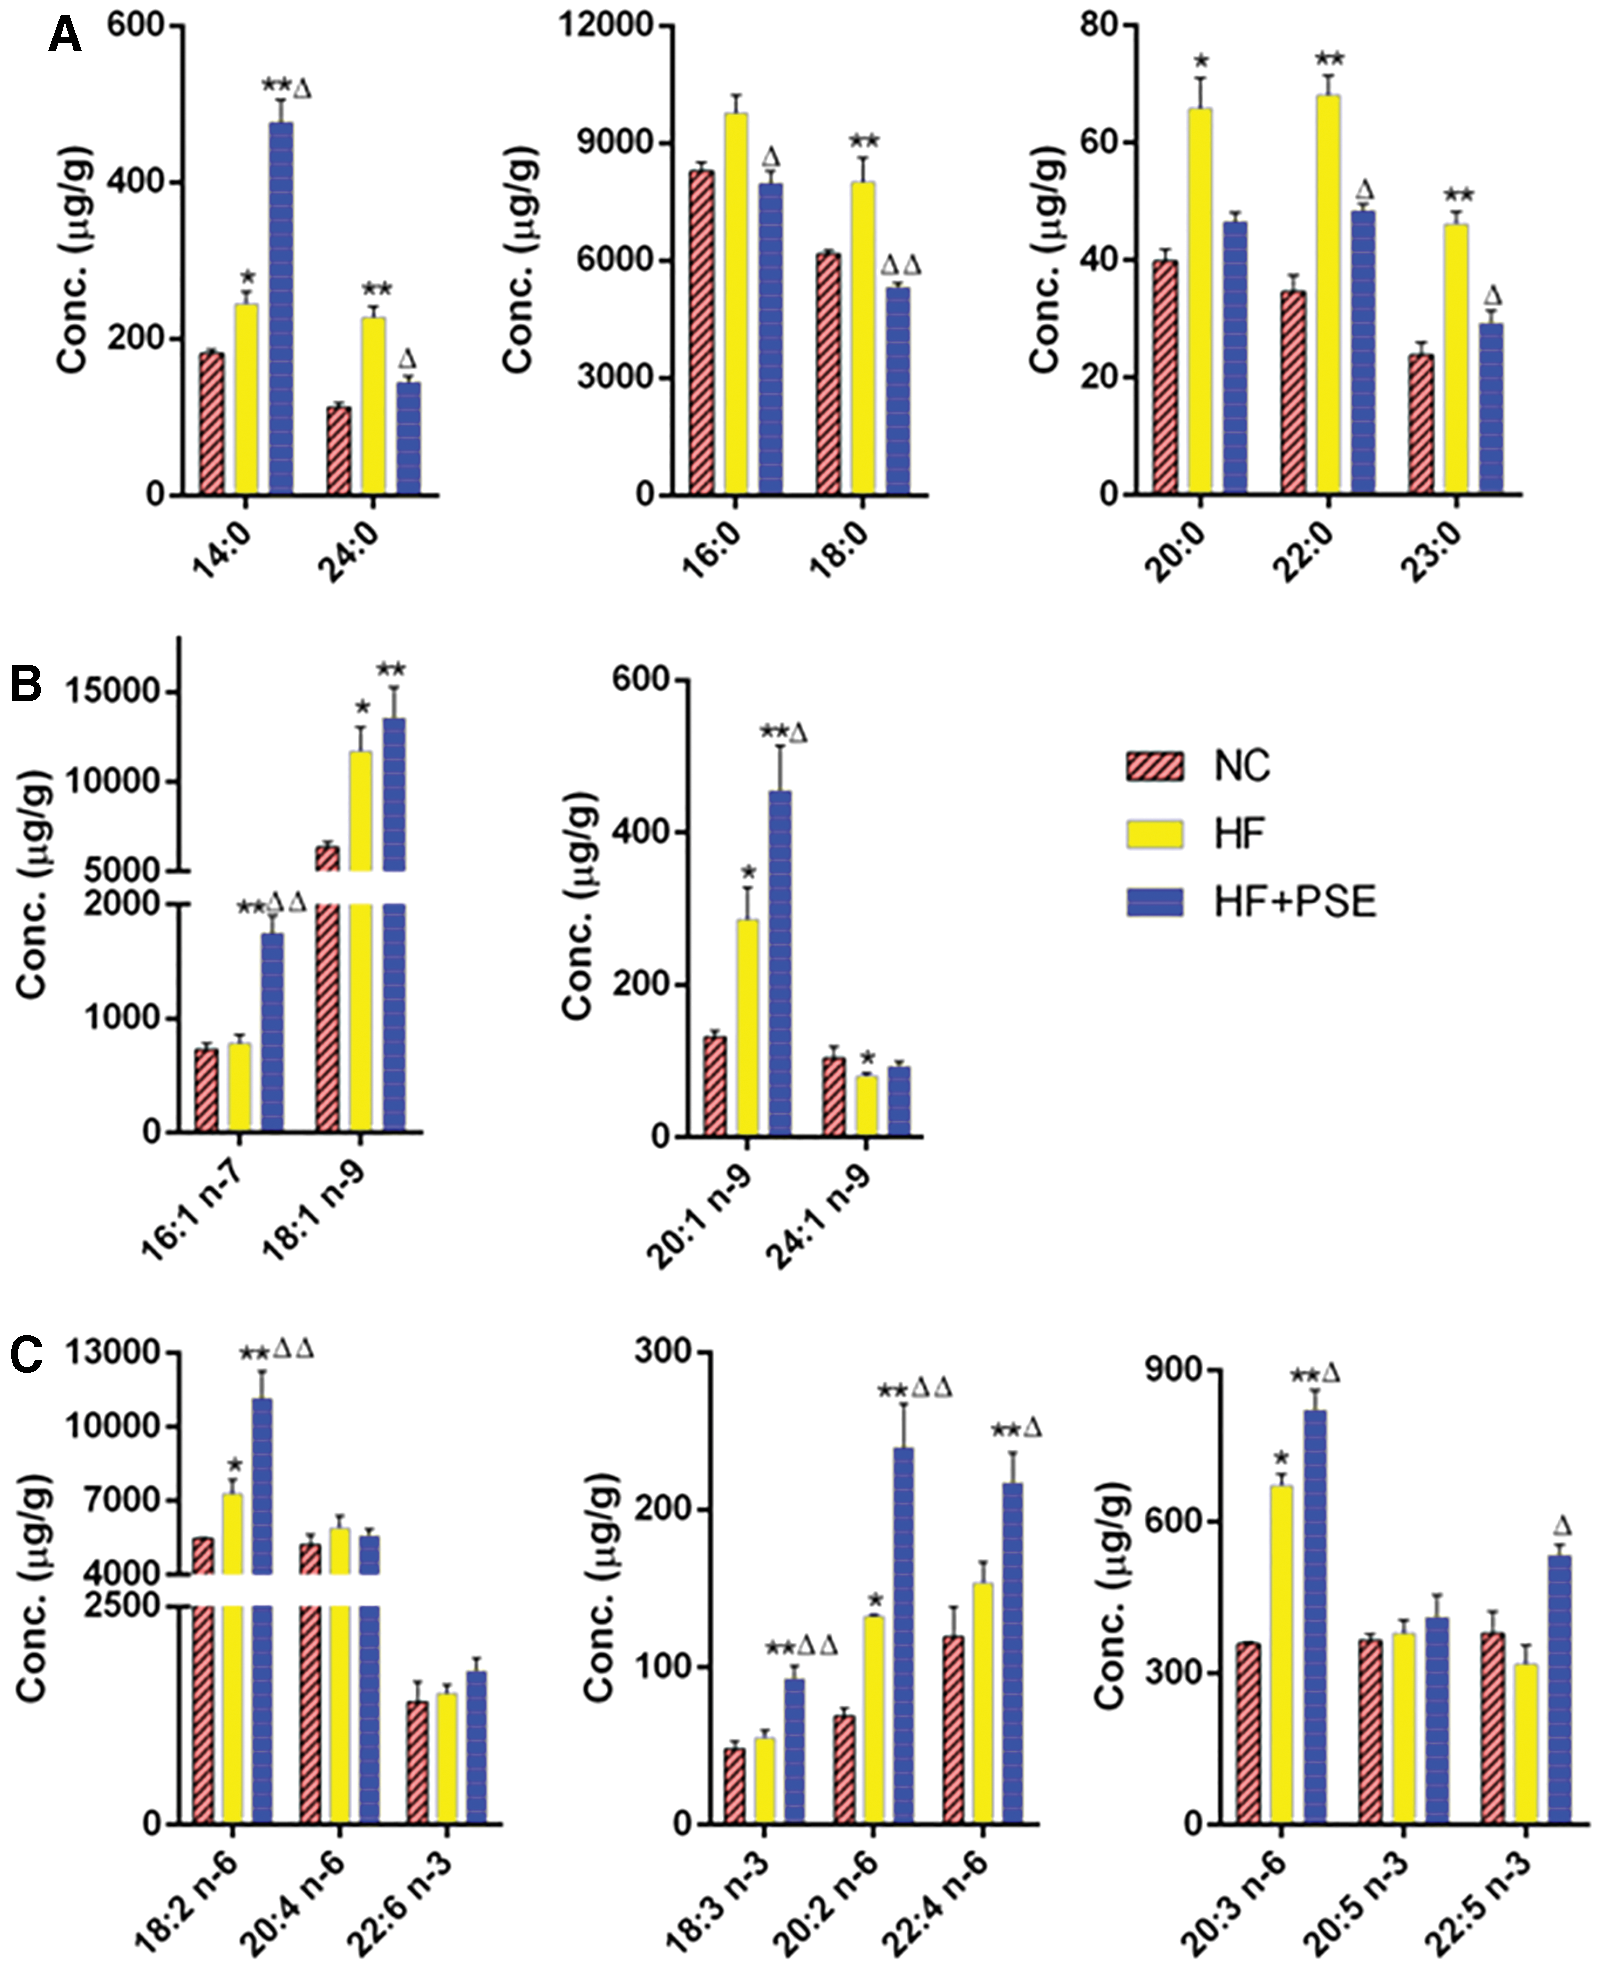
The hepatic tissue FA profile in each group.
The C18:1 n-9 and C20:1 n-9 MUFAs were significantly increased in both the HF and PSE groups (P < .05), whereas the levels of C16:1 n-7 (P < .01) and C20:1 n-9 (P < .05) were remarkably increased by PSE treatment (Fig. 4B). The HF alone significantly decreased the level of C24:1 n-9 in comparison with that of the NC group (P < .05), whereas the levels of this FA were similar in the NC and PSE groups. For PUFAs, the HF significantly increased the contents of C18:2 n-6, C20:2 n-6, and C20:3 n-6 in comparison with those in the NC group (P < .05). PSE treatment significantly increased C18:2 n-6, C18:3 n-3, C20:2 n-6, C20:3 n-6, C22:4 n-6, and C22:5 n-3 levels in comparison with those in the HF group (Fig. 4C).
With respect to specific FAs in serum, HF alone increased the levels of all SFAs, including C14:0, C16:0, C18:0, C20:0, C22:0, C23:0, and C24:0, in comparison with those in the NC group, whereas most of the SFAs showed opposite tendencies in the PSE group (except C14:0). In particular, PSE intervention significantly decreased C16:0, C20:0, C22:0, and C24:0 levels compared with those in the HF group, which exhibited the same trends as those in liver (Figs. 4A and 5A).
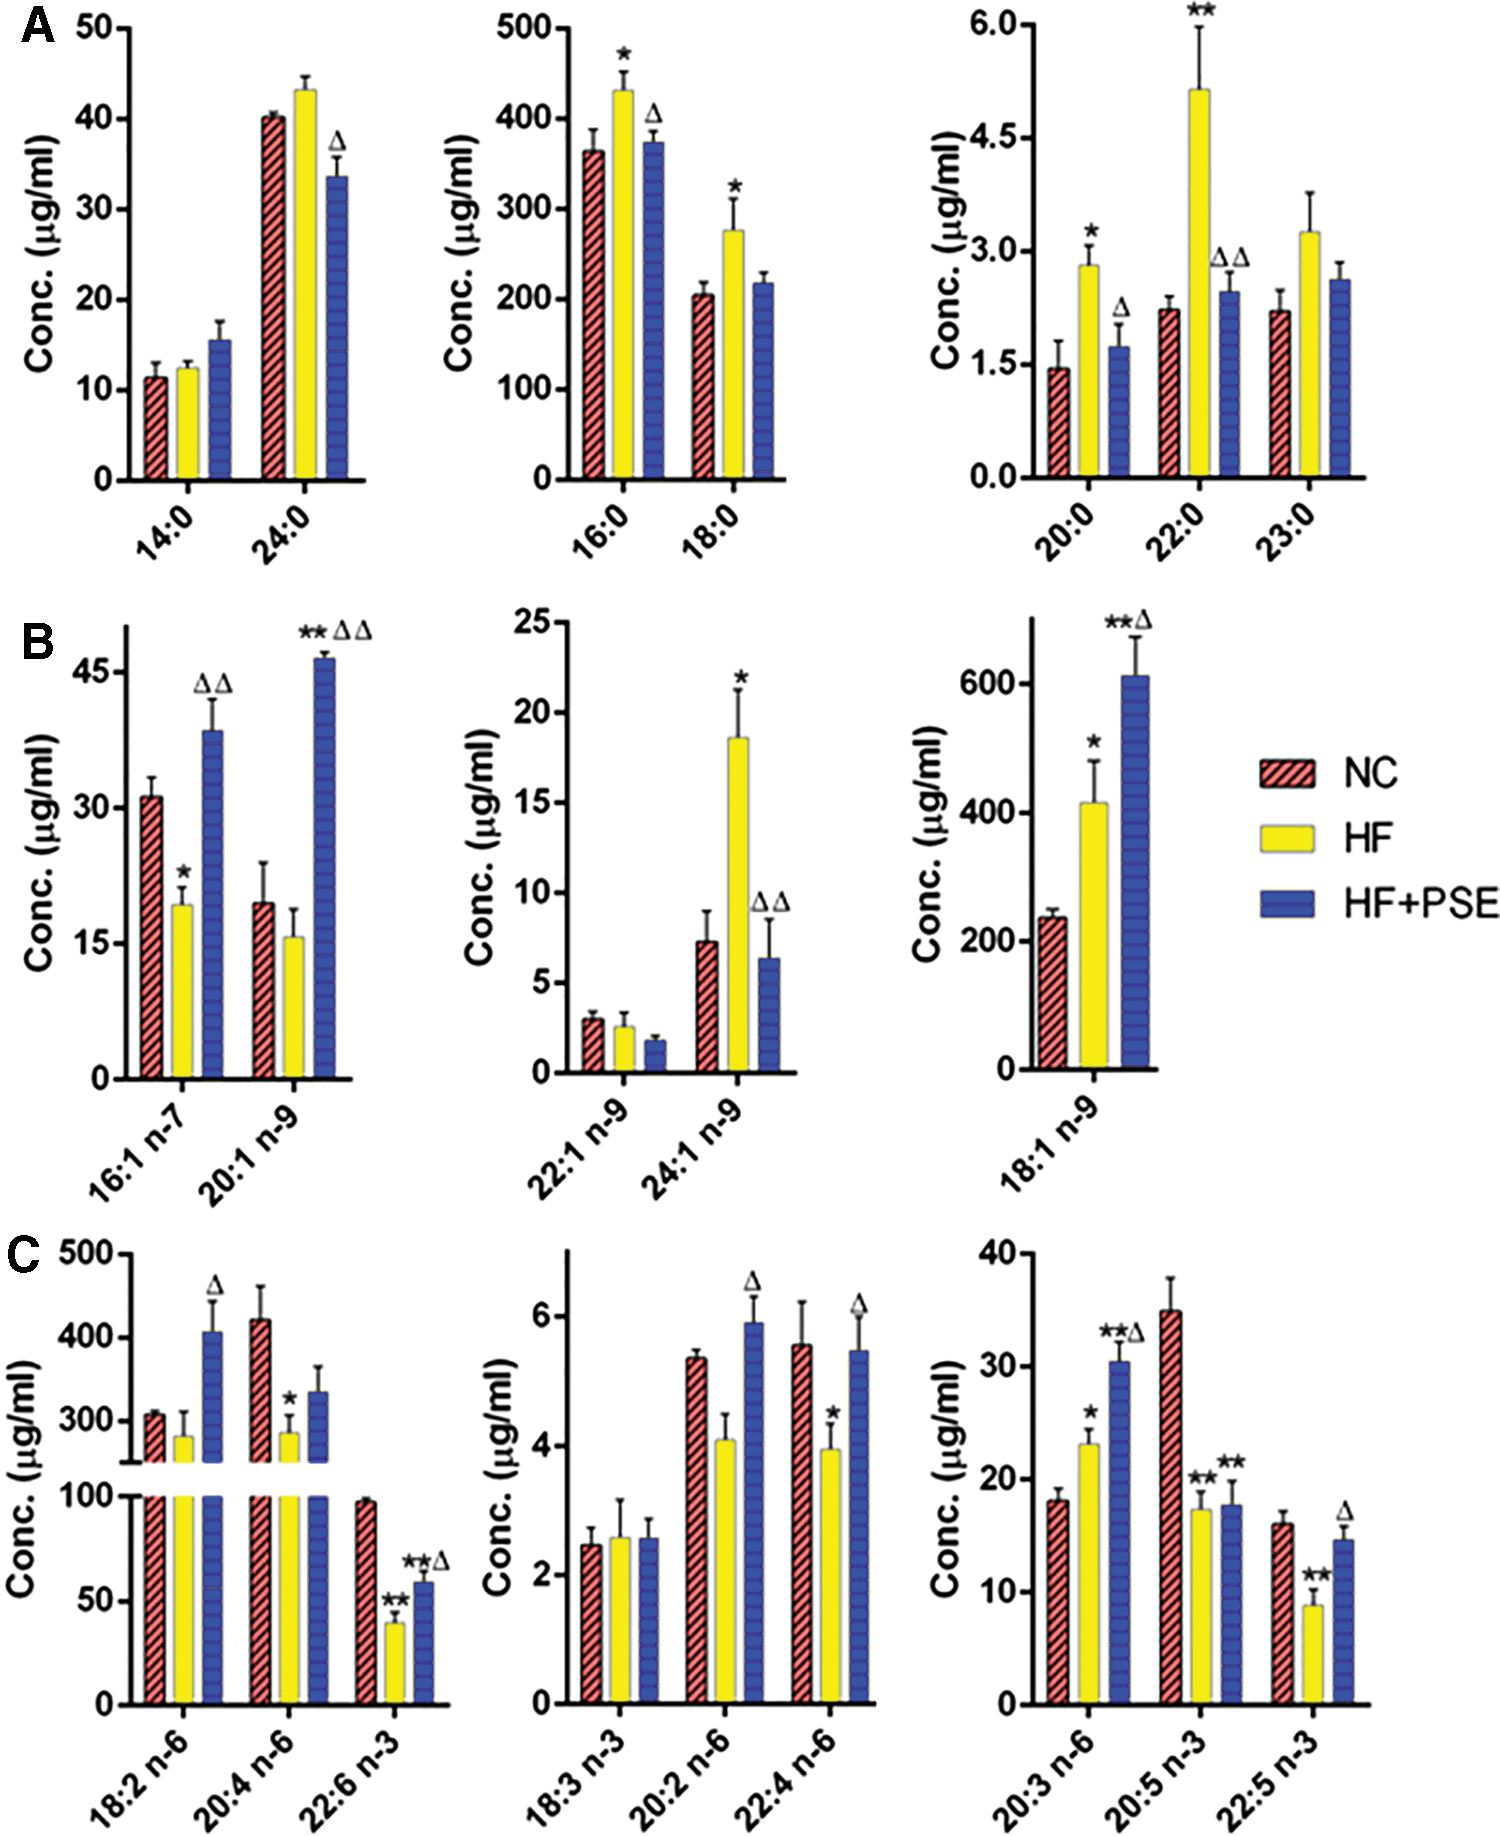
The serum FA profile in each group.
C16:1 n-7 and C20:1 n-9 levels were lower, but C18:1 n-9 and C24:1 n-9 levels were higher in the HF group. PSE intervention significantly elevated C16:1 n-7, C18:1 n-9, and C20:1 n-9 levels by 99.60%, 42.81%, and 195.30%, respectively, in comparison with those in the HF group, whereas the C24:1 level was significantly decreased by 142.85%, which was close to that of the NC group (Fig. 5B). In terms of PUFAs, C20:4 n-6, C20:5 n-3, C22:4 n-6, C22:5 n-3, and C22:6 n-3 levels were obviously lower in the HF group, whereas the C20:3 n-6 level was higher than that in the NC group. PSE intervention increased the levels of most of the PUFAs, including C18:2 n-6, C20:2 n-6, C20:3 n-6, C20:4 n-6, C22:4 n-6, C22:5 n-3, and C22:6 n-3, in comparison with those in the HF group (Fig. 5C). In particular, C20:2, C22:4, and C22:5 levels in the PSE intervention group were close to those in the NC group.
With respect to specific FAs in adipose tissue, the HF significantly decreased C12:0, C14:0, and C16:0 levels and increased C18:0 and C22:0 levels compared with those in the NC group. PSE intervention significantly increased C14:0 levels (P < .05), which were close to those of the NC group and consistent with the trend observed in the liver and serum (Fig. 6A). This implied that increased C14:0 may play an important role in PSE ameliorating NAFLD.

The adipose tissue FA profiles in each group.
HF treatment alone decreased the levels of all of the detected MUFAs, including C14:1 n-9, C16:1 n-7, C18:1 n-9, and C20:1 n-9, whereas those in the NC and PSE groups were higher than those in the HF group. In particular, C20:1 n-9 was significantly increased by 40.69% in the PSE treatment group, which was close to its level in the NC group (Fig. 6B). The variation trends for most of the PUFAs in each group were similar to those of the MUFAs. The levels of PUFAs in the NC and PSE groups were all higher than those in the HF group, except C22:6 n-3. Among those that increased, C18:2 n-6, C20:2 n-6, and C20:3 n-6 levels in the PSE treatment group were all significantly increased by 17.55%, 30.70%, and 111.98%, respectively (Fig. 6C).
Pearson correlation between FA levels and the degree of hepatic steatosis
We also analyzed the Pearson correlations between specific FA levels in the serum, liver, and adipose tissue and the degree of hepatic steatosis (quantified as total hepatic lipid content) (Table 3). The levels of SFAs in both the liver and serum, including C16:0, C18:0, C20:0, C22:0, C23:0, and hepatic C24:0, showed a significant positive correlation with the degree of hepatic steatosis.
Pearson Correlation Between Fatty Acids and Hepatic Steatosis Degree
Asterisks represent a statistical correlation between FAs and hepatic steatosis degree; * P < .05, ** P < .01.
FA, fatty acid; ND, not detected.
For MUFAs, the levels of C14:1 n-9, C16:1 n-7, C18:1 n-9, and C20:1 n-9 in adipose tissue and the level of C16:1 n-7 in serum showed a negative correlation with the hepatic steatosis degree. Interestingly, the C24:1 n-9 level in the liver negatively correlated with the hepatic steatosis degree; however, the serum C24:1 n-9 level showed the opposite trend. With regard to PUFAs, it is worth noting that C22:5 n-3 levels in liver, serum, and adipose tissue, C20:4 n-6 and C20:5 n-3 levels in serum, and C18:2 n-6, C18:3 n-3, C20:2 n-6, C20:3 n-6, C20:4 n-6, and C22:6 n-3 levels in the adipose tissue showed a negative correlation with hepatic steatosis degree.
PSE treatment partially regulated the mRNA levels of FA metabolism-related genes
Considering the change profile of FAs in both the PSE group and HF group, the expression levels of key FA metabolism-related genes, CPT1, FADS1, SCD1, and FADS2, in hepatic tissue were determined (as shown in Fig. 7). It was shown that the expression levels of CPT1 and FADS1 tended to increase with PSE intervention, in comparison with those of the HF group. In particular, the expression level of SCD1 was significantly increased (P < .05) and was close to that of the NC group.
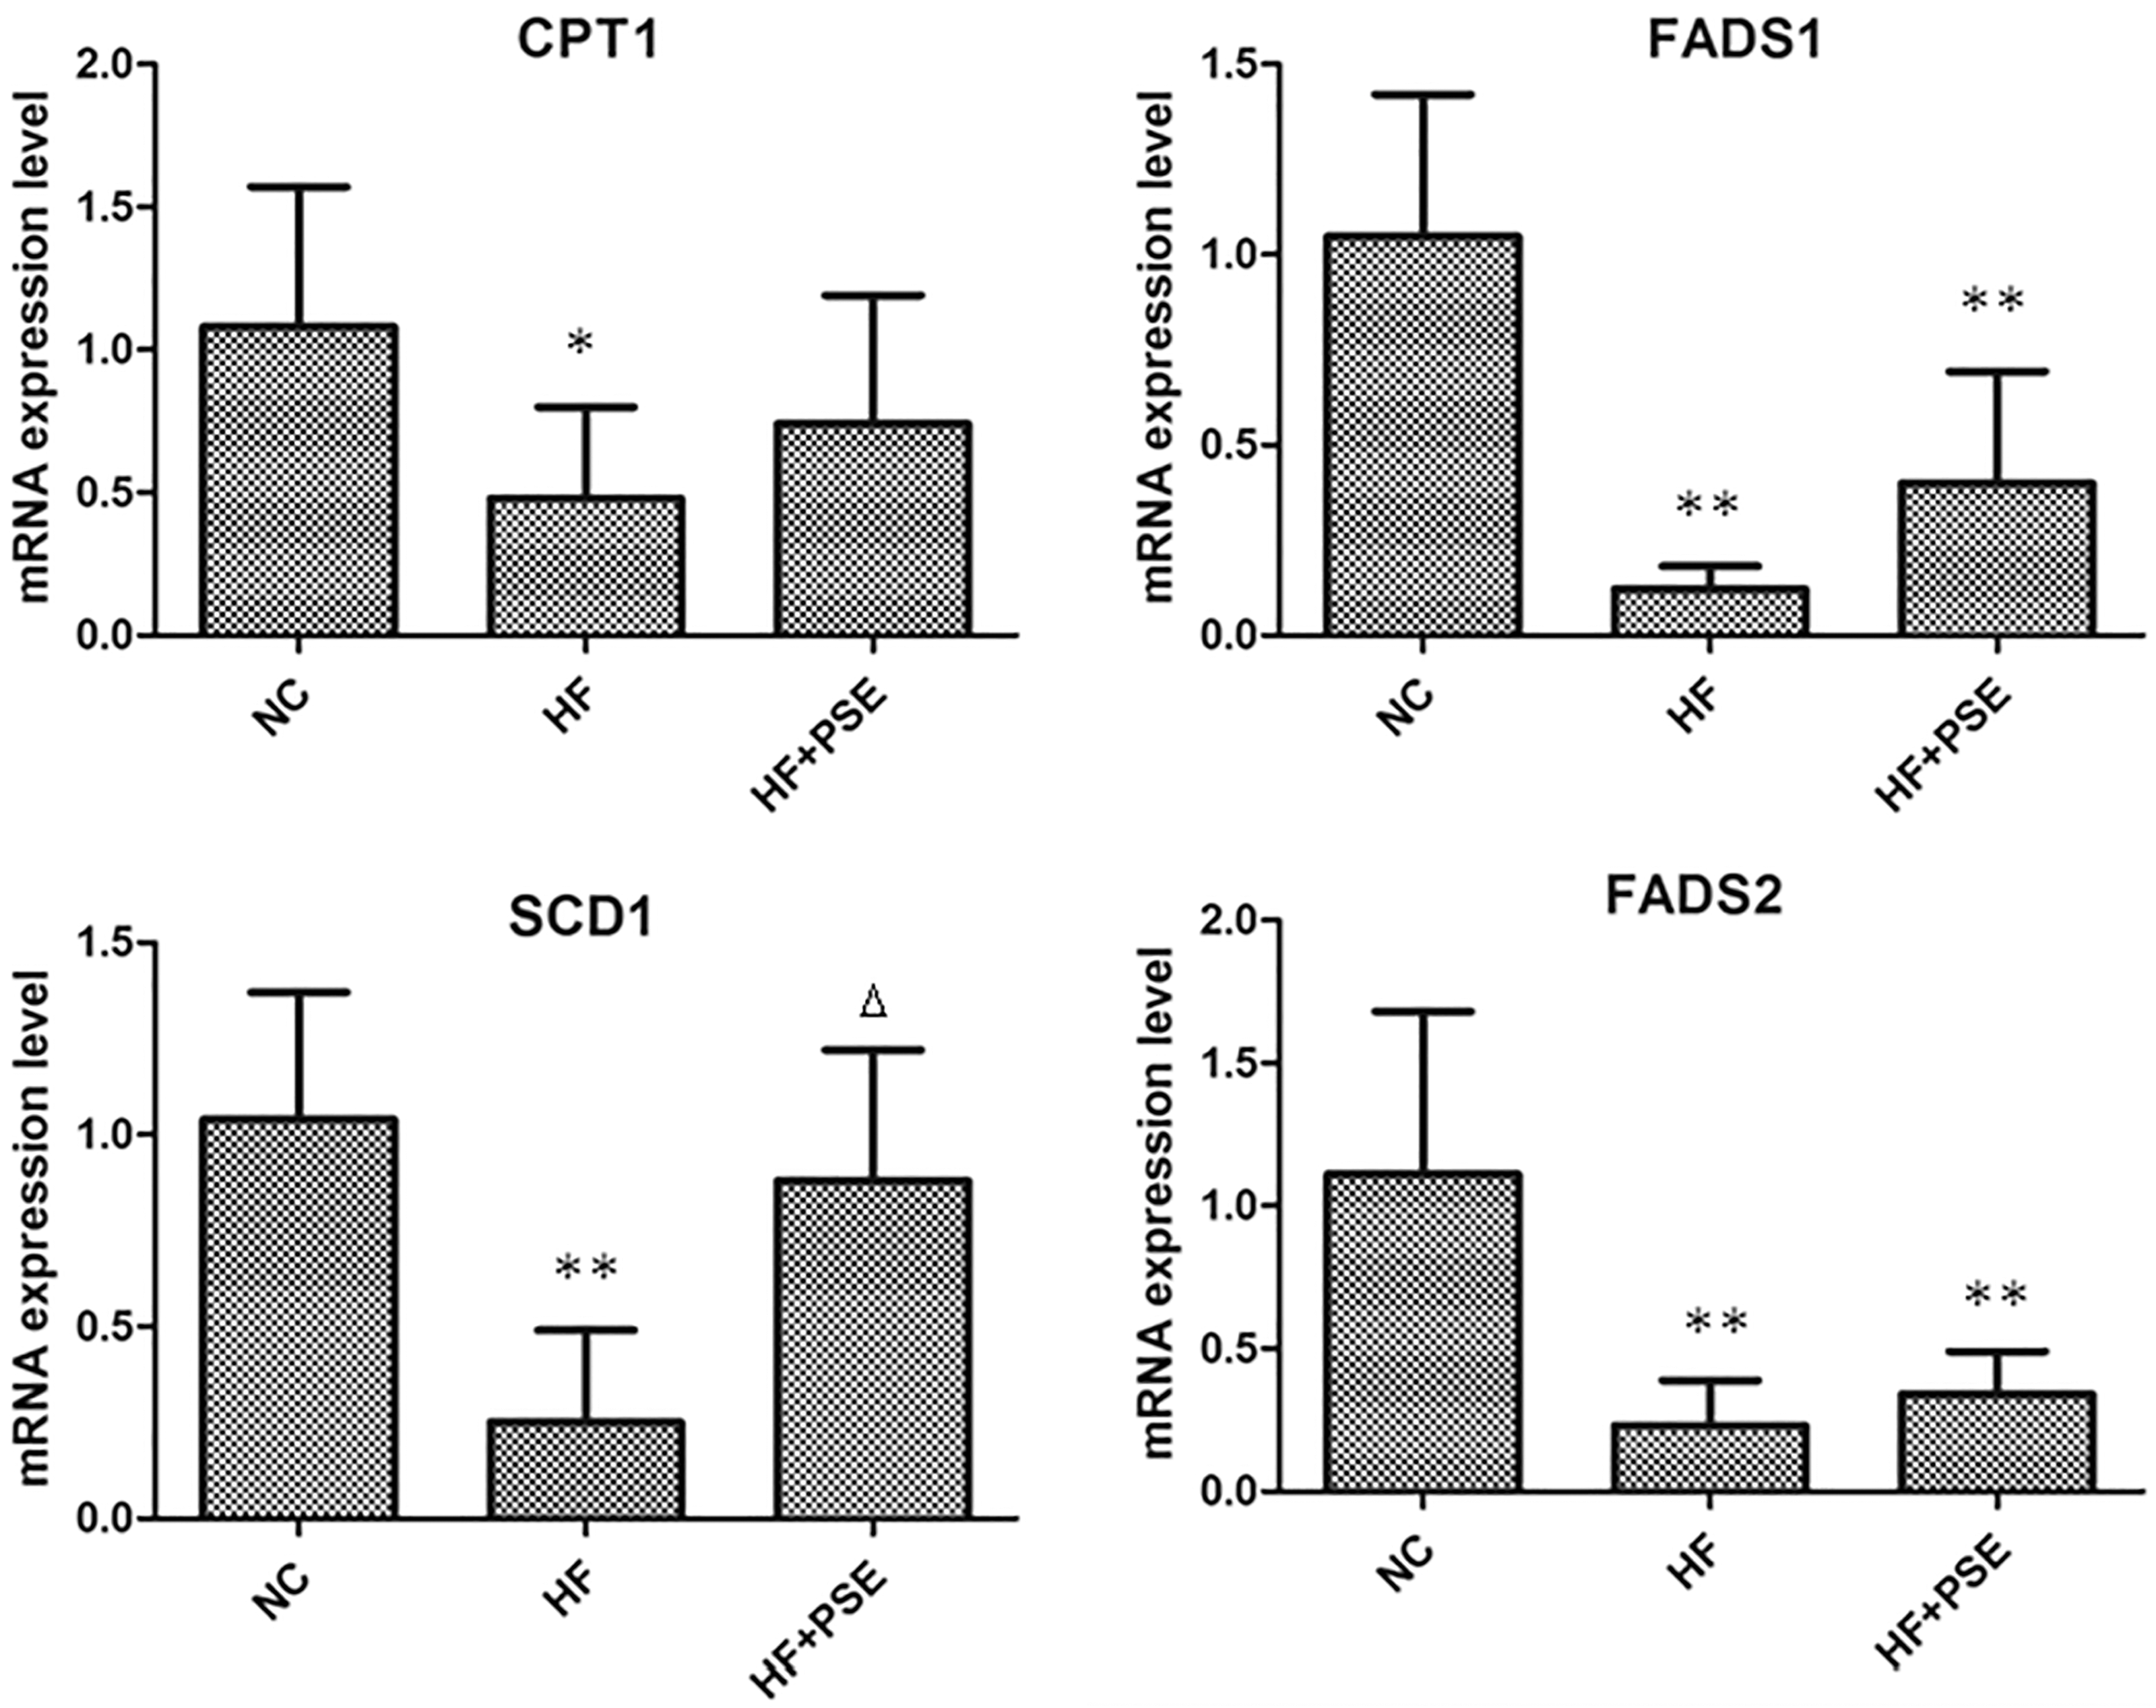
mRNA expression levels of FA metabolic genes in liver tissue. Data are presented as mean ± SD. *P < .05 versus NC, **P < .01 versus NC, Δ P < .05 versus HF.
Discussion
Exploration of the composition of FAs and their metabolism in the liver, adipose tissue, and serum in animals with NAFLD might provide interesting insights into NAFLD pathophysiology since FAs possess important biological functions in various tissues. 15 The dietary fat amount and category usually affect plasma FA composition, which has an important effect on insulin resistance in the muscle and liver, and inflammation 16 ; Mozaffarian et al. found that abnormal lipid metabolism in abdominal adipose tissue may bring about many metabolic problems. 17 Therefore, the rectification of FA disturbance in liver, serum, and adipose tissue may provide new clues for the treatment of NAFLD.
PSs are plant-derived compounds that have been known to possess remarkable cholesterol- and low-density lipoprotein cholesterol-lowering effect since the early 1950s. 18 In our study, we found that PSE treatment could alleviate hepatic steatosis, reduce the accumulation of abdominal fat, and improve liver function. Furthermore, we found that PSE treatment could significantly decrease the level of FFAs in hepatic tissue 13 and serum. A previous study showed that high concentrations of serum FFAs lead to insulin resistance, and in turn affect glucose and lipid metabolism. 19 Hence, these data suggested that PSs could effectively regulate the lipometabolic disturbance in addition to its well-established regulatory role in cholesterol metabolism.
Therefore, we further explored the FA profile in serum and hepatic and adipose tissues using GC-MS analysis in this study. Our PLS-DA analysis results showed that the FA profiles in liver, serum, and adipose tissue of the PSE intervention group were obviously different from those of the HF group. Collectively, PSE treatment decreased SFA concentrations and increased MUFA and PUFA concentrations in livers and sera in comparison with those of the HF alone group.
Previous studies showed that increases in SFAs play an important role in hepatic steatosis development 20 and insulin resistance. 19 Moreover, one study demonstrated that SFA accumulation in the liver damaged liver cells because of its toxic effects. 21 Excessive accumulation of SFAs in hepatocytes (e.g., C16:0 and C18:0) could cause liver cell injury by upregulating Bim and Fasl, as well as endoplasmic reticulum stress. 22 In this study, Pearson correlation analysis showed that C16:0, C18:0, C20:0, and C23:0 levels in the hepatic tissue and serum were positively correlated with the degree of hepatic steatosis. PSE intervention significantly inhibited the increase in liver and serum C16:0, C18:0, C20:0, C22:0, C23:0, and C24:0 levels. Therefore, the decrease in serum and liver SFAs by PSE intervention may partly explain its beneficial role in NAFLD prevention.
Aside from the disturbance in SFA metabolism, our study showed that the MUFAs were greatly reduced in the HF group, but PSE treatment resulted in higher levels of MUFAs in the liver, serum, and adipose tissue. The Pearson correlation analysis in this study demonstrated that the levels of C14:1 n-9, C18:1 n-9, and C20:1 n-9 in adipose tissue, C16:1 n-7 in serum, and C24:1 n-9 in liver were negatively correlated with hepatic steatosis. Importantly, C16:1 n-7 (palmitoleicacid, PA) was regarded as a lipid-controlling hormone used by adipose tissue to communicate with distant organs, which could stimulate muscle insulin activity and modulate hepatic fat metabolism. 23
In vivo and in vitro experiments found that C16:1 n-7 could facilitate glucose uptake and utilization in normal and insulin-resistant skeletal muscles, and then inhibit the development of hepatosteatosis. 23,24 Interestingly, plasma PA reflects the SCD1 activity in the liver. 25
SCD1 is a key enzyme in FA and energy metabolism. We found that PSE increased the expression level of hepatic SCD1 in this study. The elevation of MUFA (e.g., C16:1 n-7) and PUFA (e.g., C20:3 n-6) levels in our study probably resulted from the change in SCD1, which was consistent with a previous study. 26 Conversion of SFAs to MUFAs by SCD1 may be protective against NAFLD. 27 A previous study indicated that incubation of hepatocytes with saturated FAs decreased cell viability, while incubation with monounsaturated FAs has no influence. 28 This may partially explain the effect of PSE on the regulation of FA profiles and its role in NAFLD prevention.
In addition, several studies found that eicosapentaenoic acid (C20:5 n-3) and docosahexaenoic acid (C22:6 n-3) supplementation exhibit potential benefits for NAFLD prevention and treatment. 29 –32
This study showed that PSE intervention could increase the levels of most of PUFAs. The Pearson analysis in this study showed that C18:2 n-6, C18:3 n-3, C20:2 n-6, C20:3 n-6, C20:4 n-6, C22:5 n-3, and C22:6 n-3 in adipose tissue and C20:4 n-6, C20:5 n-3, C22:5 n-3, and C22:6 n-3 in serum were negatively correlated with hepatic steatosis. Notably, C22:5 n-3, the precursor of C22:6 n-3, was found to be negatively correlated with the degree of hepatic steatosis in the serum, liver, and adipose tissue, and it was found that the levels of C22:5 n-3 in liver tissue and serum were all increased in PSE treatment group. The specific physiological role of these PUFAs (e.g., C22:5) in preventing the progression of NAFLD is worthy of further investigation.
The LC-PUFAs are biosynthesized in liver and released into circulation, and then incorporated into tissues. 33 The FADS1, FADS2, and FADS3 genes were recognized as the rate-limiting steps in the conversion of 18C-PUFAs to LC-PUFAs. In this study, we found that the hepatic FADS1 mRNA level was upregulated in rats in the PSE intervention group. This may partially explain the increase in PUFA contents in the liver tissue and serum.
In conclusion, PSE intervention significantly decreased the total SFA levels and increased the levels of total MUFAs and PUFAs in the hepatic tissue and serum. This may partly be due to its upregulation of SCD1 and FADS1. Some FAs, especially C16:1 n-7 and C22:5 n-3, may represent key metabolites for preventing NAFLD. However, further study is needed to elucidate the mechanisms underlying the different SFA, MUFA, and PUFA profiles in serum and liver and adipose tissue, including the roles of specific types of FAs in the progression of NAFLD.
Footnotes
Authors' Contributions
L.S.: designed the experiment, analyzed data, and wrote the article. H.Z., X.D., L.Y., J.W., and C.S.: performed the experiments and analyzed data. W.Y.: analyzed the samples.
Author Disclosure Statement
No competing financial interests exist.
Funding Information
This study was supported by grants from the National Natural Science Foundation of China (grant nos. 81672350, 81872225).