
Abstract
Rhamnus alaternus (Rhamnaceae) has been used as a laxative, purgative, diuretic, antihypertensive, and depurative. However, few scientific research studies on its antimelanoma activity have been reported. This study aimed to investigate the in vitro antimelanoma effect of an enriched total oligomer flavonoid (TOF) extract, from R. alaternus, and to identify its phytochemical compounds. The chemical composition of TOF extract was assessed by HPLC-electrospray ionization tandem mass spectrometry (HPLC/ESI-MS2) analysis. Antimelanoma activity was determined on cultured tumor cell B16F10 by the crystal violet assay, the alkaline comet assay, acridine orange/ethidium bromide (AO/EB), annexin V-fluorescein isothiocyanate/ propidium iodide (V-FITC/PI) staining, the cell cycle distribution, and the wound healing assay. Regarding chemical composition, a mixture of quercetin diglucoside, quercetin-3-O-neohesperidoside, kaempferol-3-O-(2G-α-L-rhamnosyl)-rutinoside, rhamnetin hexoside, kaempferol-3-O-rutinoside, rhamnocitrin hexoside, pilosin hexoside, apigenin glucoside, and kaempferol-3-O-glucoside was identified as major phytochemical compounds of the extracts. TOF extract inhibits melanoma B16F10 cell proliferation in dose-dependent manner. The induction of apoptosis was confirmed by comet assay, AO/EB, and annexin V-FITC/PI test. TOF extract could also induce S phase cell cycle, inhibit, and delay the cell migration of B16F10 cells. The findings showed that TOF extract from R. alaternus could be a potentially good candidate for future use in alternative antimelanoma treatments.
INTRODUCTION
Melanoma is the main source of death among the different skin diseases. Furthermore, the incidence of melanoma has progressively increased in the past few periods. 1 However, high resistance, limited efficacy, and side effects of these therapeutic methods such as irradiation, chemotherapy, and surgical excision result in a poor survival rate. Therefore, the use of therapeutic agents from natural sources has gained importance as anticancer agents and has shown great potential as cytotoxic anticancer agents against melanoma. 2 –4
Targeting delayed/inhibited apoptosis is a major approach in cancer treatment and a highly active area of research. Therefore, a popular strategy in alternative cancer treatment is the utilization of natural agents that trigger the apoptosis of cancer cells by modulating apoptotic pathways. 5 Moreover, flavonoids such as flavones have a high safety profile, with minimal side effects and cost effectiveness, and, most importantly, exhibit a range of activities such as apoptosis induction 5 –7 ; cell cycle arrest at the G1 or G2/M phase 6,7 ; inhibition of vascular endothelial growth factor and basic fibroblast growth factor-mediated angiogenesis 8,9 ; inhibition of enzymes involved in metabolism (cytochromes P450 [CYPs]) 7,10 ; and inhibition of reactive oxygen species formation by activating phase II metabolizing enzymes. 7,11
Rhamnus species are known to be rich sources of anthraquinones and to produce flavonoid glycosides. 12 –18 Rhamnus is nowadays well known as effective pharmacological remedies in many parts of the world. 13
Our previous reports have indicated that different extracts as well as isolated flavone glycosides from Rhamnus alaternus have shown potent antioxidant, free radical scavenging, antibacterial, antiproliferative, antimutagenic, and antigenotoxic activities. 19 –22 However, there is no information about the antitumor effect of the plant R. alaternus on melanoma. In continuation, this article explores the chemical profile of R. alaternus extract, as well as the in vitro antimelanoma activity, demonstrating that the flavone glycosides found in leaves play an important role in inhibiting cancer cell proliferation.
MATERIALS AND METHODS
Plant material
Aerial part of R. alaternus was collected from Ain Sobh, situated in the North West of Tunisia, in November 2017. Identification was carried out by Pr. Skhiri Fathia (Higher Institute of biotechnology of Monastir, Tunisia), according to the flora of Tunisia. 23 Avoucher specimen (Ra-12-017) has been kept in the Laboratory of Pharmacognosy, Faculty of Pharmacy of Monastir, Tunisia, for future reference.
Extraction method
The extraction method of an enriched total oligomer flavonoid (TOF) extract was performed as previously described by Ghedira et al. 24
HPLC-electrospray ionization tandem mass spectrometry analysis
LC-MS/MS analysis was performed on a ThermoFinnigan LCQ Advantage ion trap mass spectrometer with an ESI source coupled to a Thermo Scientific Accela HPLC system (MS pump plus, autosampler, and photo diode array detector plus) with a EC 150/2 Nucleodur 100-3 C18ec column (Macherey-Nagel). A gradient of water and acetonitrile (ACN) (without formic acid for ESI mode) was applied from 5% to 30% ACN in 60 min and from 30% to 90% CAN in another 60 min at 30°C. The flow rate was 0.3 mL/min. The injection volume was about 25 μL. All samples were measured in the negative mode. The MS was operated with a capillary voltage of 10 V, source temperature of 240°C, and high purity nitrogen as a sheath and auxiliary gas at a flow rate of 70 and 10 (arbitrary units), respectively. The ions were distinguished in a mass range of 50–2000 m/z. Collision energy of 35% was used in MS/MS for fragmentation. Data acquisitions were executed by XcaliburTM 2.0.7 software (Thermo Scientific).
B16F10 murine melanoma cells
The B16-F10 melanoma line was maintained in a humidified incubator with 5% CO2 at 37°C. Cells were cultured in RPMI1640 medium supplemented with 10% (v/v) fetal calf serum (Biowhitaker, Lonza, Belgium), 2 mM glutamine, 100 U penicillin, and 100 μg/mL streptomycin.
Crystal violet assay
About 4 × 10³ B16F10 cells were placed into each of the 96-well plate for 24 h. TOF extract was dissolved in dimethyl sulfoxide (DMSO) and then it was individually added to the wells at final concentrations of 0, 12,5, 25, 50, 100, 200, and 400 mg/mL. Wells with 0.1% of DMSO solution in culture medium were used as control groups. After incubation for 48 h at 37°C, 5% CO2, the cells were fixed for 10 min with 10% formaldehyde (Synth). Then, 100 μL/well of crystal violet (CV) solution (0.2 mg/mL) was added on the cells. After 15 min of incubation, the supernatant was discarded and the wells were washed with distilled water to remove all CV dye. Afterwards, 100 μL/well of 100% ethanol was added and the absorbance was analyzed in a spectrophotometer (λ = 570 nm).
Single-cell gel electrophoresis (the comet assay)
The alkaline comet assay is a well-known single-cell gel electrophoresis (SCGE) protocol for evaluating DNA damage. Comet assay was performed according to Singh and Tice with minor modifications. 25,26
Cells (5 × 10⁵) were seeded in cell culture flasks (25 cm2) and allowed to adhere for 24 h. Then the cells are treated with TOF extract (10, 20, and 30 μg/mL). A positive control consists of cells treated with 50 μM H2O2 for 5 min on ice. Negative control corresponds to vehicle-treated cells. The total score of DNA damage (TDD) was determined by the following equation 27 :
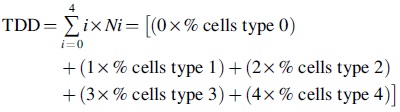
Ni is the percent of scored cells in i level and i is the level of DNA damage (from undamaged, 0 to maximally damaged, 4).
Acridine orange/ethidium bromide staining
Approximately 5 × 10⁵ cells were seeded in a 6-well plate and treated with different concentrations of TOF extract for 48 h. Following extract treatment, the cells were collected and washed with phosphate-buffered saline (PBS) followed by staining with 1:1 mixture of acridine orange/ethidium bromide (AO/EB) (100 μg/mL stock). Nuclear morphology was evaluated by fluorescence microscopy (Zeiss, Oberkochen, Germany). Live cells display a normal green nucleus, early apoptotic cells display a bright green nucleus with condensed or fragmented chromatin, and late apoptotic cells display condensed and fragmented orange chromatin. All experiments were performed Thrice. 28
Measurement of the exposure of phosphatidyl serine by annexin V-fluorescein isothiocyanate/propidium iodide staining
B16F10 cells were seeded in 6-well plates at a density of 5 × 10⁵ cells/well and were incubated with different concentrations of TOF extract (10, 20, and 40 μg/mL) for 48 h. For the staining, the cells were washed with PBS and adjusted to a concentration of 1 × 10⁶ cell/mL in 1 × binding buffer. To 200 μL of cell suspension, 5 μL of Annexin V-fluorescein isothiocyanate propidium iodide (PI) (20 μg/mL) were added and incubated for 15 min at room temperature in the dark. The cells were analyzed using a flow cytometer [fluorescence activated cell sorting (FACS) system; Beckman Coulter, Switzerland]. For each analysis, 10,000 counts, gated separately according to their granularity and size on forward scatter versus side scatter plots. The density plots illustrate four cell populations (live, early apoptotic, necrotic, and late apoptotic and dead) according to their fluorescence characteristics. Live cells are both phosphatidyl serine (PS) and PI negative, early apoptotic cells are PS positive and PI negative, late apoptotic and dead cells are both PS and PI positive, and necrotic cells are PS negative and PI positive.
Analysis of the cell cycle distribution
Cell cycle was evaluated by flow cytometry as follows: 48 h after cell incubation with TOF extract (10, 20, and 40 μg/mL), cells were trypsinized and fixed overnight in 70% ethanol. Fixed cells were then collected by centrifugation, washed with PBS, and stained with PI solution (50 μg/mL PI and 200 μg/mL RNAse A) for 30 min. The solution was homogenized and transferred to flow cytometry tubes. After incubation for 30 min at room temperature in the dark, the cell cycle was analyzed with a FACS system (Beckman Coulter). The percentages of cells in the cell cycle phases G0/G1, S, G2/M, and sub G1 were calculated.
Wound healing assay
The wound healing migration assay was performed as previously described by Ding et al. 29 The B16-F10 cells were seeded in a 6-well plate and incubated for 16 h to reach 100% confluence. Wounding was performed by scraping through the cell monolayer with a 10-μL pipette tip. Wells were washed twice to remove cell debris and were then incubated with different concentrations of TOF extract (5 and 10 μg/mL) for 16 h. The wound was photographed at 0 and 16 h by microscopy (Olympus inverted microscope). The migration was quantified by determining the surface of recovery using ImageJ.
Statistical analysis
The data were evaluated with GraphPad Prism® Version 6.01 software. A comparison was conducted using the one-way analysis of variance (ANOVA), followed by Tukey's or Dunnett's tests. P values of <.05 were considered statistically significant.
RESULTS
HPLC/ESI-MS 2 profiling of flavonoid compounds in R. alaternus
The analysis revealed a total of nine flavonoids, Figure 1 presents the base peaks of the LC-MS in the ESI (−) mode: the negative ionization and the Table 1 shows the identified peaks.

Profile of the TOF extract from Rhamnus alaternus [LC-MS-ESI (−)]. LC-MS-ESI, liquid chromatography-electrospray ionization-mass spectrometry; TOF, total oligomer flavonoids.
Flavonoids in Total Oligomer Flavonoid Extract of Rhamnus alaternus Leaves
MS/MS, tandem mass spectrometry; RT, retention time.
The flavonoids were found to be the dominant class of compounds in this extract (Table 1). Two peaks showed a molecular ion peak [M−H]− at m/z 609 and a daughter ion peak at m/z 231, 257, 264, 300, and 357, and 300, 271, 255, 178 were assigned to quercetin diglucoside and quercetin-3-O-neohesperidoside, as reported. 30,31
Rhamnetin hexoside was detected with [M−H]− at m/z 769 and fragments at m/z 315, and another peak with the [M−H]− at m/z 753 and daughter ions at m/z 299 was assigned to rhamnocitrin hexoside. 32 A precursor with [M−H]− at m/z 783 and fragments at m/z 329 confirmed the presence of pilosin hexoside. Daughter ions at m/z 269 431 were assigned to apigenin glucoside, a molecular ion peak [M−H]− at m/z. Several peaks were also detected with [M−H]− at m/z 739, 593, and 447 and were assigned to kaempferol-3-O-(2G-α-L-rhamnosyl)-rutinoside, kaempferol-3-O-rutinoside, and kaempferol-3-O-glucoside.
TOF extract showed reduction in viability of B16F10 cells
A considerable reduction in the cell viability was observed in a dose-dependent manner when compared with the control-treated cells (Fig. 2). The calculated IC50 value was 20 μg/mL.

Cytotoxic effects of TOF extract on B16F10 cells. Cells were treated with concentrations of TOF extract for 48 h. Cytotoxic effects were determined by CV assay. The values are represented as the percentage of cell viability, where vehicle-treated cells were regarded as 100%. Data represent the mean ± SE of three experiments, each conducted in triplicate. *P < .05, significantly different compared with control according to Dunnett's test. CV, crystal violet; SE, standard error.
TOF extract enhances DNA damage
As shown in Figure 3B, TOF extract was found to increase DNA damage in a concentration-dependent manner by measuring TDD.
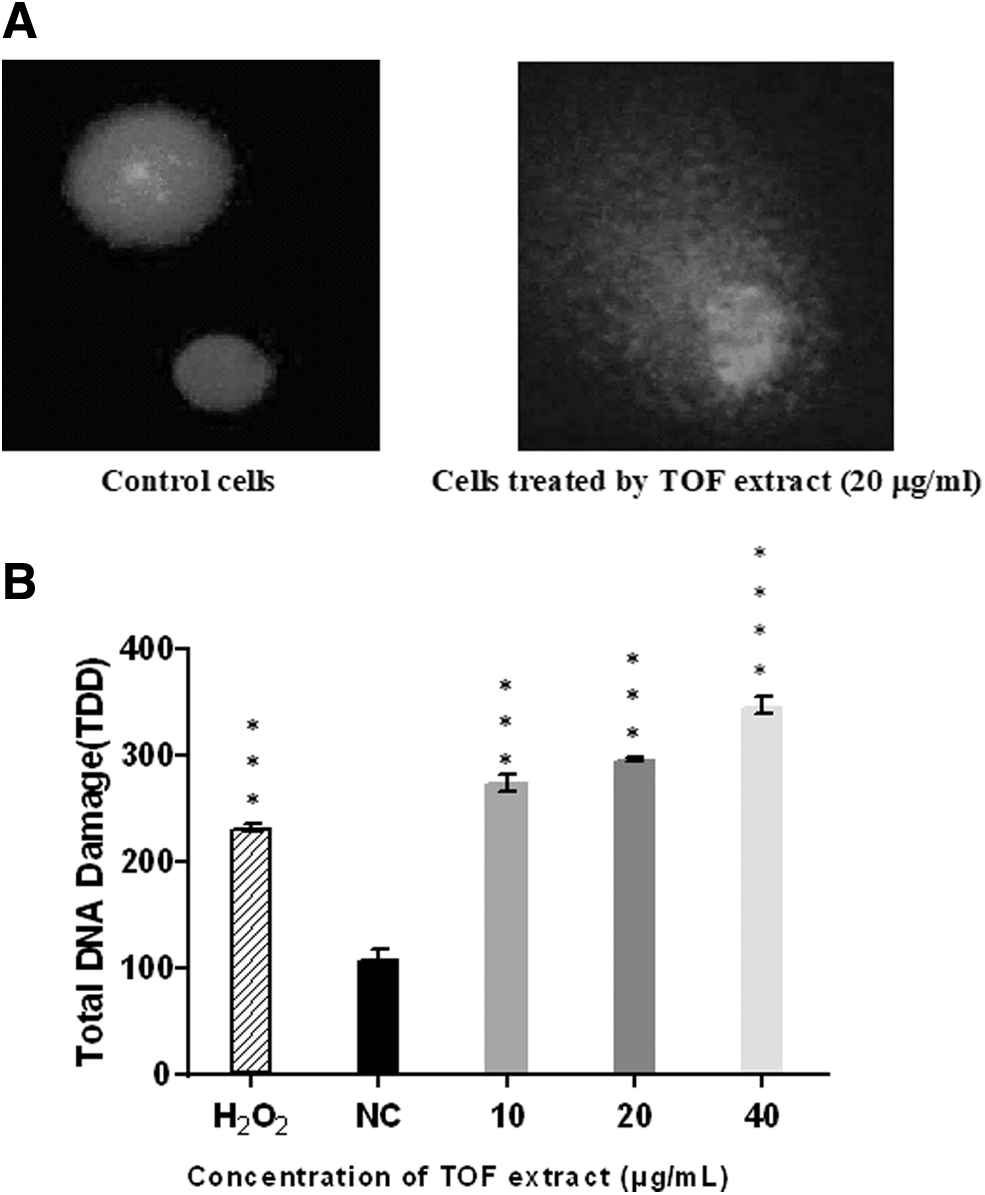
Genotoxic effect of TOF extract toward B16F10 cells
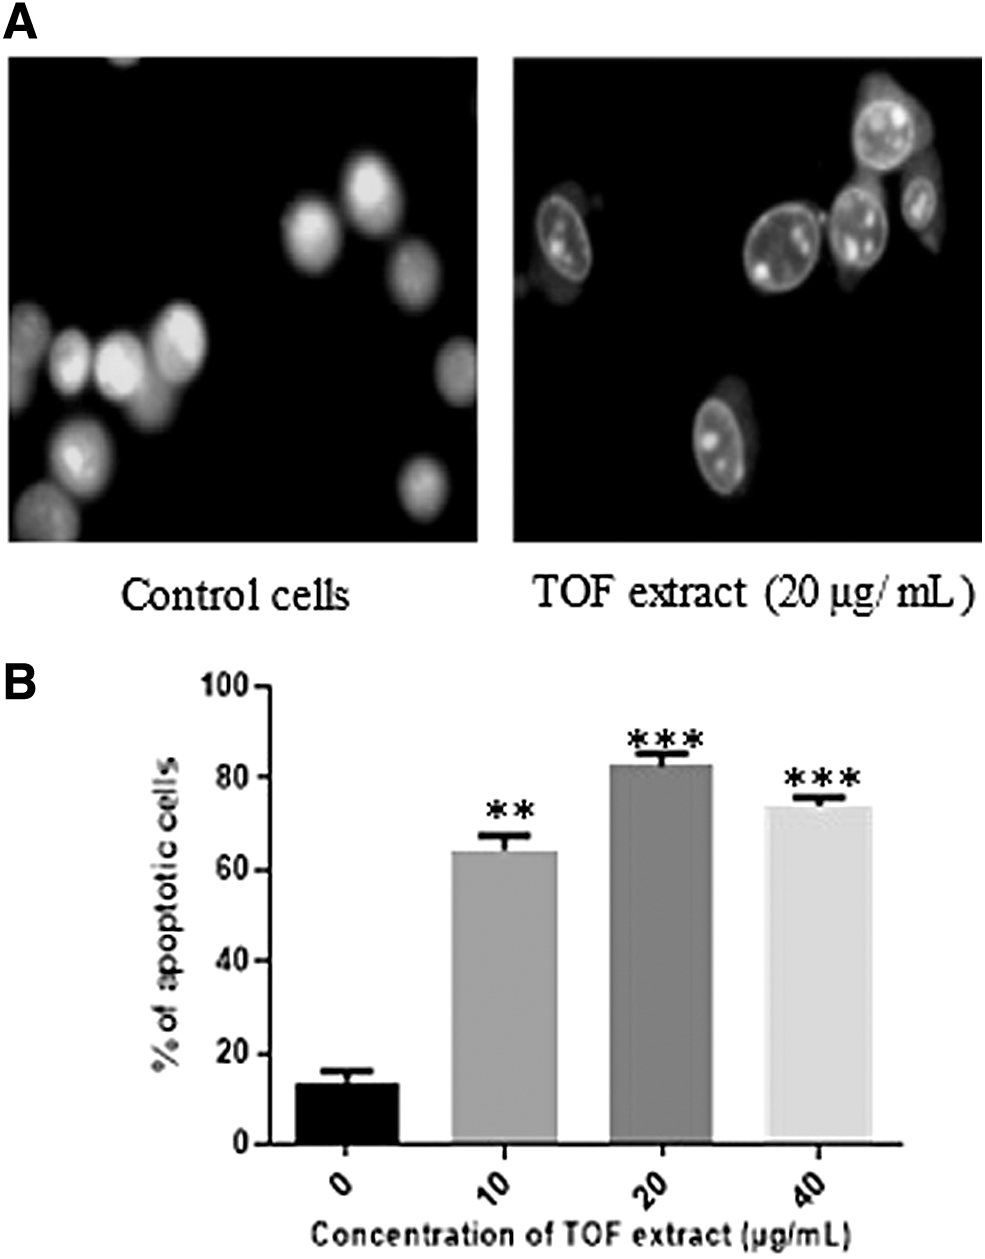
TOF extract induces apoptosis in B16-F10 cells
Using acridine orange staining under immunofluorescence microscope, significant nuclear condensation and morphological changes for B16F10 cells were observed, while in the control group, the cells without TOF extract treatment revealed normal nuclear morphology. The apoptosis percentage reached 82.6% in the presence of 20 μg/mL of TOF extract (Fig. 4).
Moreover, the apoptotic effect of TOF extract was confirmed using Annexin V/PI double staining and flow cytometry analysis. The results indicated that TOF extract significantly induced B16F10 cell apoptosis in a concentration-dependent manner (Fig. 5A). The late apoptosis rate was 2.6% versus 66.6% (control vs. 20 μg/mL) (Fig. 5B).
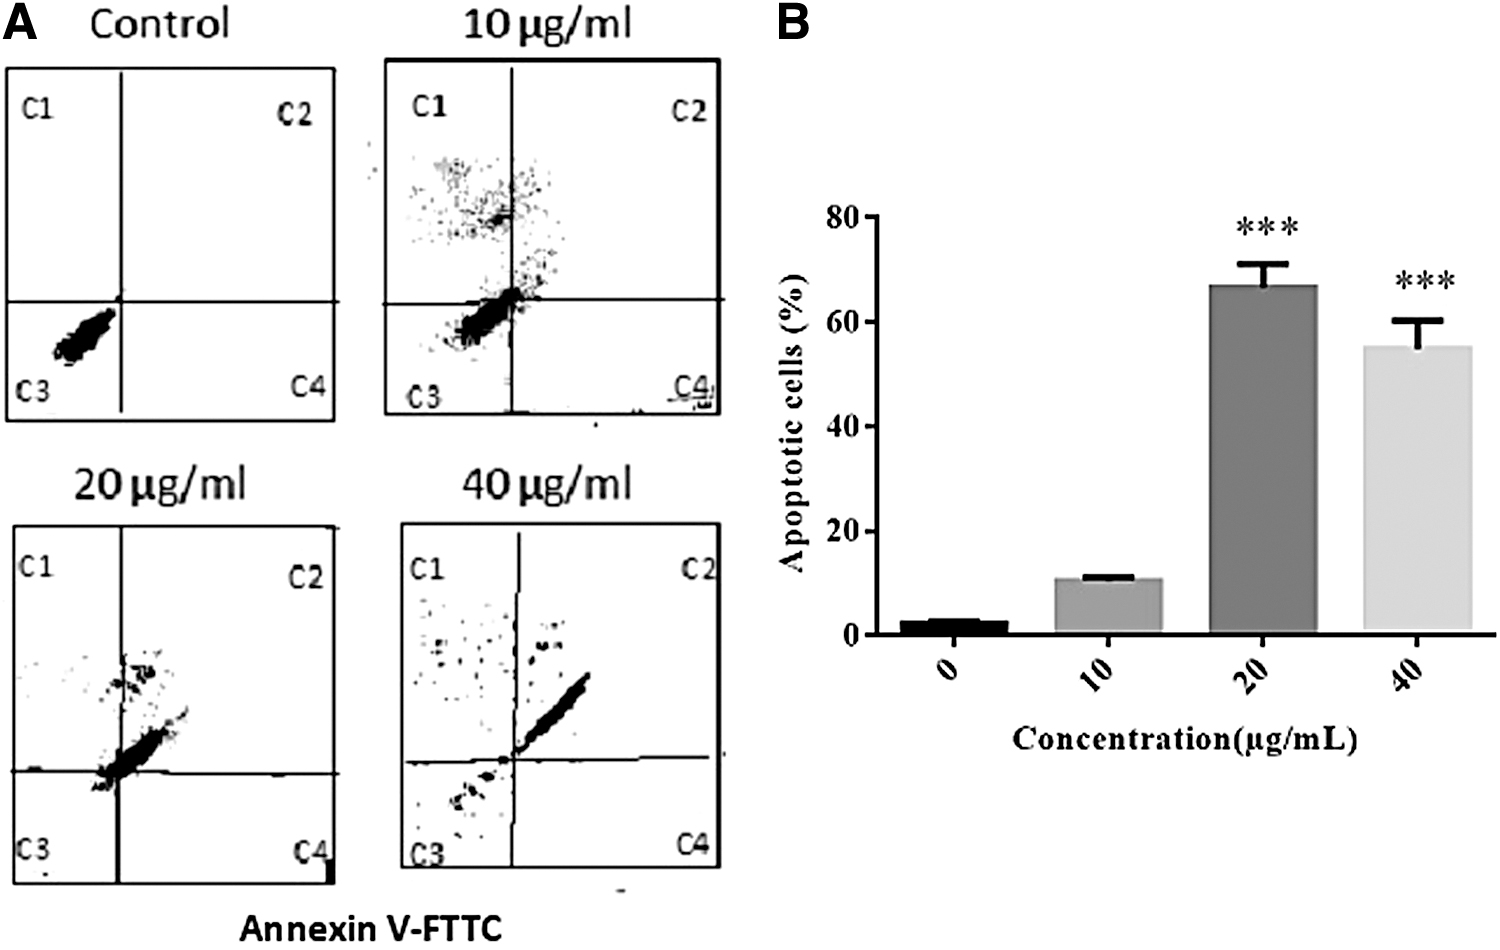
Effect of TOF extract on cell apoptosis of B16F10 cells.
TOF extract treatment induces cell-cycle arrest
The treatment of B16F10 cells with different TOF extract concentrations for 48 h resulted in a significant increase of sub-G1 and S phase cells built-up (Fig. 6), as well as a significant decrease of cell number in the G0/G1 phase.
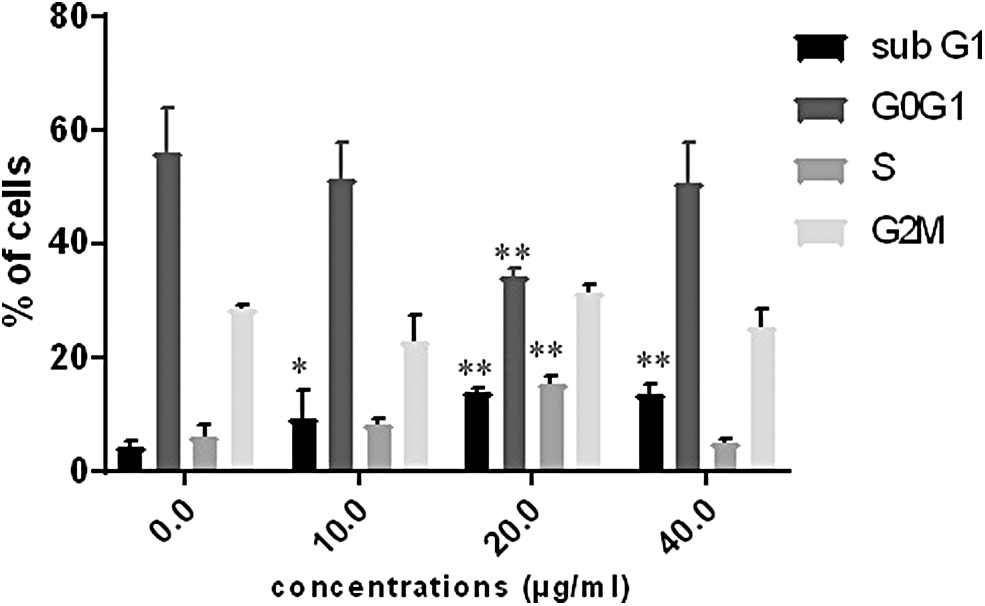
Effect of TOF extract on cell cycle distribution in B16F10 cells. Cells were treated with different concentrations of TOF extract (0, 10, 20, and 40 μg/mL) for 48 h and analyzed by FACS. Each point is the mean ± SEM of three experiments. *P < .05 and **P < .01 significantly different compared with control cells according to Dunnett's test. FACS, fluorescence activated cell sorting.
TOF extract reduced melanoma B16-F10 cell migration
As shown in Figure 7, control cells entirely covered the wounded area after 16 h of incubation at 37°C. On the contrary, treatment with TOF extract fraction strongly reduced wound repair (Fig. 7A). At the concentration of 10 μg/mL, the cell migration was 37% (Fig. 7B).

TOF extract inhibited migration of B16-F10 melanoma cells. B16-F10 cells were incubated with TOF extract (5 and 10 μg/mL) for 16 h.
DISCUSSION
Several studies have reported cytotoxic activity, antilipid peroxidation, and induction of apoptosis in the erythroleukemic cell line K562 of R. alaternus TOF extract. However, their effects on skin cancers such as melanoma have not been previously investigated, and the mechanism by which it suppresses carcinogenesis remains unclear. An understanding of the underlying mechanism of induction of apoptosis by R. alaternus TOF extract will benefit the development of chemopreventives and chemotherapeutics for treating melanoma. In this study, we used CV assay, and confirmed that TOF extract inhibits melanoma B16F10 cell proliferation in dose-dependent manner. In a previous study, an antiproliferation effect was observed in K562 and L1210 cancer cells treated with R. alaternus extract. 22 Induction of apoptosis is one of the most effective approaches in cancer therapeutics. Comet assay showed distinct feature between apoptotic and necrotic cells also. 33 DNA profiles shown in Figure 3A provide strong evidence that the DNA damage observed in B16F10 cells treated by TOF extract is caused by apoptosis. After following the comet assay procedure, the majority of the DNA content migrated toward the tail apoptosis. 34,35
To confirm whether the extract-induced cell death observed in our study involved apoptosis, staining cells with fluorescent dyes, including acridine orange and ethidium bromide, is used in evaluating the nuclear morphology of dead cells. The percentage of apoptotic cells after treatment increased significantly compared to control in B16F10 cells. Moreover, to confirm these visual changes, the flow cytometry study was performed using Annexin V/PI staining. A significant increase in apoptotic cells was detected after 48 h of treatment with R. alaternus extract. Ultimately, the apoptotic cells progressed into late apoptosis and necrotic/secondary necrotic cells in the absence of phagocytes to ingest the apoptotic bodies in this study. 36
Cell growth inhibition could be mediated by the arrest in cell cycle progression. 37 The cell cycle comprises a series of complex molecular and biochemical signaling pathways. Dysregulation of cell cycle perhaps linked with the cancerous transformation of the cell and often serves as a therapeutic target in cancer biology. 38 B16F10 cells after exposure to TOF extract had marked accumulation in the S and sub-G1 phases of the cell cycle when compared with the untreated control cells. The S phase of the cell division cycle is the period in which cells duplicate their DNA. If DNA replication is blocked by inhibitors or if the template is damaged by some factors, signals that can induce cell cycle arrest or apoptosis are generated. 39 Therefore, we suggest that the growth inhibitory effect of TOF extract in B16F10 cells was the result of a block during this S phase beyond its ability to induce apoptosis.
On the other hand, migration is an initial step in tumor metastasis. Wound and healing assay is a classic and common method used for discovery and validation of molecules that affect cell migration and metastasis. 40 –42 The TOF extract inhibited and delayed the cell migration of B16F10 cells. These results open the door to further studies that could confirm if the cytotoxic activity of R. alaternus leaf extract alters the regulation of the actin cytoskeleton, induces morphological changes, and leads to detachment of cells, culminating in cell death.
Our chemical study indicated the presence of various kinds of flavonoids, in particular, flavones; we believe that they are responsible, at least in part, for the antimelanoma effect of TOF extract.
Flavones' anticancer activity promotes apoptosis of cancer cells at doses that are cell-type specific. The anticarcinogenic effect of flavones is given, in part, by their ability to induce DNA damage, and is accompanied by cell cycle arrest at G1 or G2, depending on the particular cell type. Supplementary experiments will be required to further understand the specific contributions of the molecular systems responsible for the antimelanoma effect of flavones from R. alaternus.
Footnotes
AUTHORS' CONTRIBUTIONS
I.B.C.: was responsible for the conception and design, analysis, and data interpretation, and drafted the article. I.B.T.: made substantial contribution to HPLC/ESI-MS 2 profiling. M.M. and Y.K.: made substantial contribution to cellular study. M.K. and L.C.G.: have contributed to conception and revised it critically for important intellectual content.
AUTHOR DISCLOSURE STATEMENT
No competing financial interests exist.
FUNDING INFORMATION
The authors acknowledge the Tunisian Ministry of Higher Education and Scientific Research for the financial support of this study.