




Abstract
To identify possible mechanisms involved in the development and progression of nonalcoholic fatty liver disease (NAFLD), we conducted shotgun proteomics analysis on liver of obese Zucker rats fed either casein (CAS) or soy protein isolate (SPI) for 8 and 16 weeks. Rats (7 weeks old, n = 8–9/group) were randomly assigned to either a CAS-based or an SPI-based diet. Rats were killed after 8 or 16 weeks of feeding and livers were stored at −80°C. Ingenuity Pathway Analysis (IPA) software was used to facilitate interpretation of proteomics data. Predictions of activation or inhibition of molecules in the data were made based on activation z-score and P value of overlap (P < .05). Activation z-scores ≥2.0 indicate that a molecule is predicted to be activated, whereas activation z-scores of less than or equal to −2.0 indicate that a target molecule is predicted to be inhibited. Upstream regulator analysis with IPA revealed Neuregulin 1 (NRG1) to be the top activated protein in (z-score = 2.48, P < .05), and MKNK1 as the top inhibited protein (z-score = −2.83, P < .05) in SPI diet compared with CAS diet after both 8 and 16 weeks of SPI feeding. Regulator effects analysis also predicted that some proteins would be participating, directly or indirectly, in the inhibition of immune response functions (such as leukocyte migration) and lipid metabolism (such as synthesis of lipids) in SPI-fed rats relative to CAS-fed rats. Our results suggest that SPI diet modifies the expression of proteins that could be involved in the reduction of NAFLD.
Introduction
Nonalcoholic fatty liver disease (NAFLD) is a liver a major health problem that is on the rise worldwide. 1 In NAFLD there is an excess of lipid deposition in the hepatocytes termed liver steatosis, 2 –4 NAFLD can account for at least 5% of the liver's weight that cannot be explained by alcohol consumption. 5 NAFLD can be defined as a disease with a spectrum of symptoms, ranging from fat accumulation to subsequent inflammation of the liver tissue and fibrosis, known as nonalcoholic steatohepatitis, 1,5 NAFLD ultimately can lead to cirrhosis; 20% of these cases progress toward hepatocarcinoma (hepatocellular carcinoma [HCC]). 6 –9 NAFLD is characterized by a dysregulation in lipid metabolism that leads to lipotoxicity and inflammation of the liver tissue 10 as a result of genetic and/or environmental factors. 5,11
At present, there are no pharmacological direct treatments for NAFLD, and dietary interventions and exercise are the usual therapies, which can be hard to follow for many patients. 12 –14 As a result, there has been an increasing interest on dietary components that could prevent and help with the early stages of NAFLD. 15 –17 It has been shown that various dietary compounds can mitigate and in some cases reverse the early symptoms of liver steatosis. 18 –20 We have reported that feeding diets containing soy protein isolate (SPI) as main protein source can reduce NAFLD in obese Zucker rats compared with diets containing casein (CAS) as control. 21 Zucker rats have a mutation on their leptin receptor, and homozygotes for this mutation become obese by their third week of age, obese Zucker rats presenting many common metabolic syndrome symptoms, such as insulin resistance and liver steatosis, which makes Zucker rats a good model to study NAFLD. 22,23 Previously, global gene expression (transcriptomics) analysis of liver has shed some light into potential mechanisms. SPI-based diet attenuated liver steatosis based on the most differentially expressed genes (up- and downregulated) between SPI- and CAS-based diets, upstream regulators, and diseases and functions after 8 and 16 weeks of SPI feeding. 24 –26 This is a new study carried out in silico on proteomics data obtained from the same set of rats previously reported in Hakkak et al. 21,27 In this study, we present the analyzed results from proteomics data obtained from the same set of rats previously reported in Hakkak et al. 21 These obese Zucker rats were fed either SPI or CAS for 8 (short-term) and 16 weeks (long-term). In this study, we focused on the identification of possible target proteins and functions involved in the development and progression of NAFLD through protein expression (shotgun proteomics) analysis on liver samples. The obese Zucker rats fed with either CAS or SPI for short-term (8 weeks, 15-week-old rats) compared with long-term (16 weeks, 23-week-old rats). Age in weeks is important, because the results for short-term feeding 15-week-old rats (juveniles) can be extrapolated to adolescents, and the results for long-term feeding 23-week-old rats (adult animals) can be extrapolated to adults. To our knowledge, there are no other reports on proteomics analysis of Zucker rat liver fed SPI diet.
Materials and Methods
Ethics approval
The protocol for this study (code number 3242) was revised and approved by the Institutional Animal Care and Use Committee at the University of Arkansas for Medical Sciences (IACUC).
Experiment design
As described in Hakkak et al., 21 6-week-old male obese Zucker rats were purchased from Envigo (Indianapolis, IN, USA), and after 1 week of acclimation, rats were randomly assigned to either an SPI diet or a CAS diet as control (n = 8–9 rats per group). Rats had access to water and feeding ad libitum. At the end of the experiment (both 8 and 16 weeks), rats were killed by decapitation, and livers were immediately flash frozen in liquid nitrogen and stored at −80°C. Liver sections were histologically evaluated for the presence of vesicular lipid accumulation. Steatosis level was semi-quantitated as a score of 1 to 4 based on the observed lipid accumulation within hepatocytes: 1 ≤ 25%, 2 = 25–50%, 3 = 50–75%, and 4 = >75%, as previously described. 21
Protein extraction
Frozen liver tissue (∼100 mg) was homogenized in 1.5 mL of ice-cold 20 mM potassium phosphate buffer at pH 7.4 using a hand-held Tissue-Tearor (Model: 985370-395; Biospec Products, Inc., Bartlesville, OK, USA). 28 Following homogenization, the samples were centrifuged at 10,000 g, and the supernatant was collected and stored at −80°C until use in the future.
Proteomics analysis
Individual extracted proteins were used in shotgun proteomics analysis with in-gel trypsin digestion followed by tandem mass spectrometry conducted at the University of Arkansas for Medical Science proteomics core lab (UAMS, Little Rock, AR, USA).
28
Raw spectrum data were analyzed by database searching using Masco (Matrix Science, Boston, MA, USA) and UniProtKB database (
Bioinformatics analysis
Ingenuity Pathway Analysis software (IPA, Qiagen, CA, USA) was used in the bioinformatic interpretation of shotgun proteomics data. IPA software analysis algorithm generates predictions of activation or inhibition of upstream regulators molecules (proteins) and metabolic functions calculating two statistical measures. These measures are based on the scientific literature stored in the Qiagen knowledge database and the activation state of the molecules in our own datasets. These statistical measures are activation z-score and P value of overlap. If the expression of the molecules in our datasets is mainly consistent with the expression of the same molecules reported in the stored bibliography, then IPA generates a z-score to predict most likely activation or inhibition state of each molecule. The z-score is designed to reduce the chance that random data could generate significant predictions. Z scores ≥2 represent statistically significant predictions of activation, whereas z-scores less than or equal to −2.0 represent statistically significant predictions of inhibition. IPA uses the z-score value to predict that a particular molecule is more active (or inhibited) in the experimental samples than in the control. The P value of overlap measures if the overlap between molecules in our dataset and known upstream regulators is statistically significant and is calculated using Fisher's exact test. Significance is attributed to overlap P values <.05. Detailed information about the algorithms used in IPA program are described in Krämer et al. 29
Network generation and functional analysis
A dataset containing protein identifiers and corresponding data measurement values (log ratio, fold change, P value) was uploaded into IPA software. Each identifier was mapped to its corresponding object in Ingenuity's Knowledge Base. A fold change cutoff of >1.3 (P < .05) and less than −1.3 (P < .05) was set to identify proteins whose expression was significantly modified. These proteins, called “network eligible molecules,” were overlaid onto a global molecular network developed from information contained in the Ingenuity Knowledge Database. Then, networks made of eligible molecules in our datasets were algorithmically generated based on their connectivity. In this study, a network is a graphical representation of the molecular relationships between proteins. Proteins are represented as nodes, and the biological relationship between two nodes is represented as a line. All lines are supported by at least one reference from the stored scientific literature in the Qiagen database. The intensity of the node color indicates the degree of upregulation (bold italic) or downregulation (bold)regulation. Nodes are displayed using various shapes that represent the functional class of the protein product (Fig. 1).
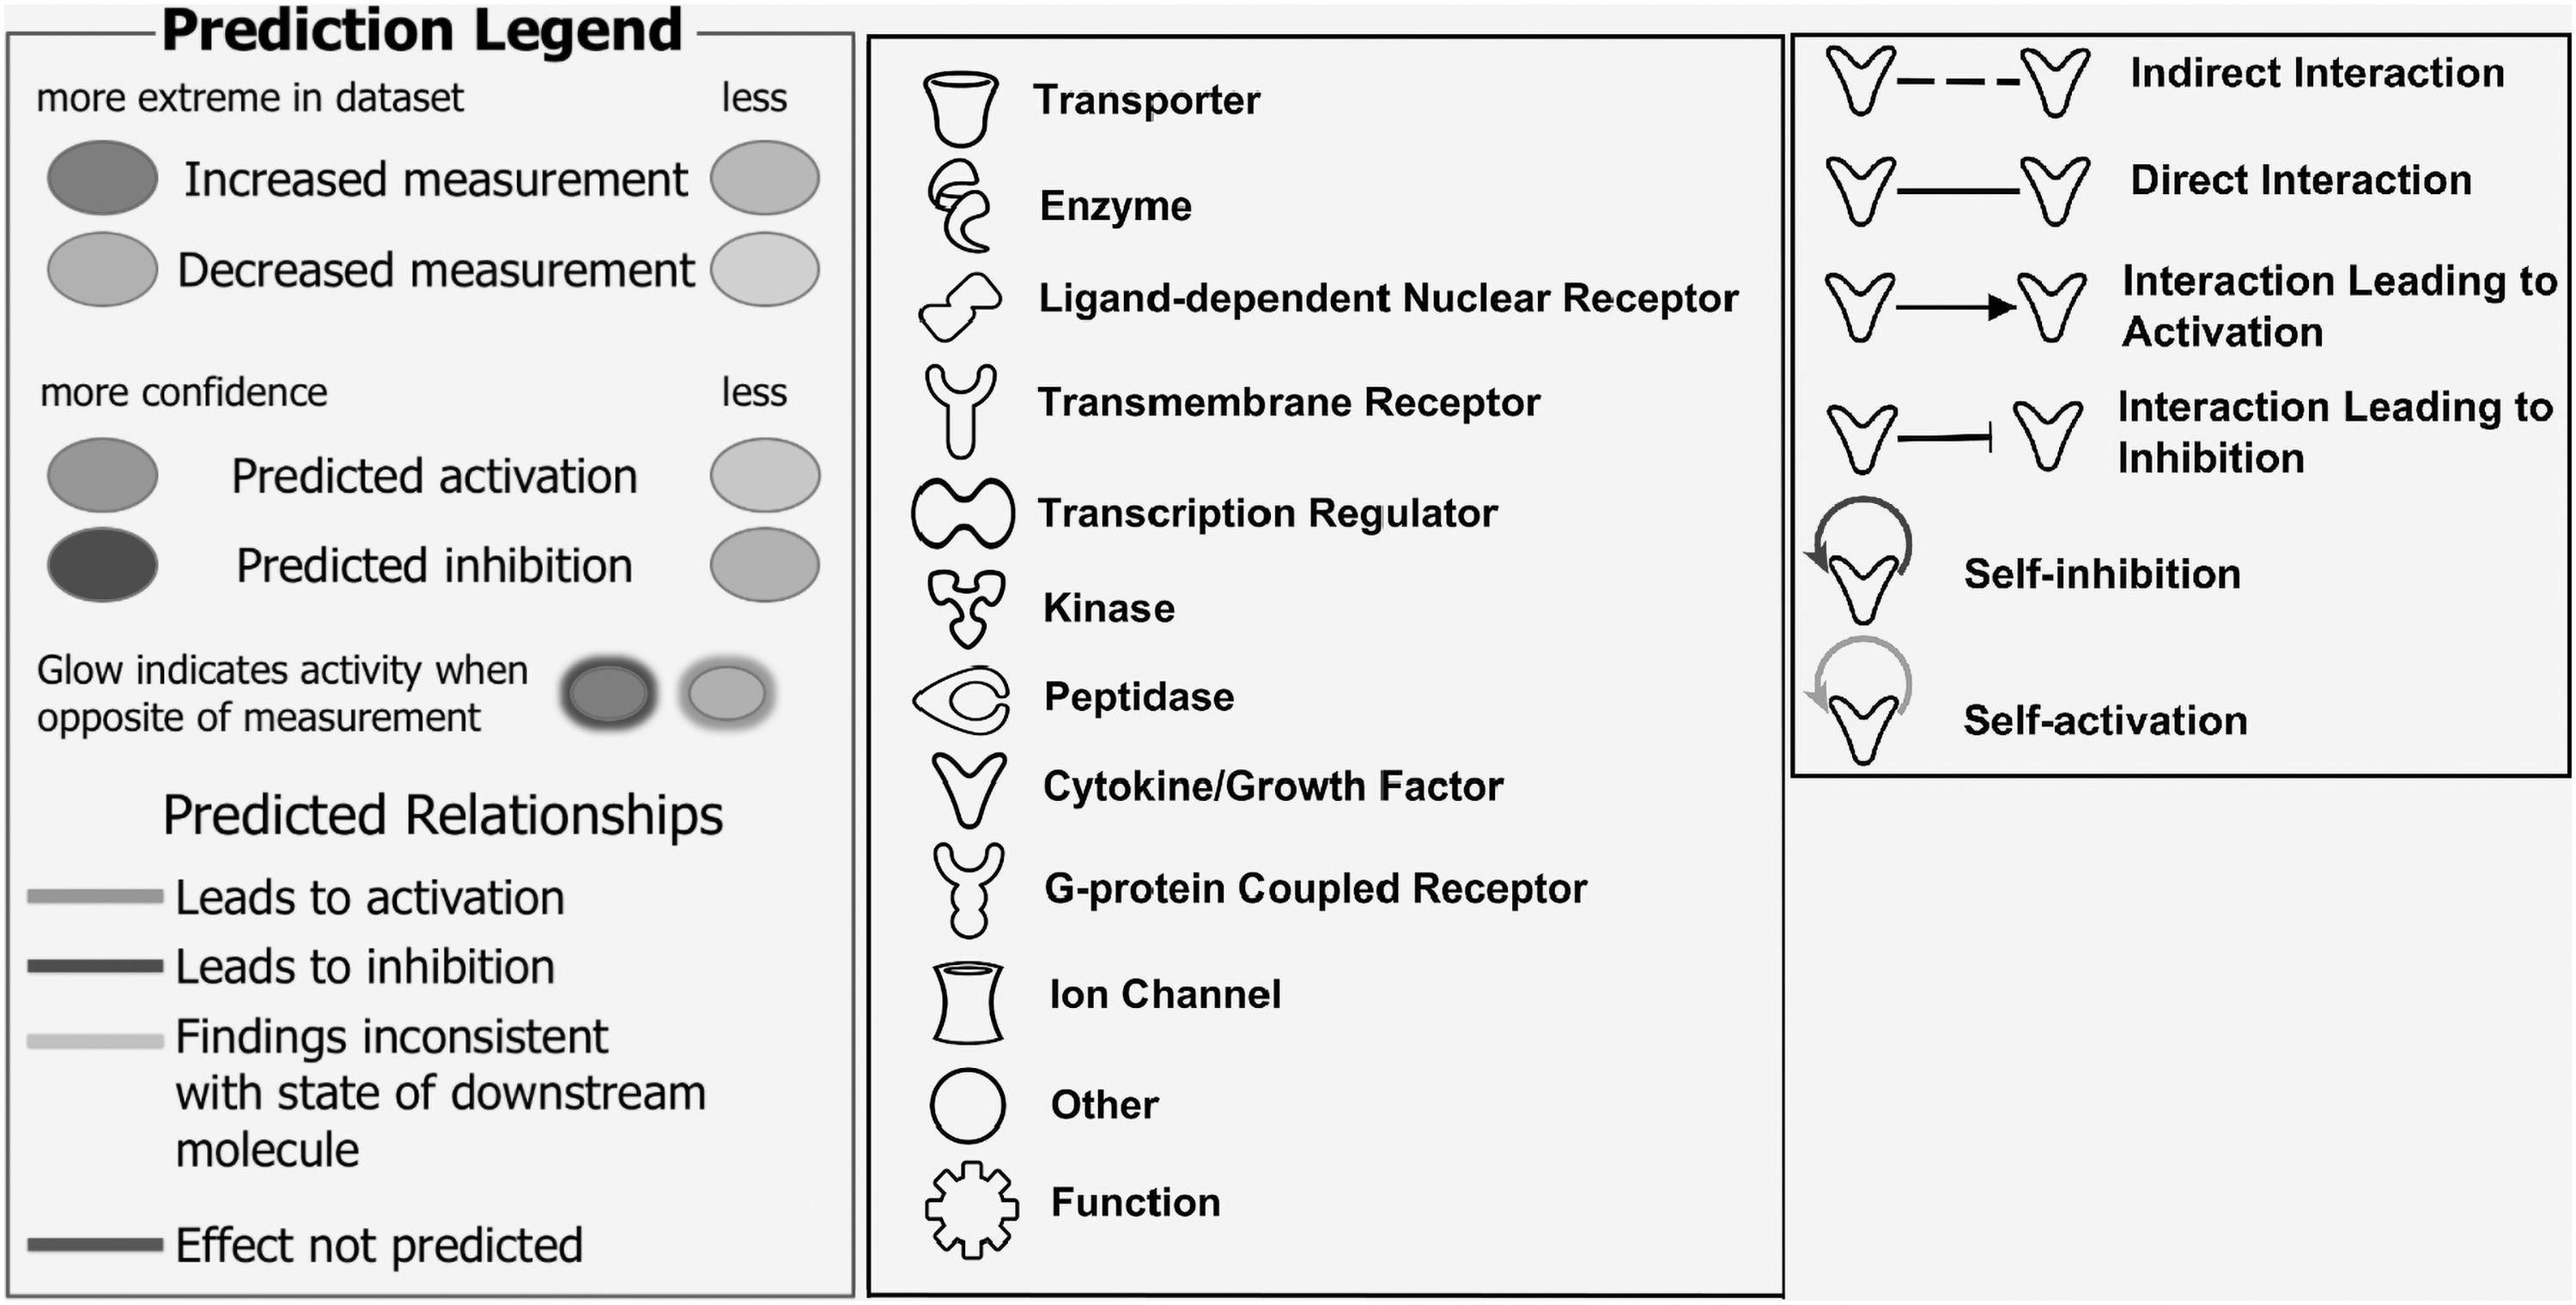
Prediction legend, Figures legend, and Line/Relationship legend for interpretation of predicted protein expression and upstream regulator and function analysis in figures made with IPA software. IPA, Ingenuity Pathway Analysis.
The functional analysis of a network identified the biological functions or diseases that were most significant to the proteins in the network. The network proteins associated with biological functions in the Ingenuity database were considered for the analysis. A right-tailed Fisher's exact test was used to calculate a P value determining the probability that each biological function assigned to that network is owing to chance alone. For further understanding, any molecule with the ability to affect the expression of other molecules is considered an upstream regulator, and master regulators are molecules that can regulate other transcriptional regulators.
It is important to highlight that each set of data, 8 and 16 weeks of diet, respectively, has already integrated the contrast between SPI and CAS. In other words, the differential protein expression and the activation predicted states of each molecule are already calculated relative to CAS diet results, in a way that every upregulated molecule in SPI group is downregulated in CAS group, and vice versa. Furthermore, every prediction in one direction in SPI diet dataset has the opposite direction in CAS diet. For example, if a protein or function is upregulated or predicted to be activated in SPI diet, it is downregulated or predicted to be inhibited in CAS diet. All the fold differences in expression are relative values, showing SPI expression compared with CAS expression.
Results and Discussion
In this study, we present the results based on protein expression made with IPA software on shotgun proteomics data using Zucker rats as an obese animal model for NAFLD fed with SPI diet. Zucker rats (fa/fa) are a well-established genetic animal model to study obesity, noninsulin-dependent diabetes, and liver steatosis, owing to the mutation in their leptin receptor, which causes hyperphagia and imbalances in metabolic gene expression, which in turn causes Zucker rats to be obese by their third week of age. 30,31
Liver analysis, body and liver weights were previously reported by Hakkak et al. and are briefly summarized in Table 1. Body weights had a significant difference between SPI and CAS by the end of 16 weeks of diet (P < .001). Liver weights were also significant when comparing CAS and SPI at 8 weeks (P < .05), and both CAS versus SPI at 16 weeks (P < .0001). In addition, there was a significant difference in steatosis scores when comparing CAS and SPI at 8 weeks (P < .05), and CAS versus SPI at 16 weeks (P < .001). 21
Phenotypic Comparison Between Rats Fed Diets Based on Casein or Soy Protein Isolate for 8 and 16 Weeks
Values represent mean ± SD of n = 8–9 rats per group.
BW, body weight; CAS, casein; LW, liver weight; SD, standard deviation; SPI, soy protein isolate.
To facilitate the interpretation of subsequent figures, we provided a visual guide in Figure 1 with the shapes and color coding used later in figures. The predictions of activation or inhibition of important metabolic functions and upstream regulators are given in Tables 2 and 3, respectively. Table 2 shows functions predicted to be inhibited (in gray) in rats fed SPI diet for 16 weeks compared with rats fed CAS diet for the same period of time. Table 2 was obtained with the “diseases and functions” analysis tool in IPA. Table 3 was obtained using the “upstream analysis” function in IPA program, and it depicts what upstream regulators (proteins) are predicted to be activated (light gray) or inhibited (dark gray) in rats fed SPI diet relative to rats fed CAS diet. The analysis is based on differentially expressed target proteins in our datasets. In this context, light gray background represents prediction of activation state (z scores ≥2), whereas dark gray background illustrates prediction of inhibition state (z scores less than or equal to −2). All the differentially expressed proteins in SPI diet compared with CAS diet presented in this article are listed in Supplementary Table S1. The differentially expressed proteins in bold italic and bold in Tables 2 and 3 indicate up- and downregulation in SPI diet, respectively. Because both short- and long-term (8 and 16 weeks) diets have similar results, and to avoid redundancy we will present and discuss mostly long-term (16 weeks) results of SPI diet.
Functions Predicted to be Inhibited (Gray) in Obese Zucker Rats Fed with Soy Protein Isolate Compared with Casein Diet for 16 Weeks

Target proteins in bold italic were upregulated (P ≤ .05, >1.3-fold difference) in SPI diet compared with CAS as control. Target molecules in bold were downregulated (P ≤ .05, less than −1.3-fold difference) in SPI diet compared with CAS diet.
Upstream Regulators Predicted to be Activated (Light Gray) or Inhibited (Dark Gray) in Soy Protein Isolate Fed Rats Compared to Casein Fed Rats Based on Differentially Expressed Downstream Target Molecules After 16 Weeks of Diet
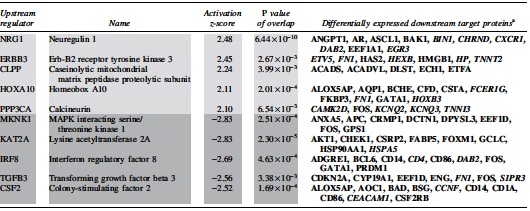
Target proteins in bold italic lettering were upregulated (P ≤ .05, >1.3-fold difference) in SPI diet compared with CAS diet. Target proteins in bold lettering were downregulated (P ≤ .05, less than −1.3-fold difference) in SPI diet compared with control.
Table 1 shows a significant decrease in the activity of one condition that could became a disease, which is proliferation of cancer cells (z-score = −2.735, P = 3.2 × 10⁻⁹). The other six elements in Table 2 belong to metabolic functions that were predicted to have a decreased activation state or inhibition after 16 weeks of SPI feeding. The z-score values, and the P value of overlap were all significant for the functions synthesis of lipid (z-score = −2.93, P = 5.82 × 10⁻¹¹), synthesis of carbohydrate (z-score = −2.68, P = 9.52 × 10⁻⁹), leukocyte migration (z-score = −2.38, P = 7.17 × 10⁻¹⁶), fatty acid metabolism (z-score = −2.32, P = 2.99 × 10⁻⁸), production of reactive oxygen species (ROS) (z-score = −2.31, P = 2.64 × 10⁻⁷), and cell movement of macrophages (z-score = −2.03, P = 8.20 × 10⁻⁸).
An example of functional network given in Table 2 is provided in Figure 2. In the “cell movement of macrophages” network (Fig. 2), all downregulated proteins (proteins in bold), with the exception of CYP7A1 (cytochrome P450 family 7 subfamily A member 1), CYP19A1 (cytochrome P450 family 19 subfamily A member 1), PRDM1 (PR/SET domain 1), and BCL6 (BCL6 transcription repressor), contributed to the prediction of inhibition of this inflammatory response function (dashed blue arrows, z-score = −2.03, P = 8.2 × 10⁻⁸). The yellow arrows for the exception proteins mentioned above revealed that the activation state of these proteins in our dataset is inconsistent with the known literature within the IPA database. The upregulation (proteins in bold italic) of CES1 (carboxylesterase 1), F7 (coagulation factor VII), FHL2 (four and a half LIM domains 2), HSPA5 (heat shock protein family A [Hsp70] member 5), and RHOB (Ras homolog family member B) would support the predicted inhibition of cell movement of macrophages because it would reduce the promoting effect these proteins would have over this inflammatory function. Conversely, the effects of FASLG (Fas ligand) and VCAN (versican) were inconsistent with their upregulation, indicating that decreased expression of these proteins would usually be correlated with an inhibition of the movement of macrophages. On the contrary, the effects of CTNNB1 (catenin beta 1), CXCL1 (C-X-C motif chemokine ligand 1), and FN1 (fibronectin 1) have not been predicted to be activated or inhibited in association with the movement of macrophages. This happens when there is a random pattern relative to the literature, and the activation state is not clear. This does not mean there is no relationship between these proteins and the movement of macrophages in liver, but that the activation state (activated or inhibited) of the proteins is not clear probably owing to the limited information regarding these relationships in citations and references in the literature, or because these relationships have yet to be reported.
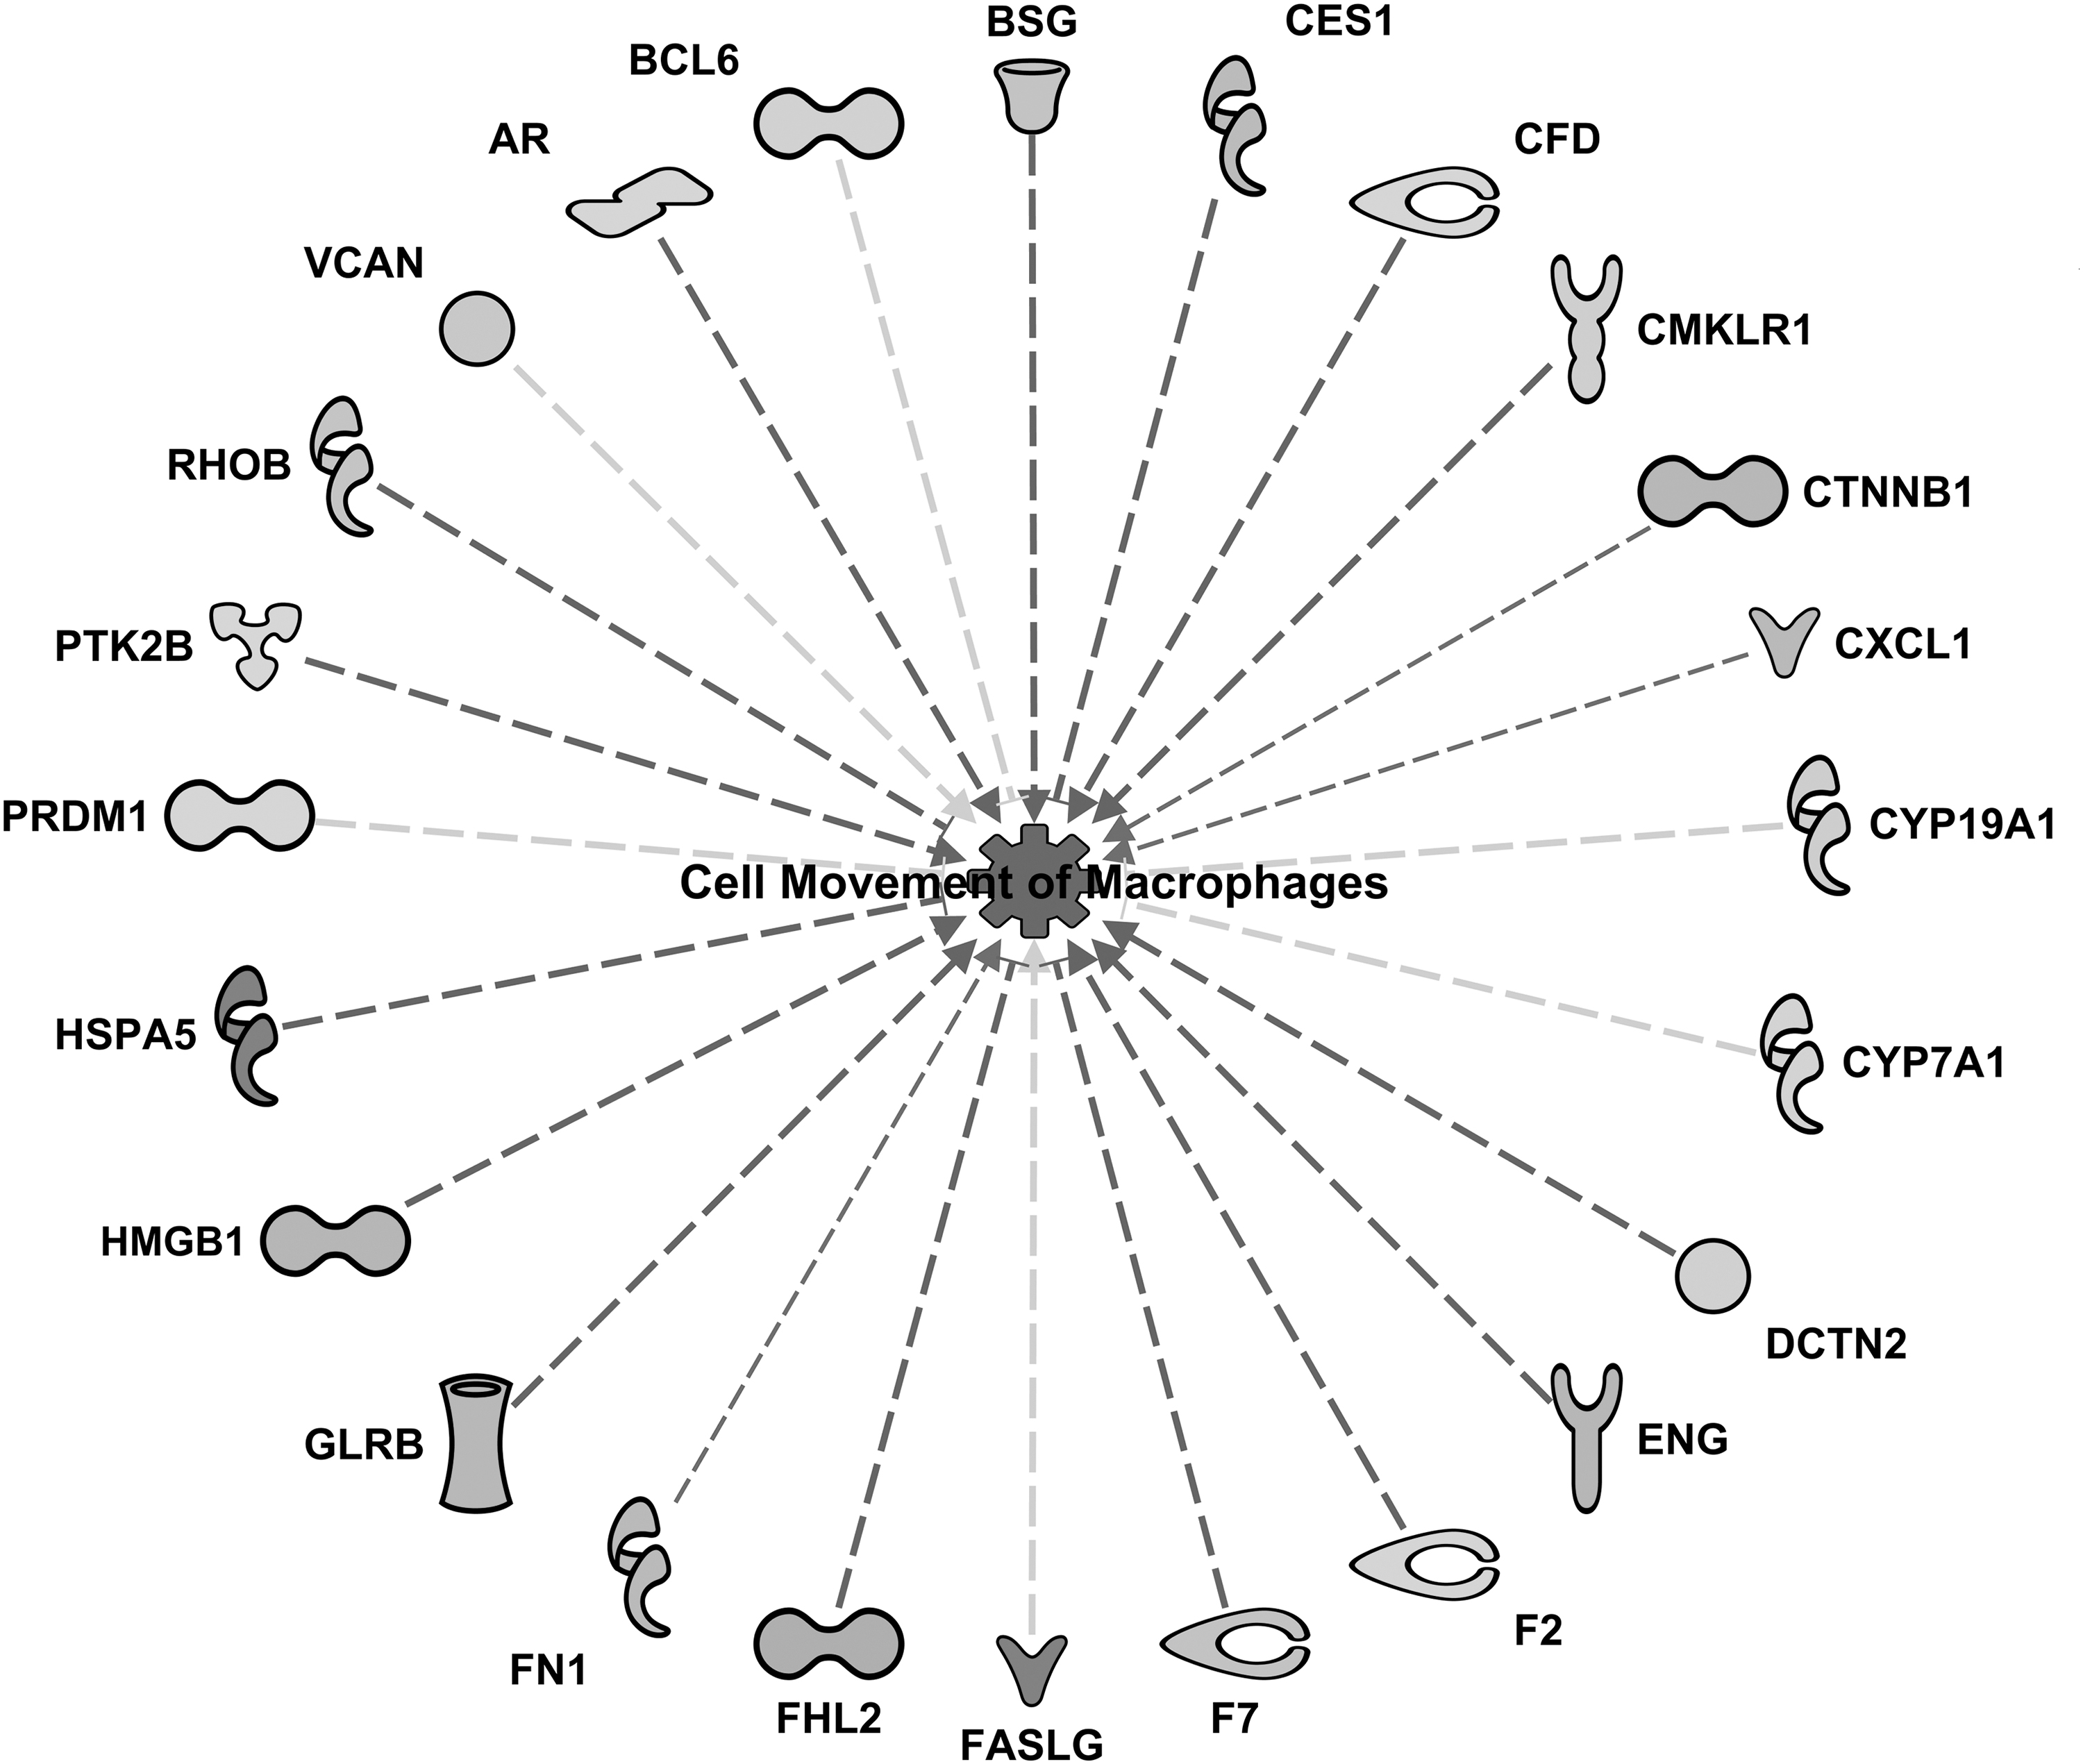
Network of differentially expressed proteins at 16 weeks of SPI diet used in calculating the activation z-score for cell movement of macrophages (z-score = −2.03, P = 8.2 × 10⁻⁸). Full names of protein abbreviations and differential expression in fold change are provided in Supplementary Table S1. SPI, soy protein isolate.
Upstream regulator analysis of the shotgun proteomics data presented in Table 3 revealed MAPK interacting serine/threonine kinase 1 (MKNK1) as the top predicted inhibited protein at both 8 and 16 weeks of SPI feeding (z-score = −2.83, P = 2.51 × 10⁻⁴, 16 weeks values), whereas Neuregulin 1 (NRG1) and Erb-B2 Receptor Tyrosine Kinase 3 (ERBB3 are at the top of predicted activated proteins after 16 weeks of SPI diet (Table 3). ERBB3 and MKNK1, and their downstream target proteins (seven proteins for ERBB3, and eight proteins for MKNK1) are illustrated in Figure 3. The purpose of “upstream analysis” is to identify which upstream regulators may be activated or inhibited to drive the differential expression observed in our dataset. The individual fold difference and P value of each downstream target protein given in Figure 3 is listed in Supplementary Table S1. Because NRG1 interacts with a large number of downstream proteins (22 proteins), we are presenting NRG1 and its target proteins in a radial type of network in Figure 4.

Upstream regulatory networks of proteins displayed in hierarchical format with their downstream target proteins presented in Table 2.
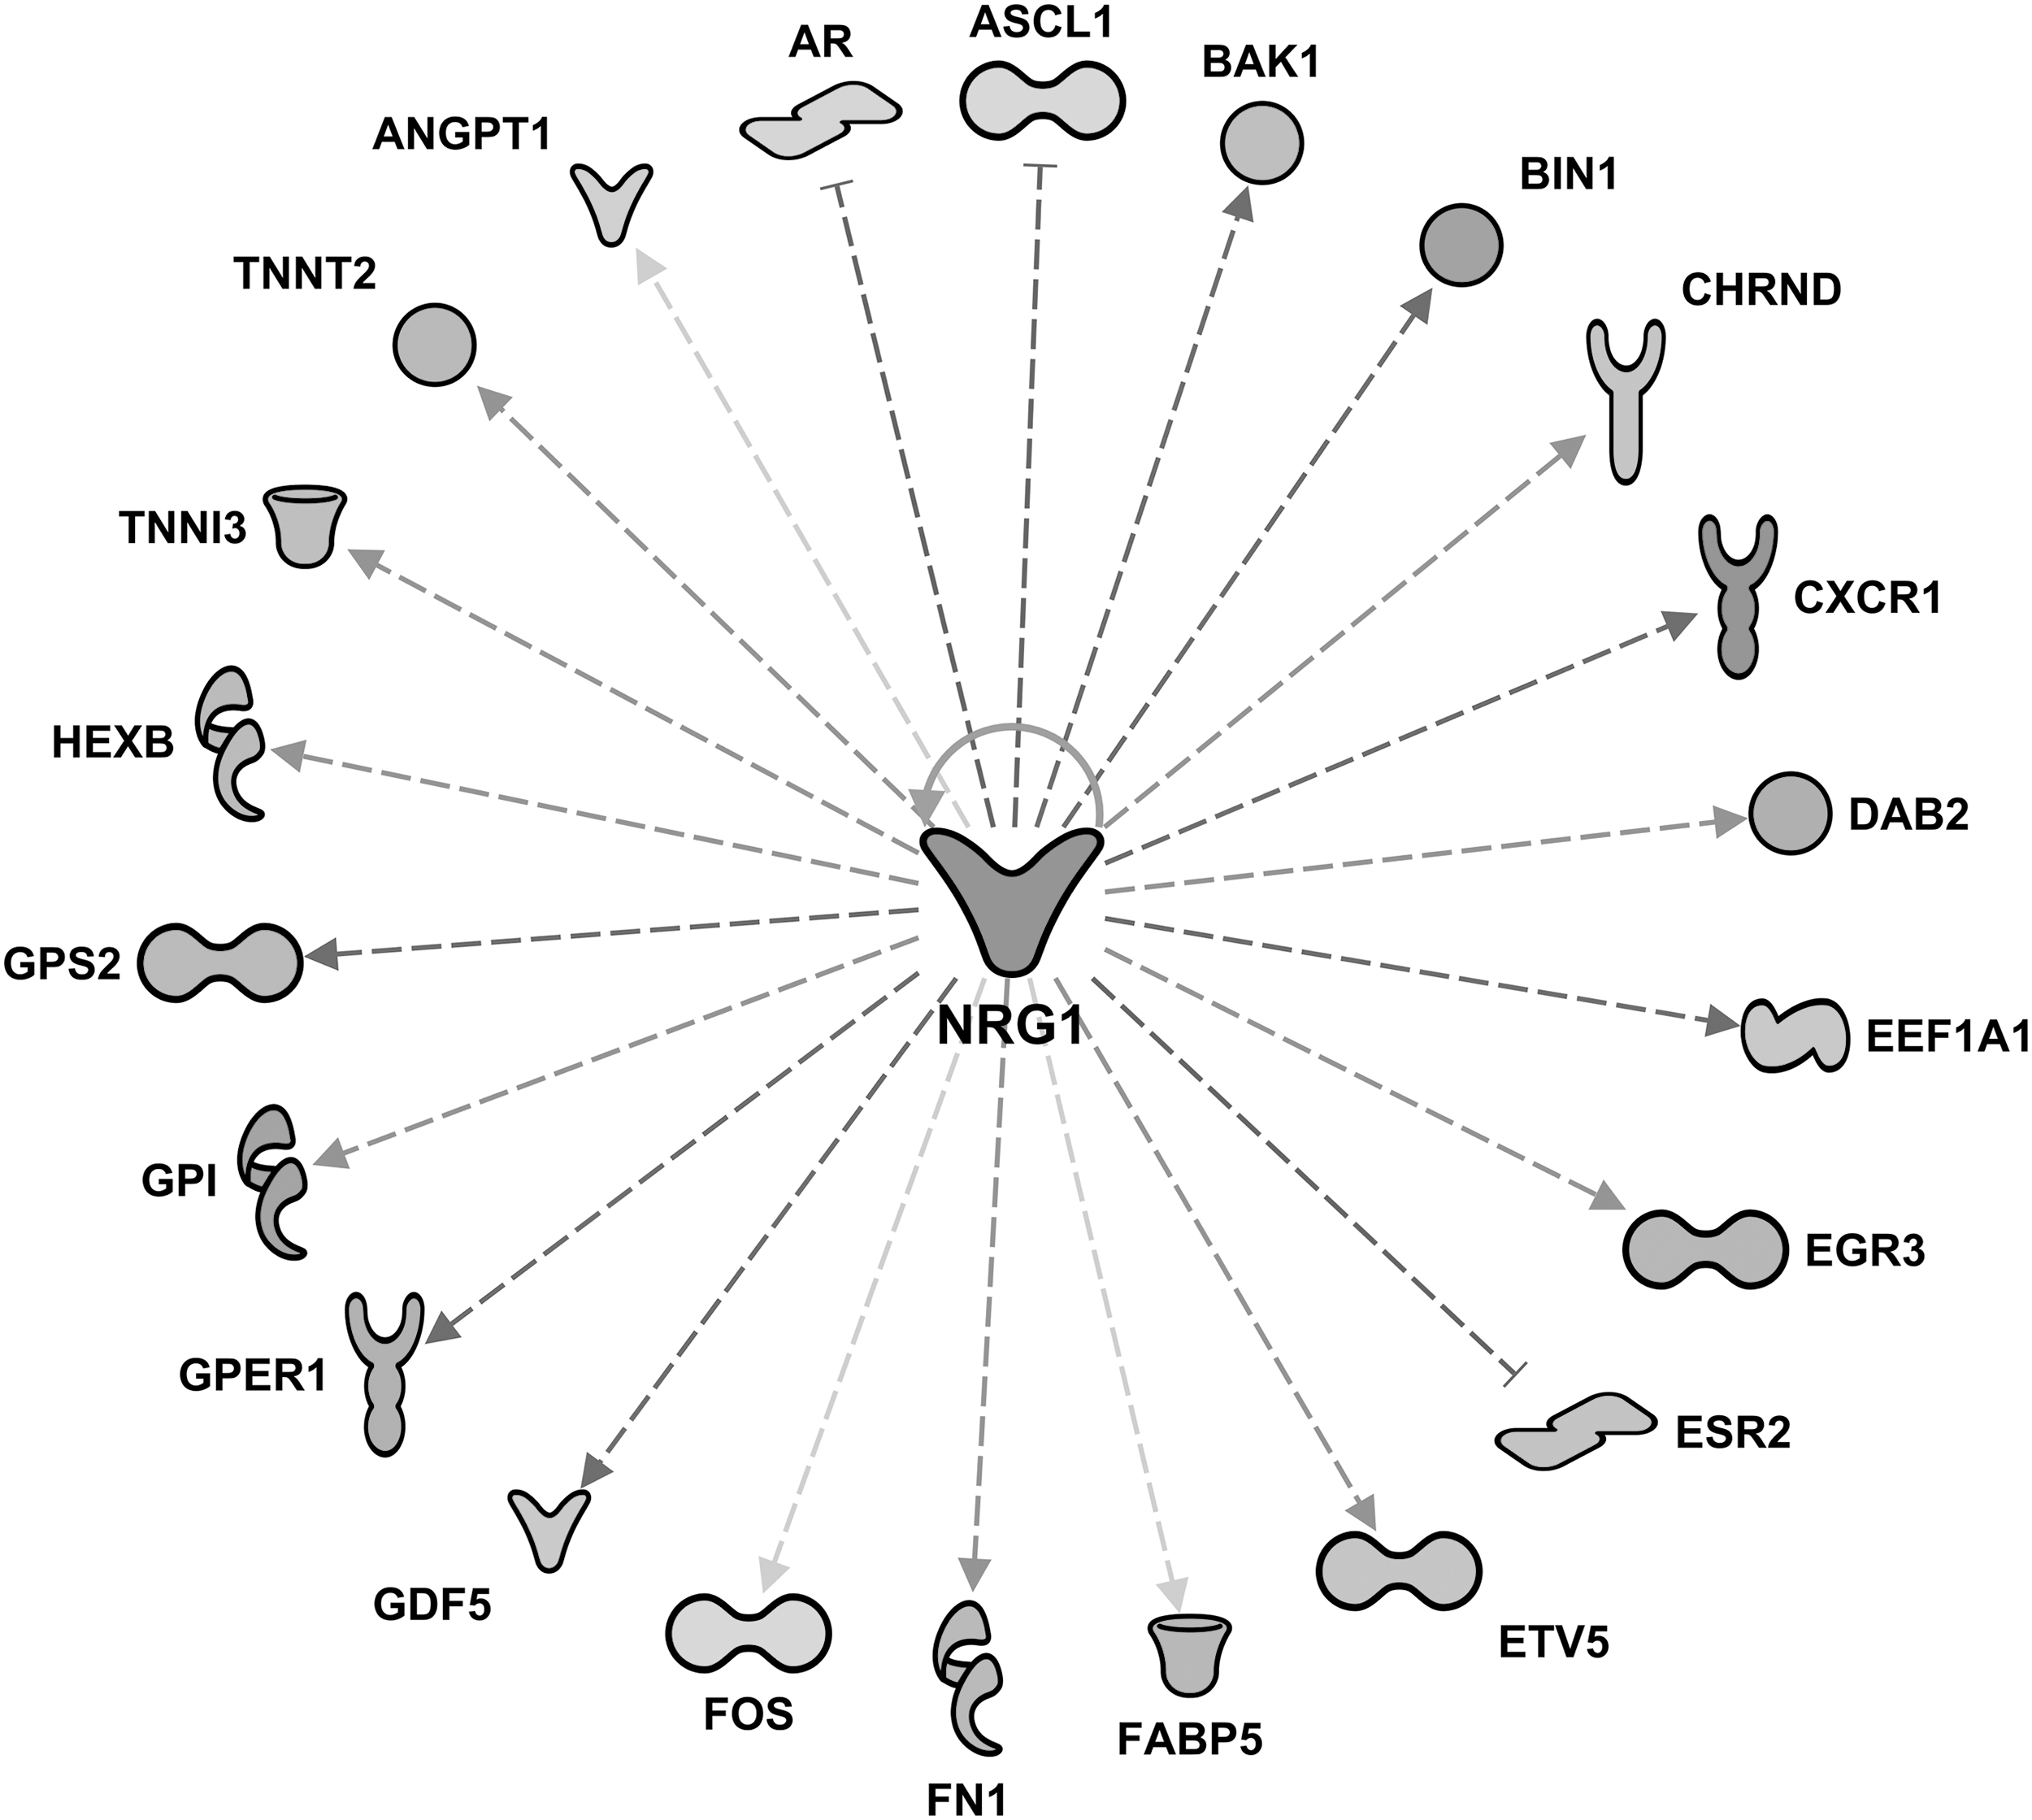
Upstream regulatory network of neuregulin 1 (NRG1) protein after 16 weeks of SPI feeding displayed in radial format (z-score = 2.48, P = 6.44 × 10⁻¹⁰). The downstream target proteins are presented in Table 2 and Supplementary Table S1.
Owing to the abundant quantity of predictions obtained in the analysis of SPI diet proteomics dataset, the discussion of all important proteins in the results will probably not only be impossible and unsatisfactory, but also beyond the scope of this study. Nevertheless, we believe it will help to generate new questions and ideas that could further be tested and contribute to a better understanding of the beneficial effects of soy proteins as a potential nonpharmacological treatment for NAFLD.
Through the “regulator effect” analysis function of IPA it is possible to predict which proteins might be related to molecules in our dataset that could be directly or indirectly acting upon a particular metabolic function or phenotype. Regulator effect analysis connects master regulators with downstream dataset molecules, and downstream functions. Regulator effect relationships with downstream target molecules also facilitate the development of hypothesizes regarding how an important function in our dataset could be controlled, by particular upstream regulators. Regulator effects results can be displayed as directional networks with a hierarchical organization, with master regulators at the top, dataset regulator molecules in the middle, and a function or phenotype at the bottom. In this regard, this analysis revealed that some of the upstream proteins presented in Table 3 are predicted master regulators of downstream target molecules associated with different important functions. For such functions, these proteins are participating, directly or indirectly, in the inhibition or activation of key components in the networks. Examples of the aforementioned predictions are given in Figure 5 and 6. Figure 5 shows how the predicted activation of NRG1 and ERBB3 would be inhibiting the production of ROS in the livers of rats fed SPI diet. Gray arrows between proteins indicate that the description of the interactions is not clear in the scientific literature stored in Qiagen database; therefore, IPA software does not make a prediction of activation or inhibition.
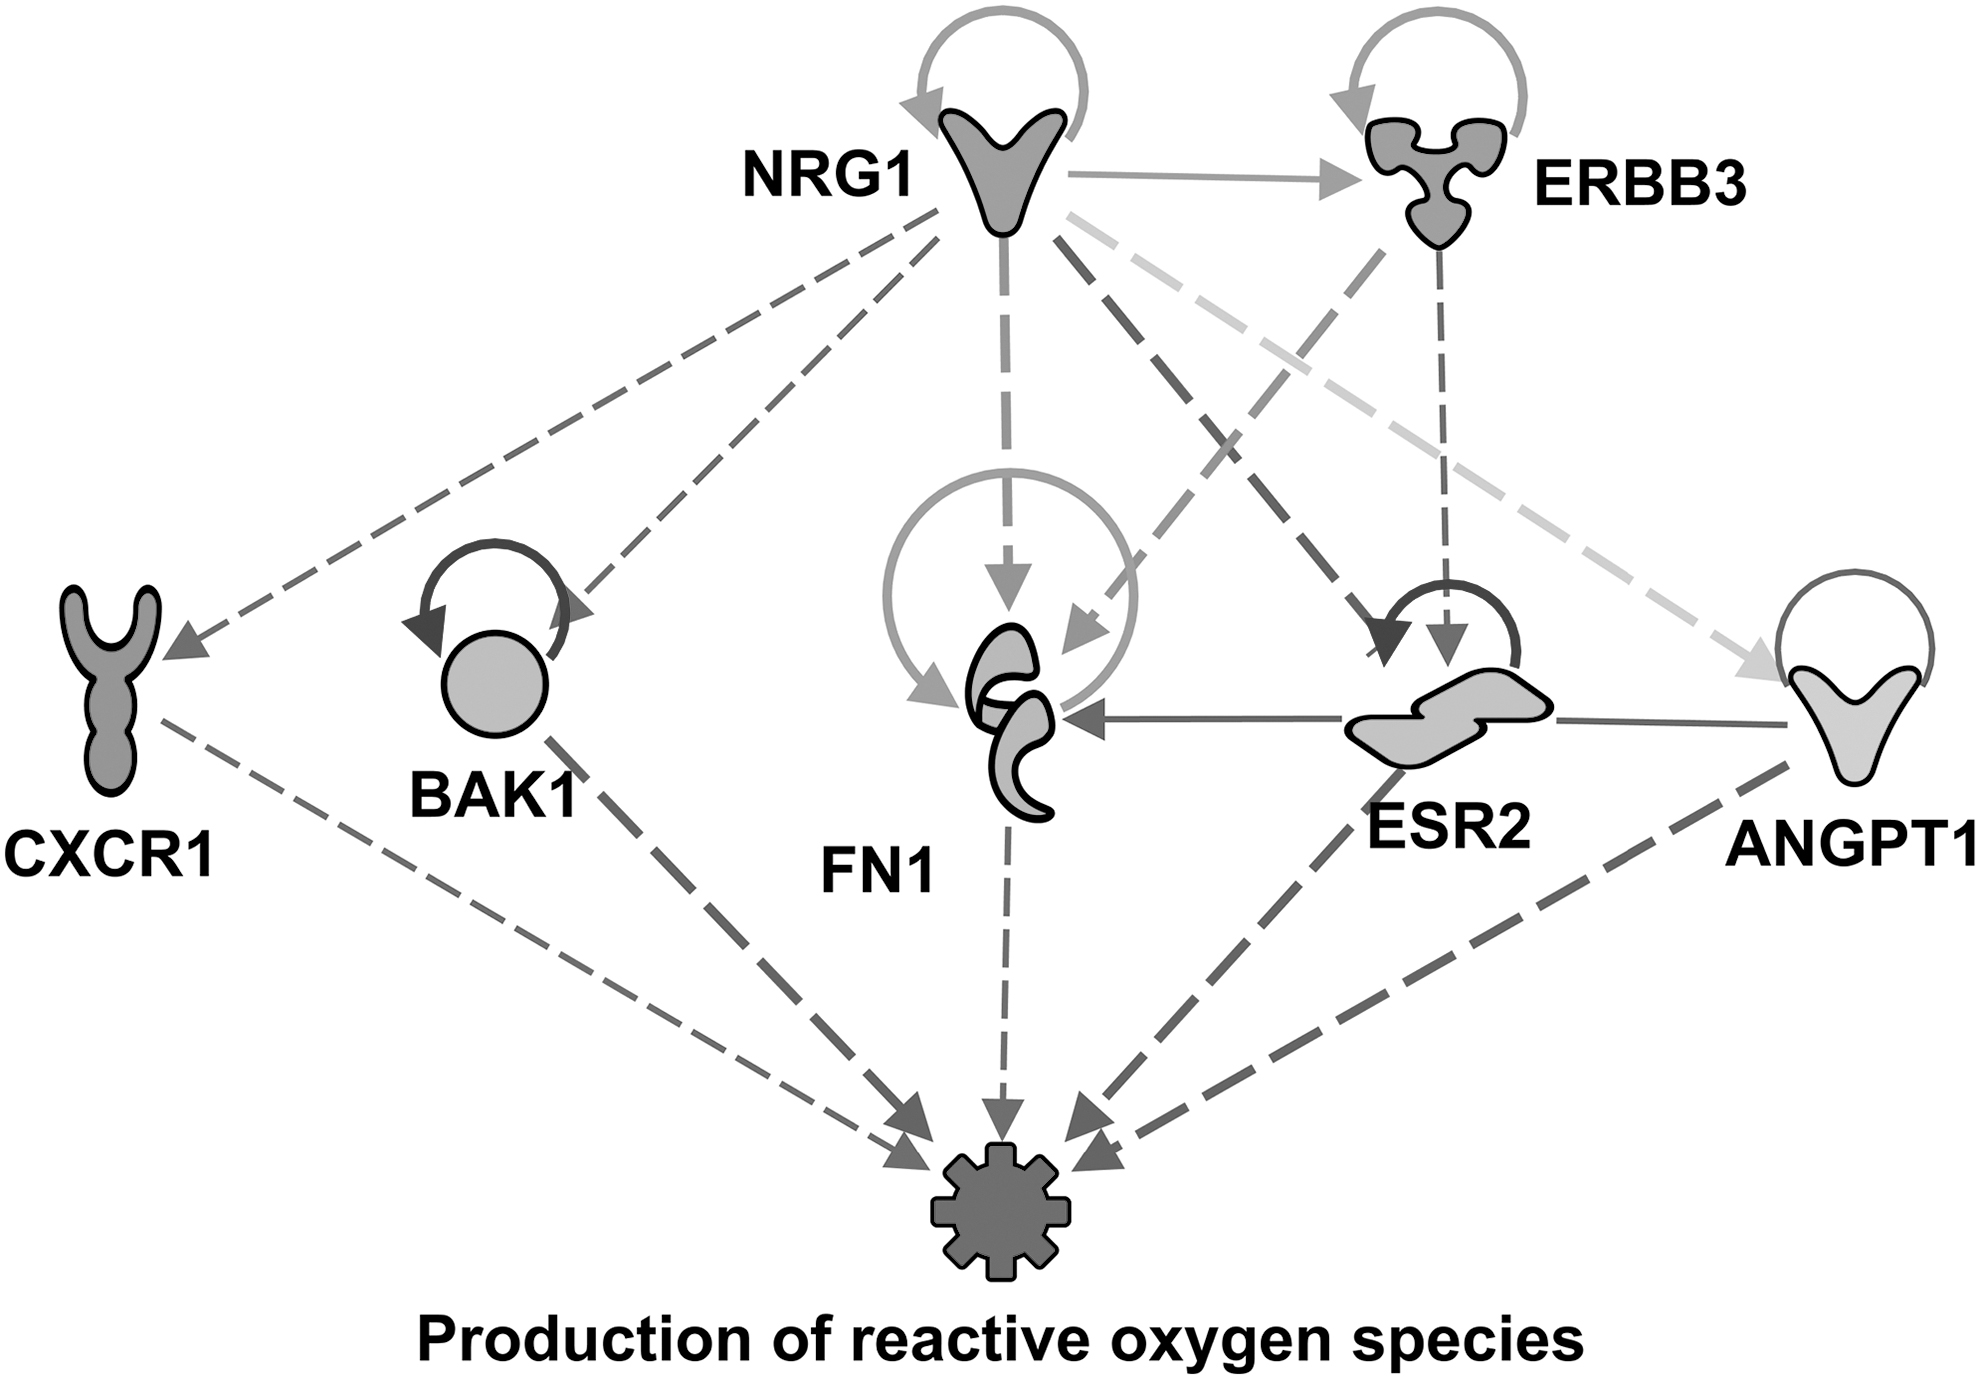
Regulator network predicting the activation of neuregulin 1 (NRG1: z-score = 2.48, P = 6.44 × 10⁻¹⁰; ERBB3: z-score = 2.45, P = 2.67 × 10⁻⁴) and the consequent predicted inhibition of production of ROS at 16 weeks of SPI diet (z-score = −2.31, P = 2.64 × 10⁻⁷). Full name of proteins are listed in Supplementary Table S1. ROS, reactive oxygen species.
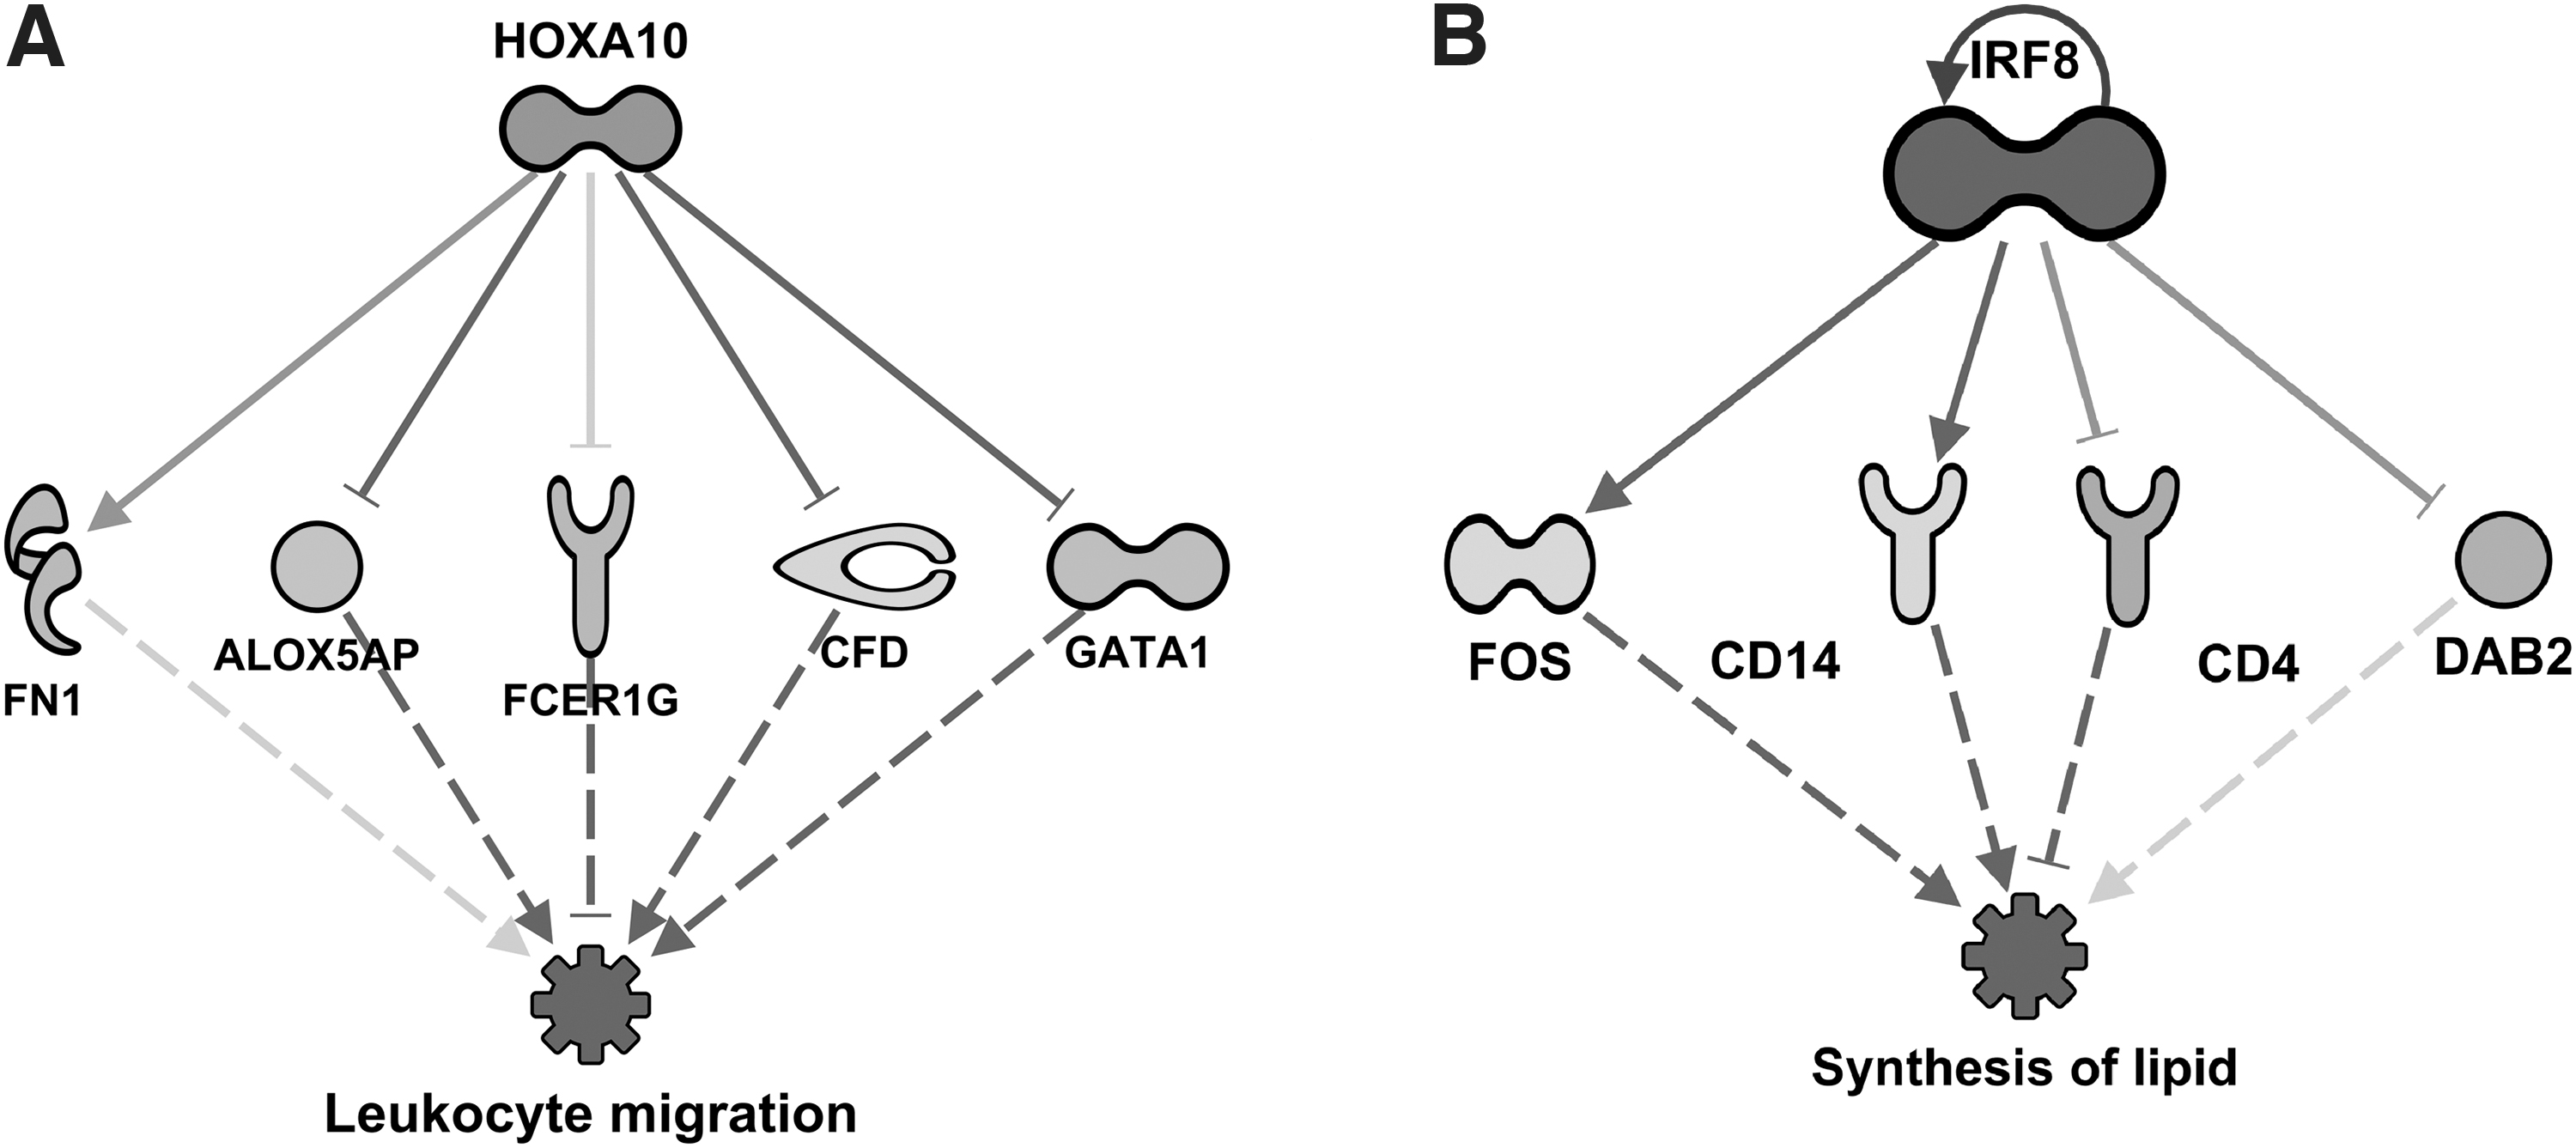
Regulator networks for predicted inhibition of leukocyte migration by Homeobox A10 (HOXA10, z-score = 2.11, P = 2.01 × 10⁻⁴) predicted to be activated after 16 weeks of SPI diet
Figure 6A shows the predicted activation of Homeobox A10 (HOXA10), a transcription factor related to embryonic development 32 but also whose regulation has been controversially related to some types of cancer. 33 –37 Figure 6A suggests that HOXA10 would be indirectly inhibiting leukocyte migration after 16 weeks of SPI feeding. Uninterrupted arrows represent direct interaction between HOXA10 and FN1, arachidonate 5-lipoxygenase activating protein (ALOX5AP), Fc fragment of IgE receptor Ig (FCER1G), complement factor D (CFD), and GATA binding protein 1 (GATA1). The dashed arrows from the aforementioned proteins to the function “leukocyte migration” represent indirect interaction. In addition, in Figure 6B interferon regulatory factor 8 (IRF8), an important transcription factor in myeloid cells, 38 predicted to be inhibited, would be in turn be indirectly inhibiting the synthesis of lipids in the livers of rats fed SPI for 16 weeks. As in Figure 6A, uninterrupted arrows represent direct interaction between IRF8 and Fos proto-oncogene (FOS), CD14 molecule (CD14), CD4 molecule (CD4), and DAB adaptor protein 2 (DAB2). Dashed arrows from proteins mentioned previously to the function “synthesis of lipids” represent indirect interactions. Previously, we reported the findings from the transcriptomic (RNAseq) data analysis obtained from the same experiment that predicted reductions in hepatic inflammatory response while enhancing lipid transport out of the liver, and we proposed these could be some of the factors behind the reduction of liver steatosis. 25 The inhibition of synthesis of lipids predicted in this study in the liver proteomics could be playing a role in the very clear amelioration of liver steatosis by SPI previously reported. 21
Many of the upstream regulators presented in this report are good candidates to further study in connection with the development of NAFLD and the intervention with a diet based on soy proteins. Here, we will briefly discuss some of these upstream regulators. MAPK interacting serine/threonine kinase 1 (MKNK1) is a Ser/Thr protein kinase or MAP kinase that interacts and is activated by extracellular signal-regulated kinase 1 (ERK1) and p38 mitogen-activated protein kinases, playing a role in the response to environmental stress and cytokines. 39 MKNK1 regulates transcription by phosphorylating eukaryotic translation initiation factor 4E (eIF4E) by interaction with eIF4G. 40,41 After studies connecting MKNK1 with the promotion of different types of cancer when active, its inhibition has been proposed as a therapeutic future treatment against cancer. 40,42 Knocked out mice for MKNK1 gene have been shown to be protected against the detrimental effects of a high-fat diet and induced obesity compared with wild-type animals, such as improved glucose tolerance, less gain weight, and a reduction in inflammatory biomarkers. 43,44 In this report, MKNK1 was predicted to be inhibited after short- and long-term of SPI feeding (Table 3 and Fig. 3A). Our results suggest SPI downregulates the expression of MKNK1 with the potential to ameliorate NAFLD symptoms. We believe that the role of a soy-based diet and its interaction with MKNK1 gene and protein should be closely investigated in relation to the observed reduction of liver steatosis.
Receptor tyrosine-protein kinase ErbB-3 or human epidermal growth factor receptor 3 (ERBB3) is a membrane-bound protein member of the epidermal growth factor receptor (EGFR) family. 45,46 Because ERBB3 shows a weak kinase activity, 47 it is considered an impaired kinase induced mostly by other ERBB proteins, 48 –51 and Neuregulins 1 (NRG1), and NRG2. 52,53 In the past years, ERBB3 upregulation has been linked to liver disease and certain cancers, including HCC. 49 Some studies suggest that ERBB3 could participate in HCC progression through the activation of signal transducer and activator of transcription 3 (STAT3). 48 In this study, ERBB3 is predicted to be activated in SPI diet results compared with CAS. However, in a recent study, Meng and collaborators concluded that ERBB3 could be modulated through phosphorylation by NGR1 to alleviate liver steatosis. 54 In our study, NGR1 is the top upstream regulator predicted to be activated after 16 weeks of SPI feeding (Table 3), and it is also predicted to inhibit the production of ROS by the 16th week on SPI diet (Table 3 and Fig. 5). NRG1 is a membrane-bound protein that modulates cell–cell signaling and participates in the development and regulation of various organ tissues, that has been linked to redox homeostasis. 55 Using regulator effect analysis we found that NRG1 has two predicted connections with downstream proteins C-X-C motif chemokine receptor 1 (CXCR1), and Bcl-2 homologous antagonist/killer (BAK1) a mitochondrial pro-apoptotic protein, whose effects are not clear in the scientific literature stored in the Ingenuity's Knowledge Database, and therefore could not be predicted in either direction (activation or inhibition) by IPA software (Fig. 5). BAK1 is predicted to indirectly participate in the inhibition of ROS production (dashed blue arrows), whereas CXCR1 effect on ROS production could not be predicted by IPA application in either direction (activation or inhibition). This does not suggest a lack of relationship or effect, but rather that the current information pertaining to those connections is scarce still in the scientific literature. This fact also indicates that these proteins might be the target of future research. Figure 5 also shows a direct molecule–molecule interaction predicted to be exerted from NRG1 to ERBB3 (uninterrupted orange arrow in Fig. 5). ERBB3 does not show a direct connection to production of ROS; however, ERBB3 would be promoting the activation of fibronectin 1 (FN1), and estrogen receptor 2 (ESR2) in some way that is not clear in the IPA database-stored literature, hence IPA application could not make a prediction (dark gray arrows in Fig. 5). In Figure 3, the network obtained using the “upstream analysis” function on IPA, the activation of ERBB3 is also contributing to the upregulation of FN1. Back to Figure 5, the downregulation of two proteins, ESR2 and ANGPT1, would be indirectly contributing to the inhibition of ROS production (dashed blue arrows). The upregulation of FN1 has an unpredicted effect over ROS production (gray arrow from FN1 to production of ROS). Both proteins NRG1 and ERBB3 are strongly predicted to be activated on SPI results compared with CAS, and because the mitigation of liver steatosis is still observed after 16 weeks of SPI diet, we suggest a nondetrimental effect exerted by the activation of ERBB3 in early stages of NAFLD in obese Zucker rats when fed a SPI-based diet. To test this idea further research is warranted.
By analyzing proteomic data using the IPA application, we were able to obtain predictions of proteins and functions based on the liver protein expression and the scientific literature stored in Ingenuity's database. The results of this study concur with previous observations on transcriptomic data analysis in the same obese animal model, in which we detected that the longer the feeding with a SPI diet the higher the benefits against liver steatosis. In addition, these predictions may provide clues by which SPI produces the observed attenuation of liver steatosis in obese Zucker rats. Our results suggest that a SPI-based diet changes the expression of proteins that may be involved in the reduction of liver steatosis.
Footnotes
Authors' Contributions
Experimental design, R.H.; Data Preparation—B.K.; Formal Analysis—M.K.; Writing—original draft preparation, M.K.; Writing—review and editing, M.K.; W.B.; B.K.; and R.H. All authors have read and agreed to the final version of the article.
Author Disclosure Statement
No competing financial interests exist.
Funding Information
This research received no external funding. However, the College of Medicine's University Medical Group (R.H.) and the Arkansas Biosciences Institute (W.B., R.H.) provided the funding.
Supplementary Material
Supplementary Table S1
References
Supplementary Material
Please find the following supplemental material available below.
For Open Access articles published under a Creative Commons License, all supplemental material carries the same license as the article it is associated with.
For non-Open Access articles published, all supplemental material carries a non-exclusive license, and permission requests for re-use of supplemental material or any part of supplemental material shall be sent directly to the copyright owner as specified in the copyright notice associated with the article.
