




Abstract
Polygonatum sibiricum (PS) has been used as herbal medicine to treat type 2 diabetes mellitus (T2DM). However, how lactic acid fermentation of PS influences glucose and lipid metabolism remains unclear. The current study was undertaken to evaluate the hypoglycemic and hypolipidemic effects of PS fermented with Lactobacillus brevis YM 1301 (YM 1301) in streptozotocin and high-fat diet-induced T2DM mice. Biochemical analysis revealed that supplementation with metformin, PS, or fermented Polygonatum sibiricum (FPS) lowered the fasting blood glucose, insulin, total cholesterol, triglyceride, and low-density lipoprotein cholesterol of diabetic mice. FPS showed relatively more potency to reduce the homeostasis model assessment-insulin resistance and glycated hemoglobin than PS. Moreover, a high dosage of FPS protected against glucose intolerance and insulin resistance by increasing the ratio of phosphor-AKT/AKT. Histological examination and quantitative polymerase chain reaction results showed that dietary FPS ameliorated the lipid accumulation in liver and white adipose tissue (WAT) by inhibiting lipogenesis, enhancing lipolysis, and fatty acid oxidation. FPS exhibited greater efficacy than PS on improving the transcriptional expression of adipose triacylglyceride lipase, carnitine palmitoyltransferase 1, and uncoupling protein 1. In addition, FPS exerted a striking anti-inflammatory effect by suppressing the expression of interleukin 6, interleukin 1β, tumor necrosis factor-α, and transforming growth factor-β in WAT of diabetic C57BL/6 mice. Finally, FPS supplementation enhanced the activation of AMPK. In conclusion, these results suggest that the FPS may be more promising than PS as a potential therapeutic agent for diabetes and obesity.
Introduction
It is well known that diabetes and its complications have become a worldwide serious health problem. The International Diabetes Federation estimates that individuals with diabetes would increase to 415 million worldwide in 2040, 1 among which more than 90% are type 2 diabetes mellitus (T2DM). 2 T2DM patients usually exhibit severe insulin resistance, associated with obesity, lipid metabolic disorder, and chronic inflammations.
Although there are many pharmacological treatments for T2DM, current research and clinical evidence suggest that these patients with side effects and body dependence are on the rise. Therefore, alternative therapies, such as dietary interventions of functional food, have become an attractive direction for the prevention and treatment of T2DM. 3
In this context, pharmacological studies have shown that the dietary consumption of Polygonatum sibiricum (PS) has beneficial effects on regulating glucose and lipid homeostasis. 4,5
In brief, PS is the dry rhizome of Polygonatum kingianum Coll. et Hemsl, P. sibiricum Red, belonging to the family Liliaceae. Many publications reported the abundant biological activities of PS, such as neuroprotective, immunity enhancement, and antidiabetic and anticancer effects, had been attributed to the presence of multiple bioactive components, especially polysaccharides, saponins, alkaloids, flavonoids, lignin, and amino acids. 6 Polygonatum sibiricum polysaccharides (PSP) are believed to be the crucial ingredient of PS, which have been reported to have many biological activities, such as antioxidant, antibacterial, anti-inflammatory, hypoglycemic, and hypolipidemic effects. 6 –9
At the same time, saponin plays a neuroprotective effect by the elimination of free radicals, inhibition of inflammation, suppression of oxidative stress, and so on. 10 –12 However, PS also contains a relatively high level of monosaccharide and disaccharide, which are not suitable for excess consumption by diabetic patients.
To improve the functional bioactivities and eliminate the antinutrients, fermentation with probiotics has been introduced in our study. Lactobacillus brevis YM 1301 (YM 1301) was applied since it has been widely used as a safe and health-promoting supplement in food fermentation. 13,14 Moreover, it was believed to consume mono- and disaccharides during rapid growth to maintain the stable blood glucose of diabetic patients. 14 It is reported that carrot juice fermented with Lactobacillus plantarum ameliorates hyperglycemia and lipid profiles in T2DM rats. 15 This present study aims to assess the hypoglycemic and hypolipidemic potential of PS fermented with YM 1301 in vivo and further explore the underlying mechanism in a mouse model of T2DM.
Materials and Methods
Preparation of fermented Polygonatum sibiricum and chemical analysis
First, PS (Shangnan County, Shaanxi Province; Lot: 20170156) was chopped and homogenized with distilled water at the ratio of 1:4 (g/mL). PS suspension was sterilized by autoclaving at 121°C for 20 min. After cooling down, 107 CFU/mL YM 1301 (Yunnan Institute of Microbiology) suspension was added to it at the ratio of 1:10 (v/v). Then the mixture was fermented statically at 37°C for 60 h in a microbiological incubator. Finally, the fermented Polygonatum sibiricum (FPS) was then lyophilized and stored at −80°C before use.
In this study, glucose was determined by the glucose oxidase–peroxide enzyme test. The reducing sugar, polysaccharide, and saponin were measured by 3, 5-dinitrosalicylic acid method, phenol–sulfuric acid method, and vanillin–perchloric acid colorimetric method, respectively.
Animals and experimental design
All C57BL/6 mice were conducted by the “Guidelines for the Care and Use of Laboratory Animals” of the National Institutes of Health and were approved by the Animal Care and Use Committee of Shaanxi Normal University (ECES-2018-0225). C57BL/6 male mice (weight 18 ± 2 g) were purchased from the Experimental Animal Center of the Medical Department of Xi'an Jiaotong University (Xi'an, China), animal production license number SCXK (Shaanxi) 2018-003. All animals were maintained in an environmentally controlled facility with diurnal light cycle and free access to water and either a standard rodent chow. Before the experiment, all animals were adapted to the laboratory environment for a week.
The T2DM mice were established according to the previously published article. 16 The 60 male C57BL/6 mice were randomly divided into two groups, the control group (Ctrl, 10 mice) and the diabetes model group (DM, 50 mice). The Ctrl mice were fed with a normal diet, whereas the DM mice were injected with 70 mg/kg streptozotocin (STZ) (Sigma, USA) for two consecutive days and fed with high-fat diet. After 3 weeks, the C57BL/6 mice were considered to be diabetic if their fasting blood glucose >11.1 mmol/L, as detected using a glucometer (One-touch Ultra; LifeScan). Then 40 diabetics C57BL/6 mice out of 50 were orally gavaged with 0.15 g/kg Met (Shandong Mingren FREDA Pharmaceutical Co., Ltd, China), PS (1 g/kg), or a different dose of FPS (0.5 g/kg for low-dose FPS (FPSL) group or 1 g/kg for high-dose FPS (FPSH) group) for 1 month, respectively. In the meantime, ctrl mice and the rest of 10 DM mice were gavaged with the same volume of saline.
Biochemical analysis
All C57BL/6 mice were sacrificed after overnight (8 h) fast, blood was collected from the tail vein. The insulin was determined by the Insulin Enzyme-Linked Immunosorbent Assay (ELISA) Kit, and glycated hemoglobin was determined by glycated hemoglobin ELISA Kit (Shanghai Enzyme Co., Ltd, China). The homeostasis model assessment-insulin resistance (HOMA-IR) was calculated following the formula: 17 HOMA-IR = fasting blood glucose (mmol L−1) × insulin (mU L−1)/22.5. The total cholesterol (TC), triglyceride (TG), low-density lipoprotein cholesterol (LDL), high-density lipoprotein cholesterol, and glycogen are determined following the instructions on the kit (Nanjing Jiancheng Bioengineering Institute, China).
Oral glucose tolerance test and insulin tolerance test
Oral glucose tolerance test (OGTT): C57BL/6 mice were orally gavaged with a 2.5 g/kg glucose solution after 8 h of fasting. Insulin tolerance test (ITT): C57BL/6 mice were injected with insulin (Novo Nordisk, China) after fasting for 2 h at a dose of 0.3I U/kg. Blood glucose was measured at 0, 30, 60, and 120 min after glucose or insulin load. 18
Hematoxylin and eosin staining
Briefly speaking, liver and white adipose tissue (WAT) were fixed with 4% formaldehyde paraffin-embedded, sectioned, and stained with Hematoxylin and Eosin (H&E). 19 Histopathological images were observed under an optical microscope.
Western blot analysis
Western blot experiment was carried out as previously described. 20 Tissues were homogenized in ice-cold radio-immune precipitation assay (RIPA) lysis-buffer containing 1% phosphatase inhibitor cocktail and phenylmethylsulfonyl fluoride. Total protein concentrations were determined by the Bicinchoninic Acid Protein Assay Kit. Antibodies: AKT (1:2000, no. 4691; Cell Signaling Technology, Inc.), phosphor-AKT (p-AKT) S473 (1:1000, no. 4060; Cell Signaling Technology, Inc.), phosphor-AMPK (1:1000, no. ab23875; Abcam), AMPK (1:1000, no. ab80039; Abcam), GAPDH (1:2000, no. ab8245; Abcam), HRP-conjugated anti-rabbit IgG (1:2000, no. EK020; Xi'an BoZhi Biotechnology Co. Ltd.), HRP-conjugated anti-mouse IgG (1:2000, no. EK010; Xi'an BoZhi Biotechnology Co. Ltd.).
Quantitative reverse transcription–polymerase chain reaction
Total RNA was homogenized and extracted using TRIzol reagent (Invitrogen, USA), and cDNA synthesis (Fermentas, USA) was accomplished according to the instructions from the RevertAid First-Strand cDNA Synthesis Kits, and the RT–polymerase chain reaction (PCR) experiment was conducted following the process described above. 20 The sequences of the primers used in this study are shown in Supplementary Table S1. Gene expression was calculated by 2−ΔΔCt method. 21
Statistical analyses
All data were analyzed using SPSS 22.0 software and presented as the mean ± standard error of the mean. One-way analysis of variance (ANOVA) test (S-N-K test) was used for the statistical analyses. Means with different letters (a–e) differ significantly (P < .05). Graphics were constructed using GraphPad Prism 8.
Results
Chemical analysis of PS and FPS
First, the polysaccharide, saponin, glucose, and reducing sugar from PS and FPS infusion were tested. As shown in Table 1, FPS contained 43.51% of polysaccharide, compared with 35.23% from PS. The reducing sugars from FPS were only 3.83%, significantly lower than 9.47% from the unfermented PS. Consistently, the glucose from FPS also reduced more than two folds. The saponin did not change between groups. Since monosaccharides and disaccharides can induce a fast increase in blood glucose, to some extent, the decrease of reducing sugar, combined with the increase of polysaccharide in FPS are believed to have better antihyperglycemic, antilipidemic, and anti-inflammatory effects.
Chemical Analysis of Polygonatum sibiricum and Fermented Polygonatum sibiricum
Values of chemical analysis of PS and FPS are presented as mean ± SEM (n = 5/group), means with different letters (a and b) within a column differ significantly (P < .05).
FPS, fermented Polygonatum sibiricum; PS, Polygonatum sibiricum; SEM, standard error of the mean.
FPS preserves metabolic and biochemical parameters
To identify the role of FPS on glucose and lipid homeostasis, several metabolic and biochemical parameters were tested, and the results are shown in Table 2. There was a significant elevation in fasting blood glucose, insulin, glycated haemoglobin (GHb), liver glycogen, TG, TC, and low-density lipoprotein of diabetic C57BL/6 mice in comparison to the control. As expected, Met, PS, FPSL, and FPSH treatments resulted in a significantly lower level of fasting blood glucose, insulin, and GHb compared with those from the DM group. C57BL/6 mice fed with PS maintained a relatively higher level of GHb and HOMA-IR compared with the other treatment groups. However, the FPSH treatment was able to restore the GHb and HOMA-IR to normal. In addition, all the administrations showed an obvious effect on lowering the liver glycogen storage, but the muscle glycogen remained unchanged between groups.
Metabolic and Biochemical Parameters
Values of metabolic parameters are presented as mean ± SEM (n = 5/group); mean with different letters (a–d) within a column differ significantly (P < .05).
Ctrl, control group; DM, diabetes model group; FPSH, high-dose FPS; FPSL, low-dose FPS; GHb, glycated haemoglobin; HDL, high-density lipoprotein cholesterol; HOMA-IR, homeostasis model assessment-insulin resistance; LDL, low-density lipoprotein cholesterol; TC, total cholesterol; TG, triglyceride.
During the study, we also observed that all the treatments significantly reduced the TG and LDL values. The decrease in LDL in the FPSH group was the greatest when compared with those of other treatment groups. However, TC content did not statistically differ between experimental groups. These results suggest that the FPS is beneficial for long-term glucose, TG, and LDL control.
FPS supplementation improved glucose tolerance and insulin sensitivity in DM mice
To further clarify the effect of FPS on controlling blood glucose, OGTT and ITT were performed. As shown in Figure 1A, the blood glucose level rose to a peak at 30 min after glucose loading. After that, we observed a marked drop of blood glucose from the Met-, PS-, or FPS-treated group compared with a slight decrease in the DM group. The quantitative analysis revealed that the area under the curve (AUCOGTT) in Met, PS, and FPSH groups reduced by 37.98%, 17.21%, and 34.12%, respectively (Fig. 1B).
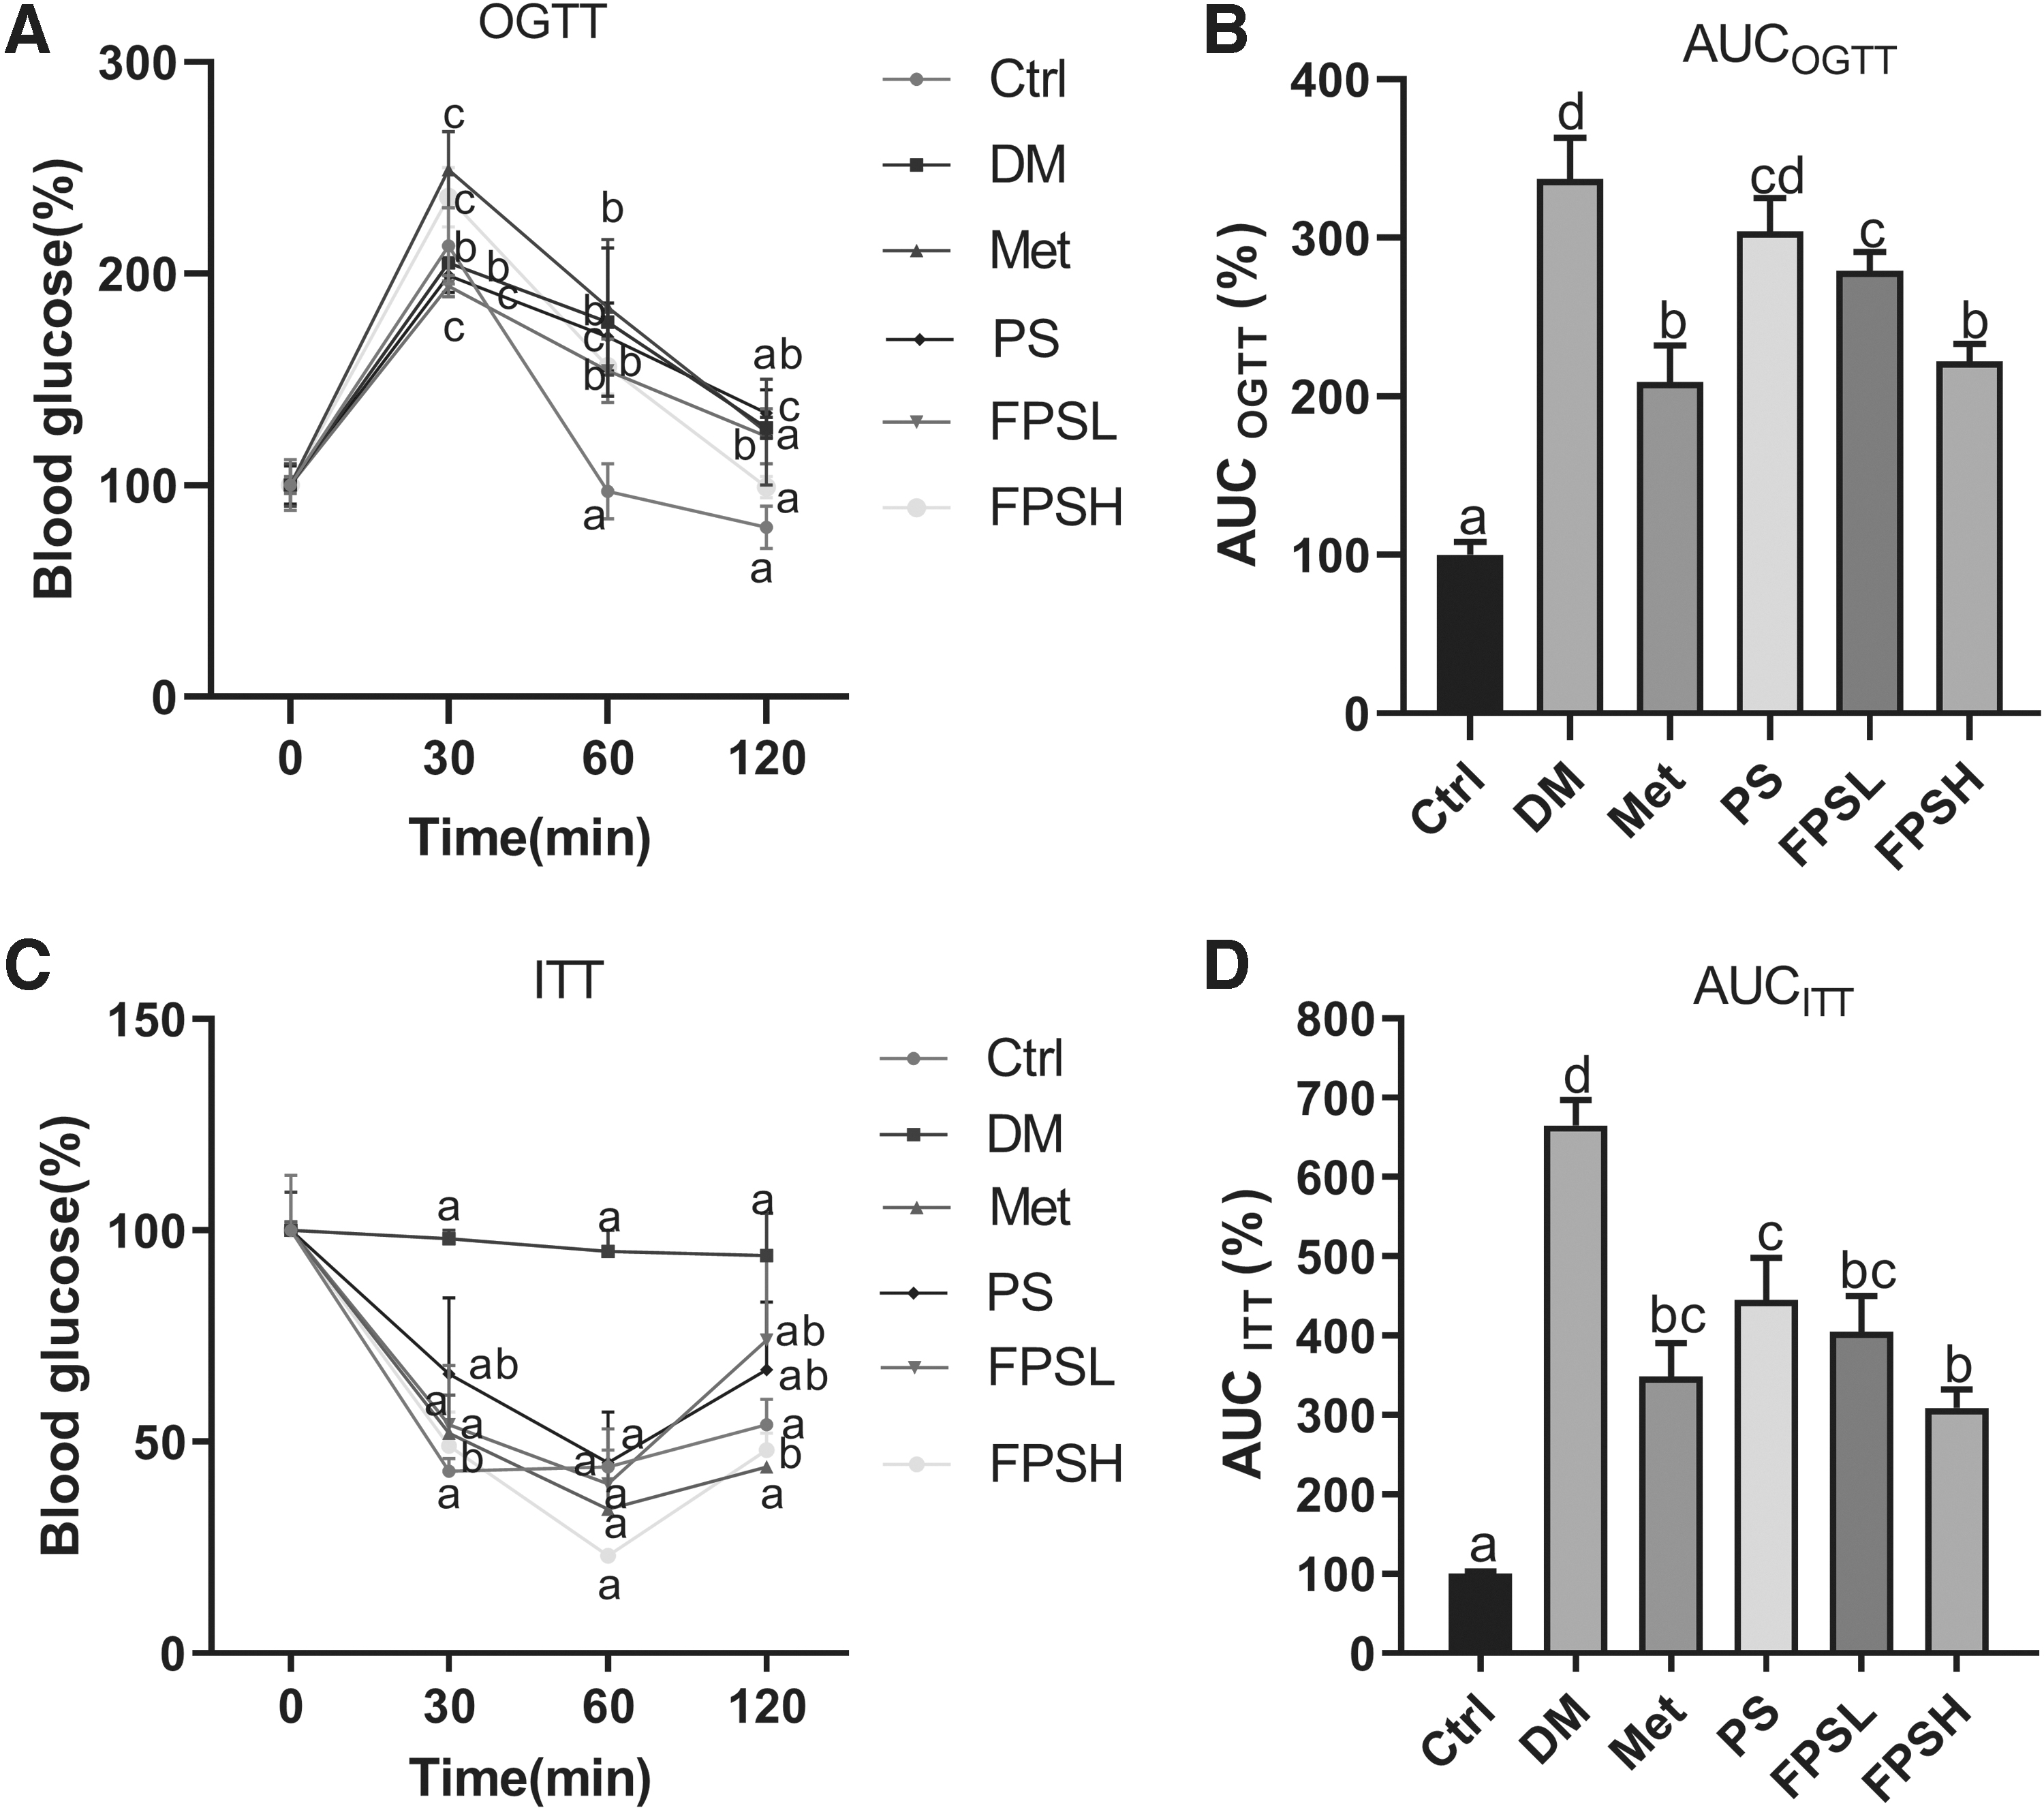
OGTT and ITT results on T2DM mice with different treatments.
C57BL/6 mice in the DM group also showed insulin resistance, since diabetic C57BL/6 mice retained high glucose level over the next 120 min after loading insulin (Fig. 1C). Oral treatment with a high dose of FPS produced a significant reduction of glucose in the blood at 120 min, showing a 48.94% decrease compared with diabetic C57BL/6 mice. Met, PS, or FPSH treatments reduced the AUC ITT values for ITT by 47.52%, 39.10%, and 53.53%, respectively, compared with the DM group (Fig. 1D). In conclusion, the FPS exhibited greater efficacy than PS on improving glucose tolerance and insulin sensitivity.
FPS supplement activated the PI3K/AKT signaling pathway
To further confirm the role of FPS in promoting insulin sensitivity in DM mice, the expressions of p-AKT and AKT were examined in the liver, skeletal muscle, and WAT. Compared with the Ctrl, the ratio of p-AKT/AKT decreased by 96.12% in the liver of DM mice (Fig. 2A, B). Upon Met-, PS-, or FPSH treatment, the ratio of p-AKT/AKT increased 9.20–12.89-folds in the liver as compared with DM mice. Next, we observed no significant difference in the ratio of p-AKT/AKT in the skeletal muscle samples between Ctrl and DM groups, but increased p-AKT/AKT level in DM mice with Met or FPSH treatment (Fig. 2A, C). In WAT, significantly decreased phosphorylation of AKT was observed in the DM group when compared with Ctrl, whereas decreased p-AKT/AKT was remarkably promoted only by a high dose of FPS or Met treatment (Fig. 2A, D). These data revealed that FPSH treatment improved insulin resistance based on activating the PI3K/AKT signaling pathway.

Effect of FPS on p-AKT expression in liver, skeletal muscle, and WAT.
FPS supplement inhibited lipid accumulation in the liver and WAT
The tissue index and H&E staining results are shown in Figures 3 and 4. The liver index of FPS-treated C57BL/6 mice did not change much compared with the diabetic C57BL/6 mice (Fig. 3G). Histological examination showed that the liver of DM mice exhibited obvious destructive changes, including enlarged nuclei, widespread lipid vacuoles, and scattered lymphocyte infiltration (Fig. 3B). The quantitative results revealed that the size of hepatocytes increased by six-folds in DM mice as compared with the Ctrl, whereas administration of FPSH reduced hepatocyte size to 34.82% (Fig. 3H). As can be seen from Figure 3I, after FPS treatment, most hepatocytes (59.62–83.06%) had sizes ranging from 100 to 500 μm2, with fewer cells in the higher ranges of greater than 1000 μm2, versus these from the DM mice.
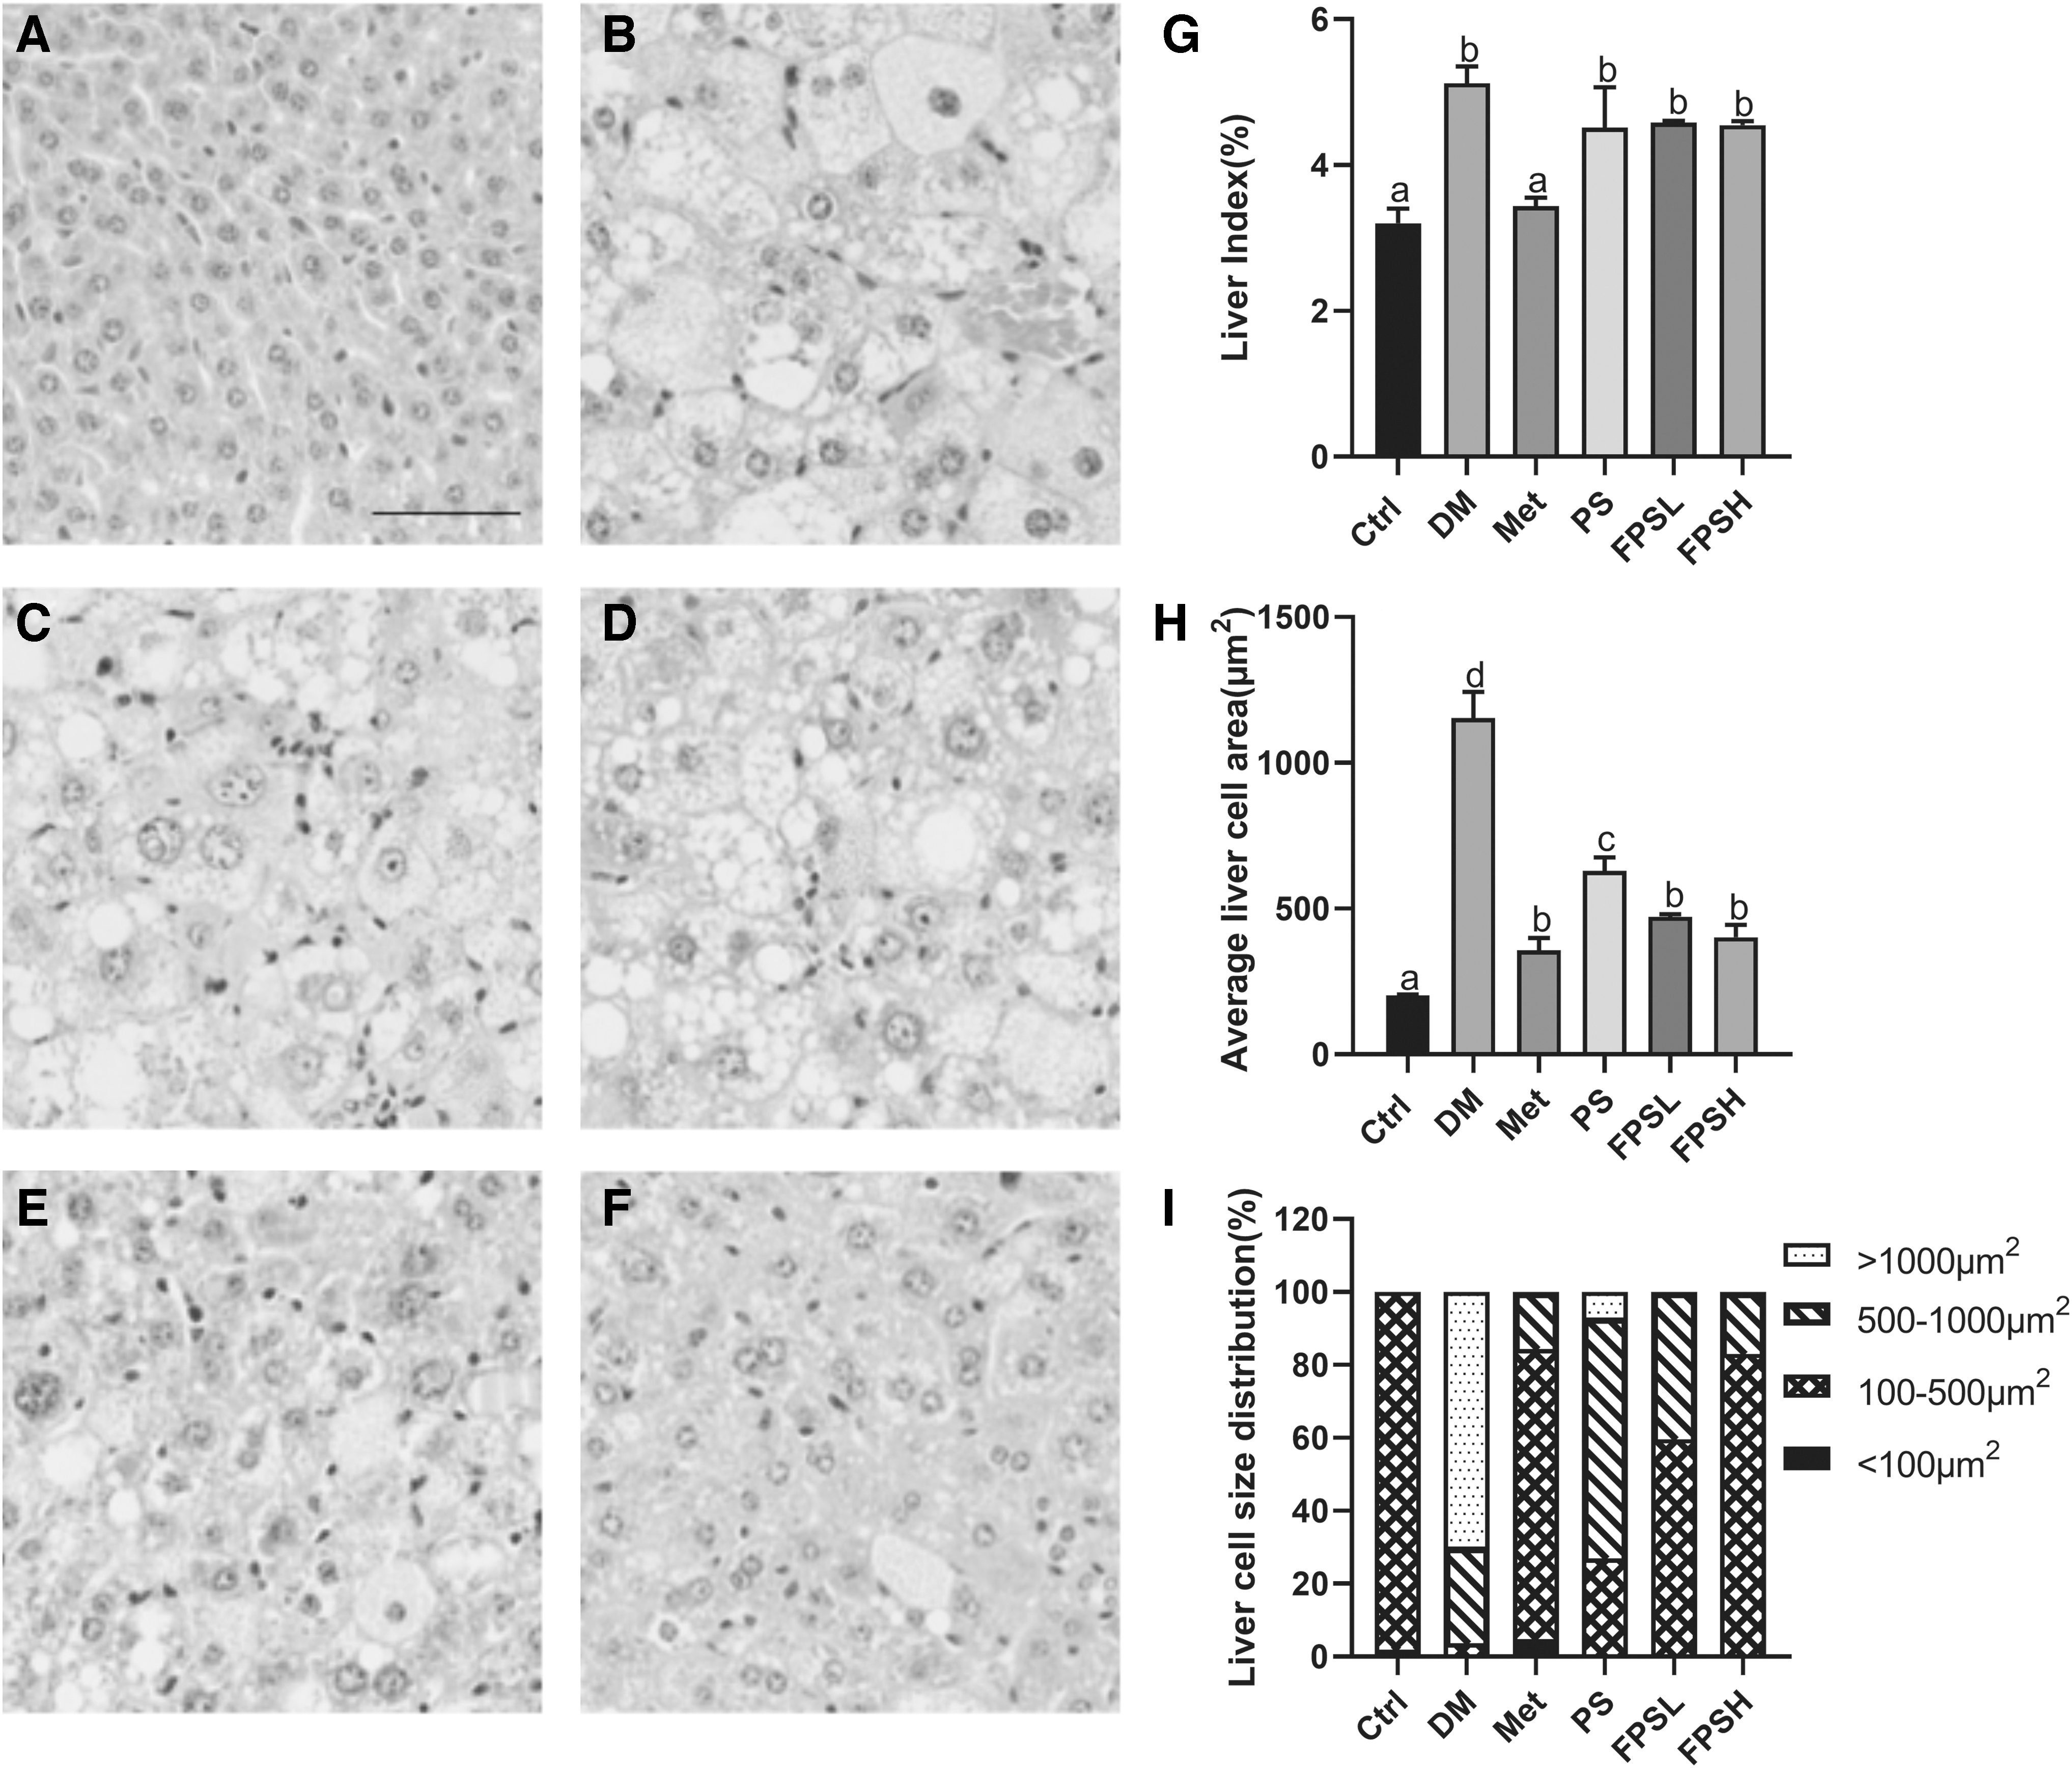
Effect of FPS on the histological morphology of mice liver by H&E staining (200 × ).
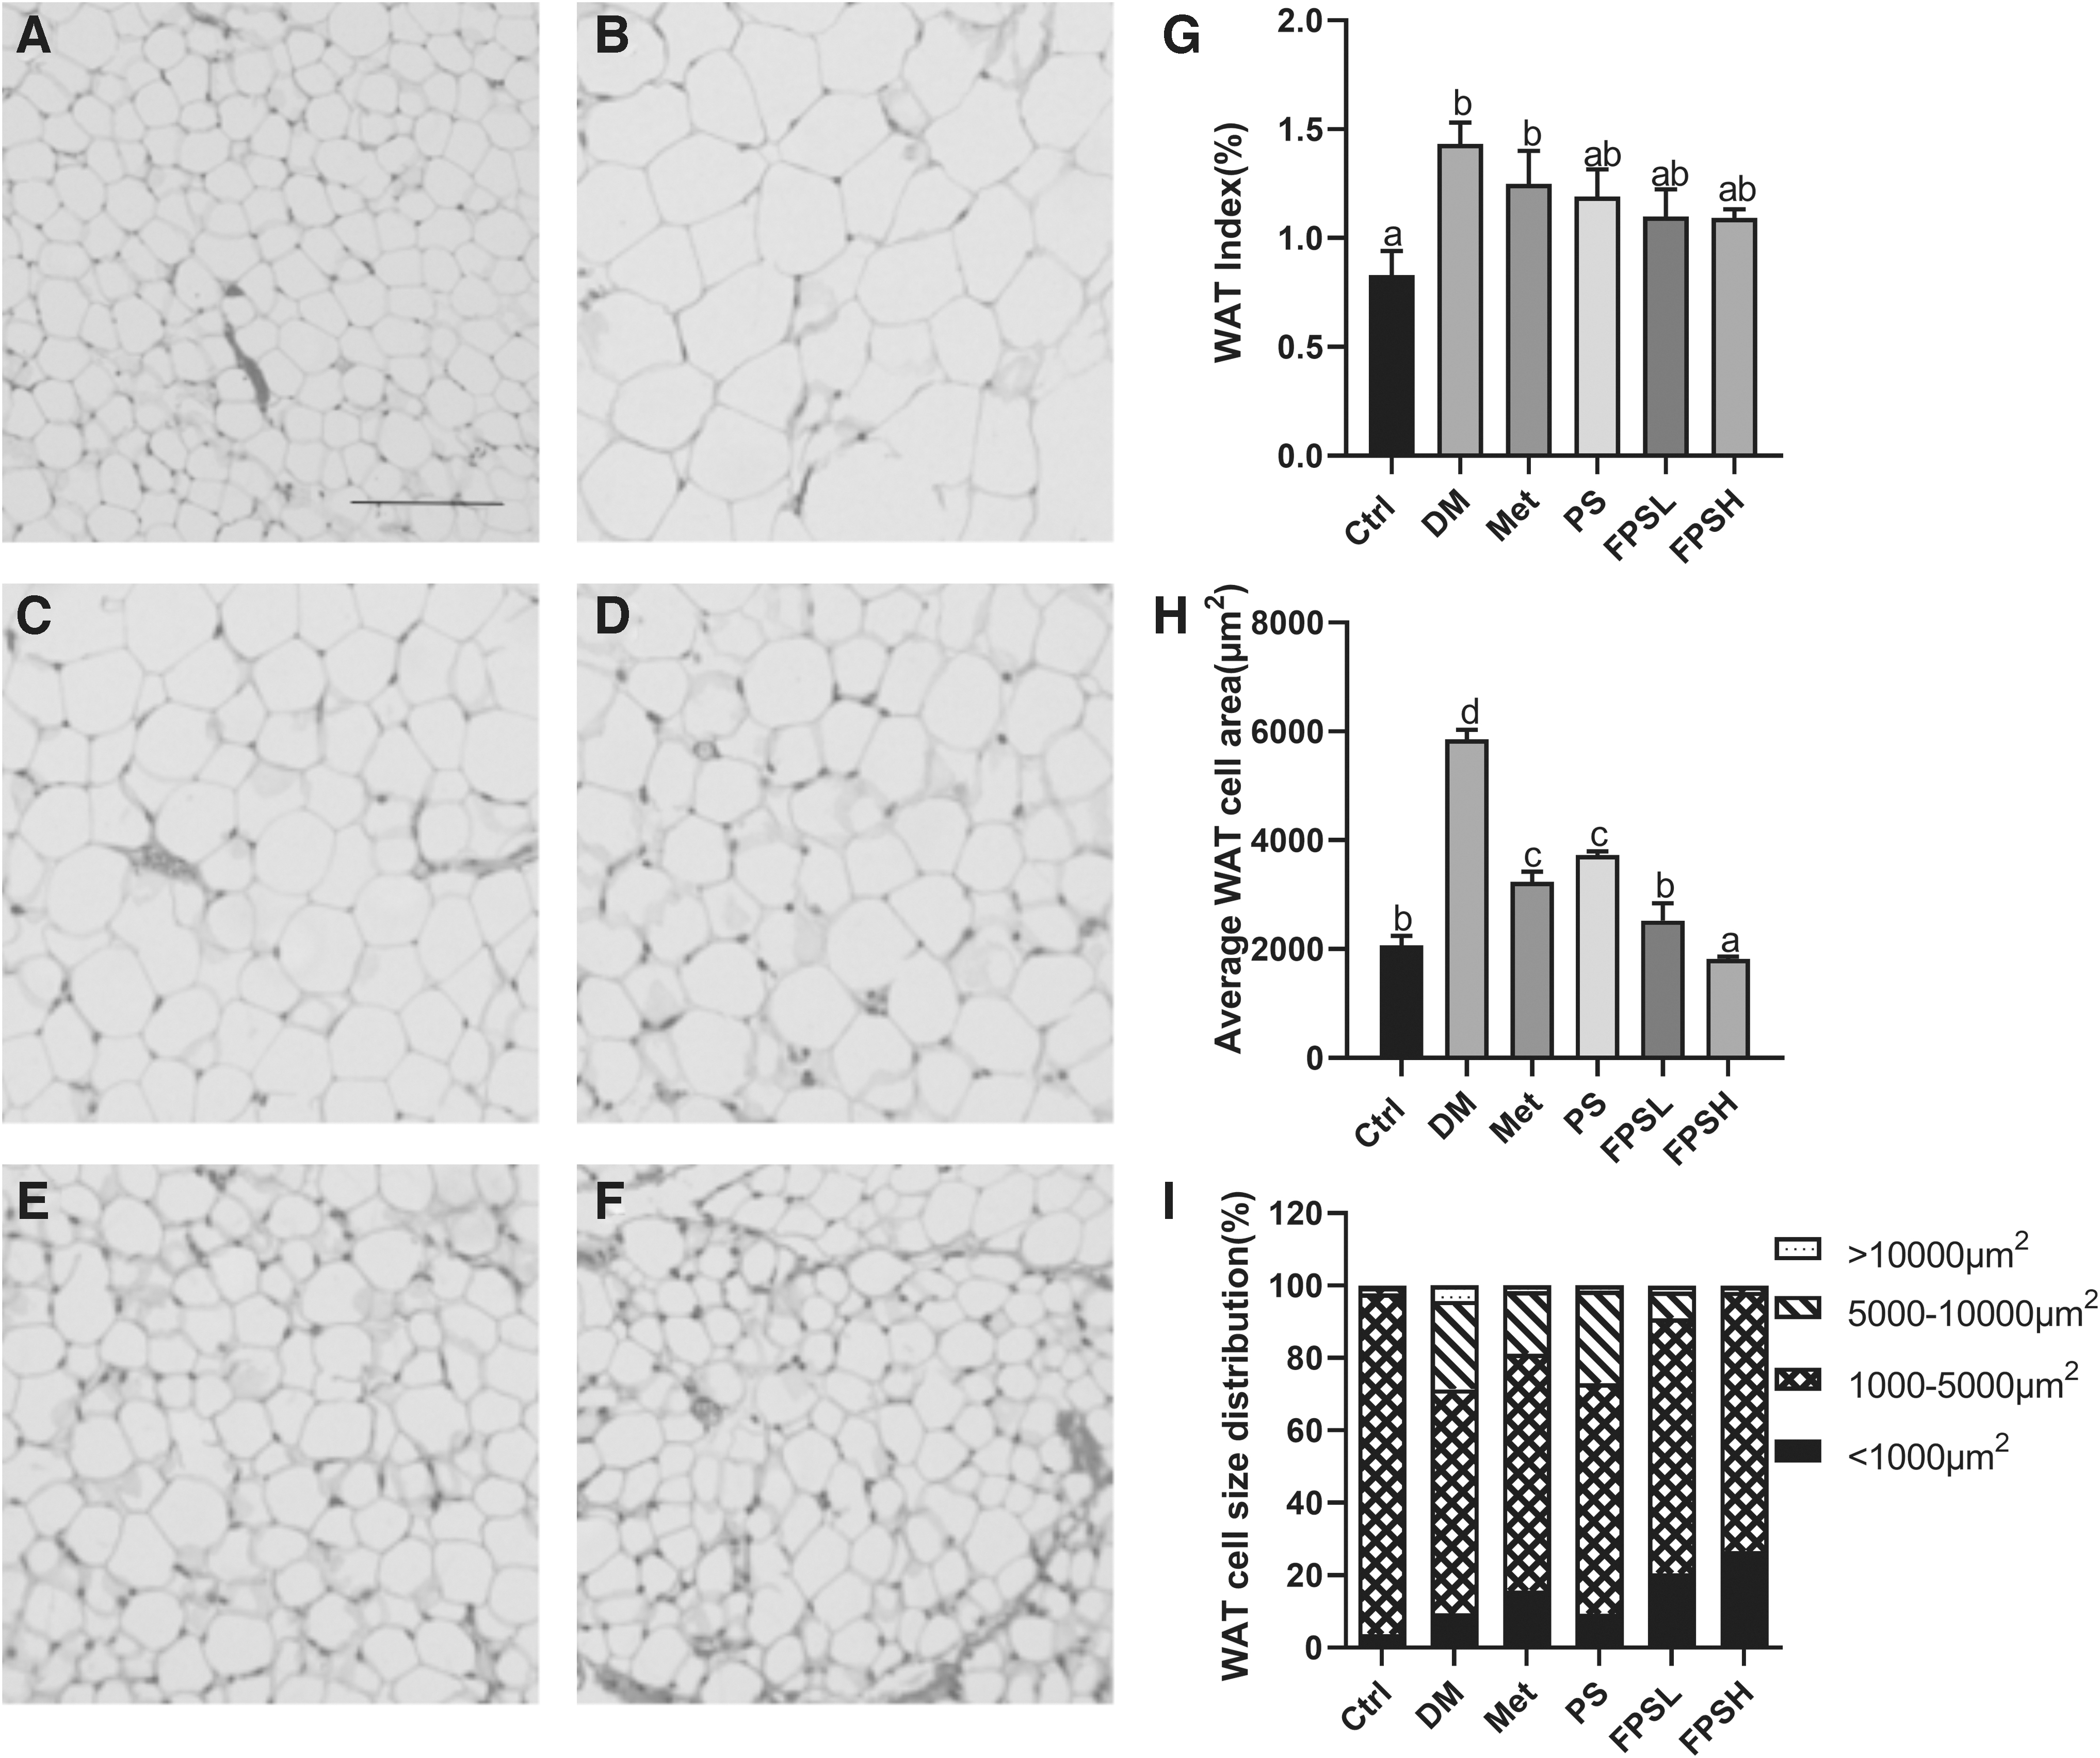
Effect of FPS on the histological morphology of mice WAT by H&E staining (100 × ).
Also, a decrease in the WAT index was observed in the FPSH group compared with the diabetes C57BL/6 mice group but did not reach statistical significance (Fig. 4G). H&E staining of WAT showed that adipocyte size in diabetes C57BL/6 mice was generally larger than that in Ctrl mice (Fig. 4A, B). Adipocyte size was 3-times smaller in 1 g/kg FPS-treated C57BL/6 mice than in diabetic control mice (Fig. 4H). As shown in Figure 4I, most adipocytes (70.44–71.55%) had sizes ranging from 1000 to 5000 μm2, with fewer cells in the higher ranges of >10,000 μm2, as compared with the DM mice. The above results showed a distinct lipid-lowering effect of FPS on DM mice.
FPS regulated lipid metabolism
To explore the effect of FPS on lipid metabolism in the liver and WAT, several critical genes related to lipogenesis and lipolysis were detected by real-time PCR. Overall, the hepatic expression of fatty acid synthase (Fas), stearoyl-CoA desaturase 1 (Scd1), and fat-specific protein 27 (Fsp27) related to lipogenesis was remarkably increased in the DM group by >6.97, 9.10, and 3.07-folds, respectively, when compared with the normal Ctrl (Fig. 5B–D). Feeding diabetic C57BL/6 mice with FPS significantly downregulated the expression of acetyl-CoA carboxylase (Acc), Fas, Scd1, and Fsp27 to 72.44%, 56.38%, 16.15%, and 5.86%, respectively, compared with DM mice (Fig. 5B–D). On the contrary, the hepatic expression of genes related to the lipid deposition was not altered much in diabetic conditions (Fig. 5F–I). But intervention with 1 g/kg FPS exhibited greater efficacy on upregulation of adipose triacylglyceride lipase (Atgl) and monoacylglycerol lipase (Magl) than PS.
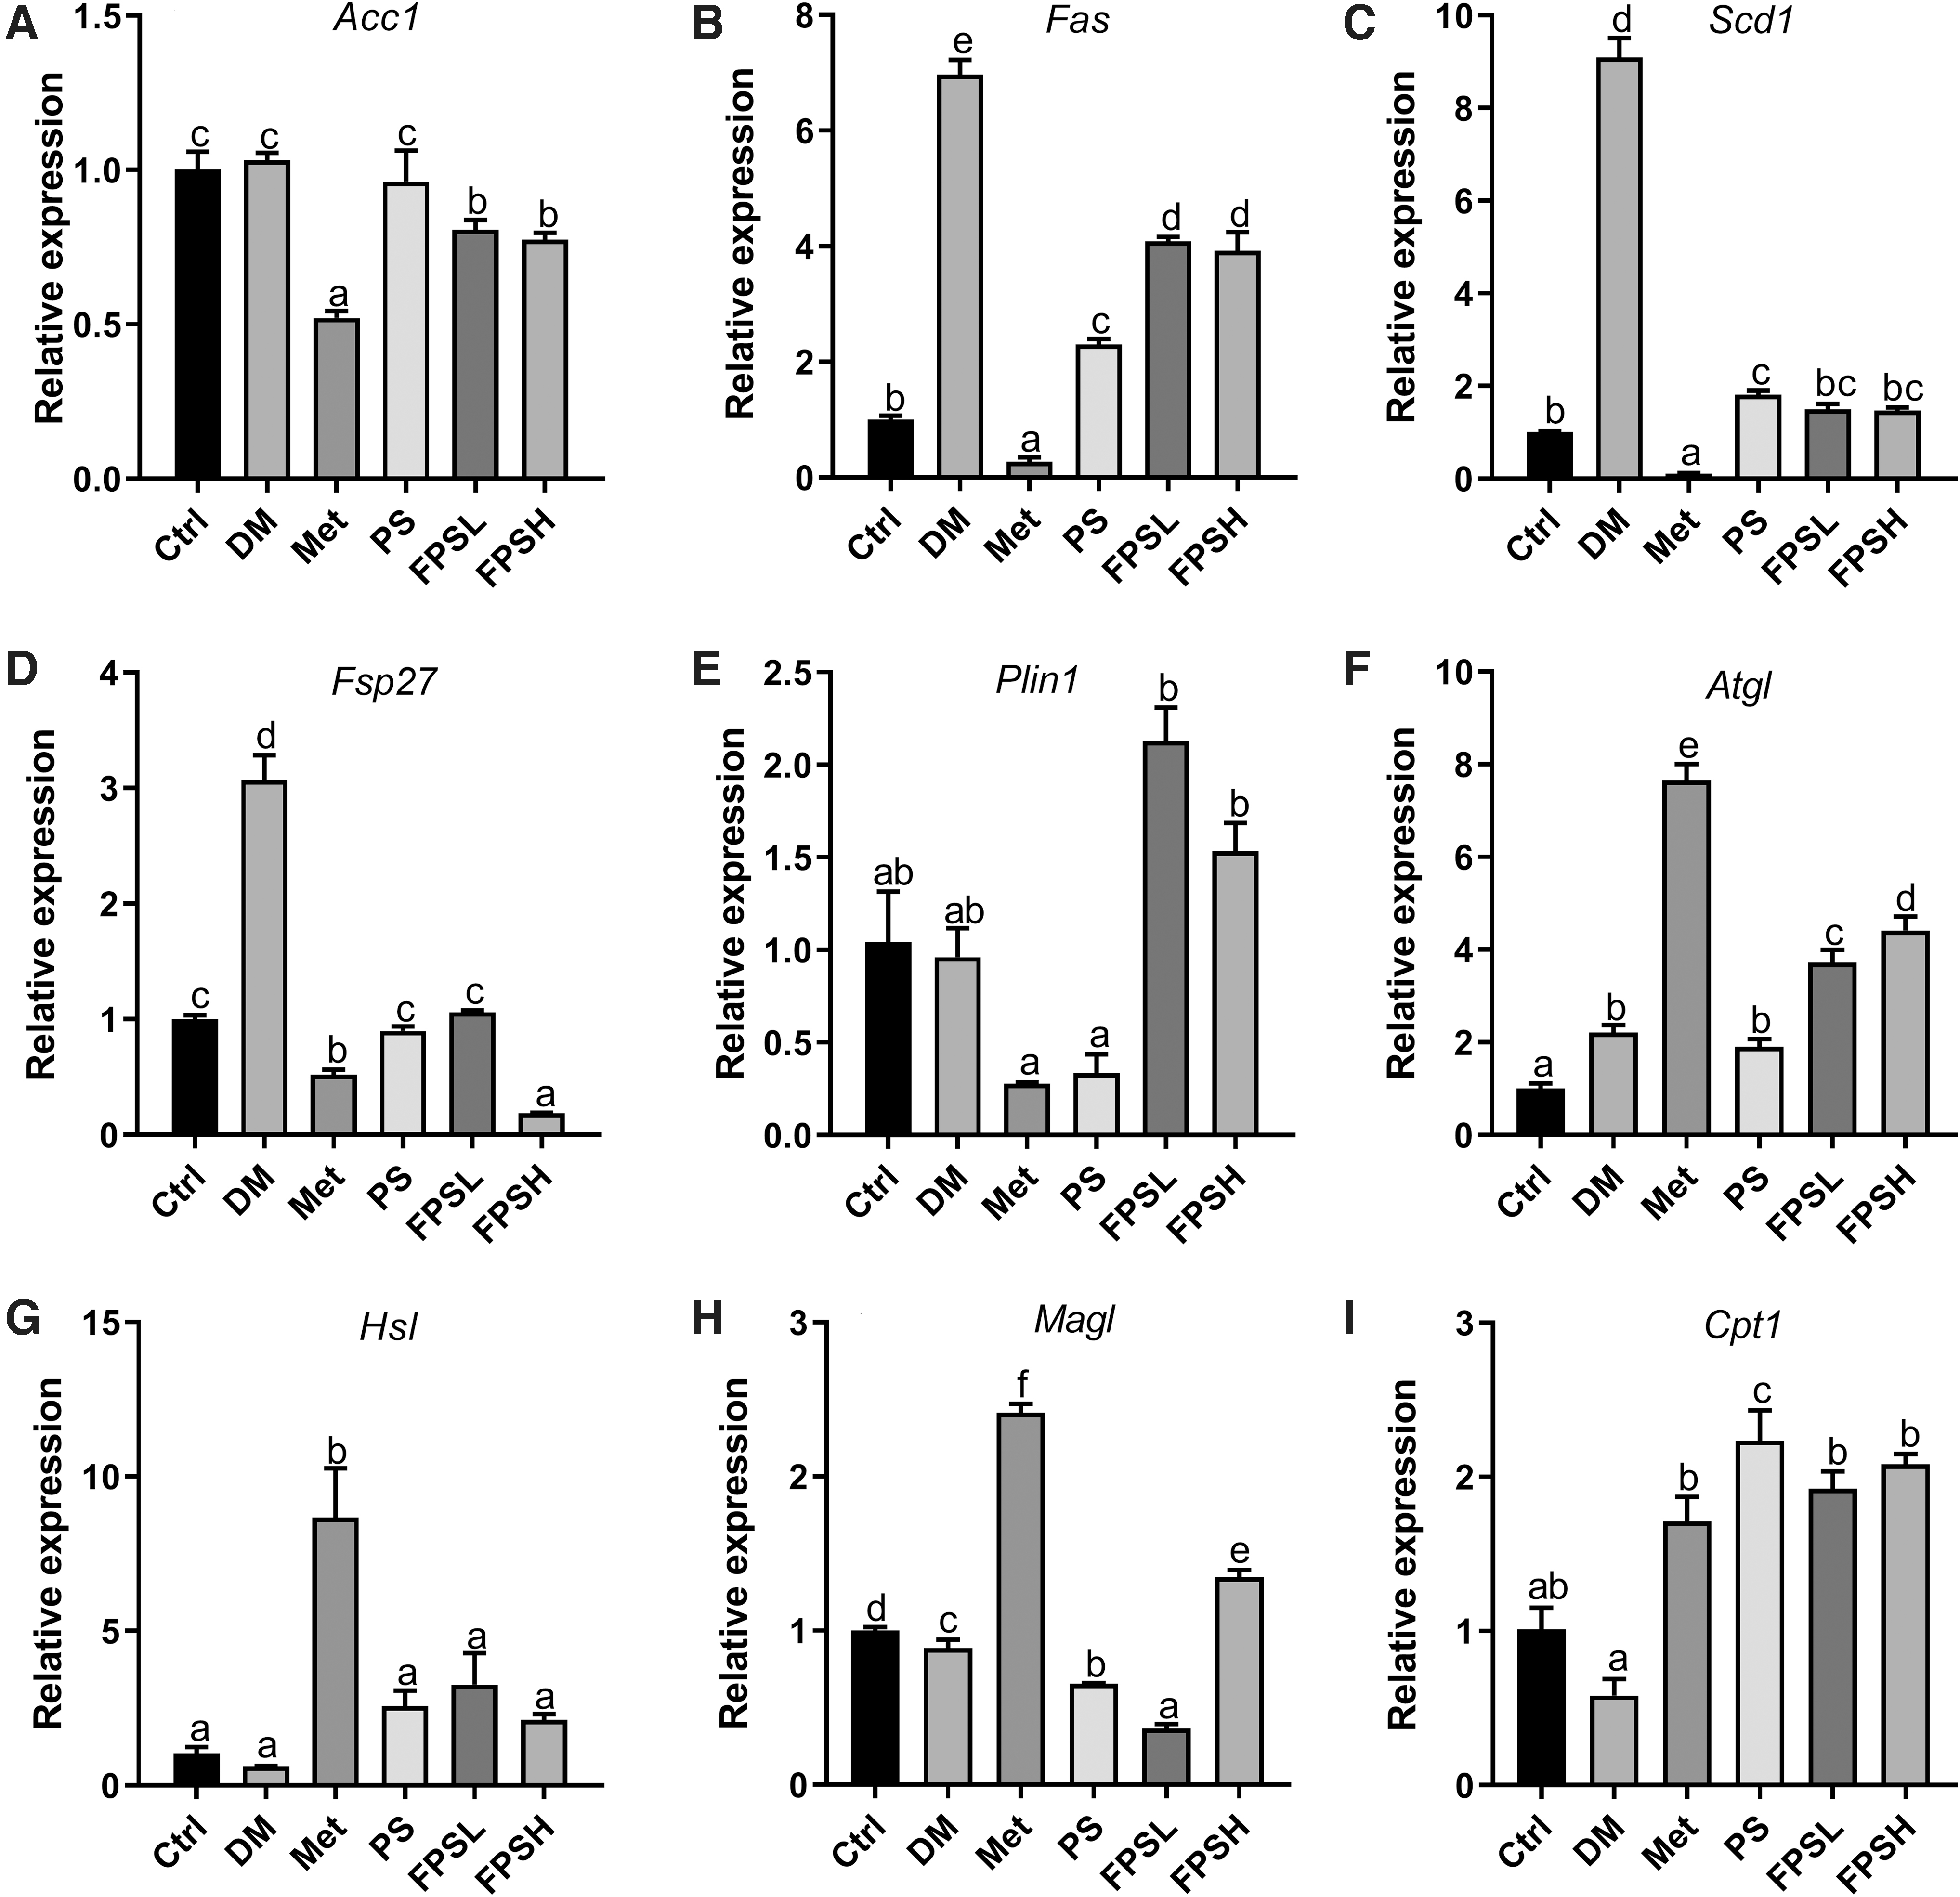
Expression of the genes associated with lipid metabolism in the liver. The expression of gene related to fatty acid synthesis
A stronger inhibition effect on lipid synthesis was observed in WAT after FPSH treatment. The expressions of Fas, Scd1, Fsp27, and Perilipin1 (Plin1) dropped to only 0.84%, 1.13%, 1.14%, and 5.65% by FPSH treatment compared with the diabetic C57BL/6 mice, respectively (Fig. 6B–E). Consistently, the expression of Atgl and carnitine palmitoyltransferase 1 (Cpt1) in WAT significantly increased in the FPSH group by 20.91 and 4.43 times in comparison with the DM group, much better than the PS treatment group (Fig. 6I). Thus, the mRNA expression profile suggests that dietary FPS ameliorated lipid accumulation by inhibiting lipogenesis and enhancing lipolysis.
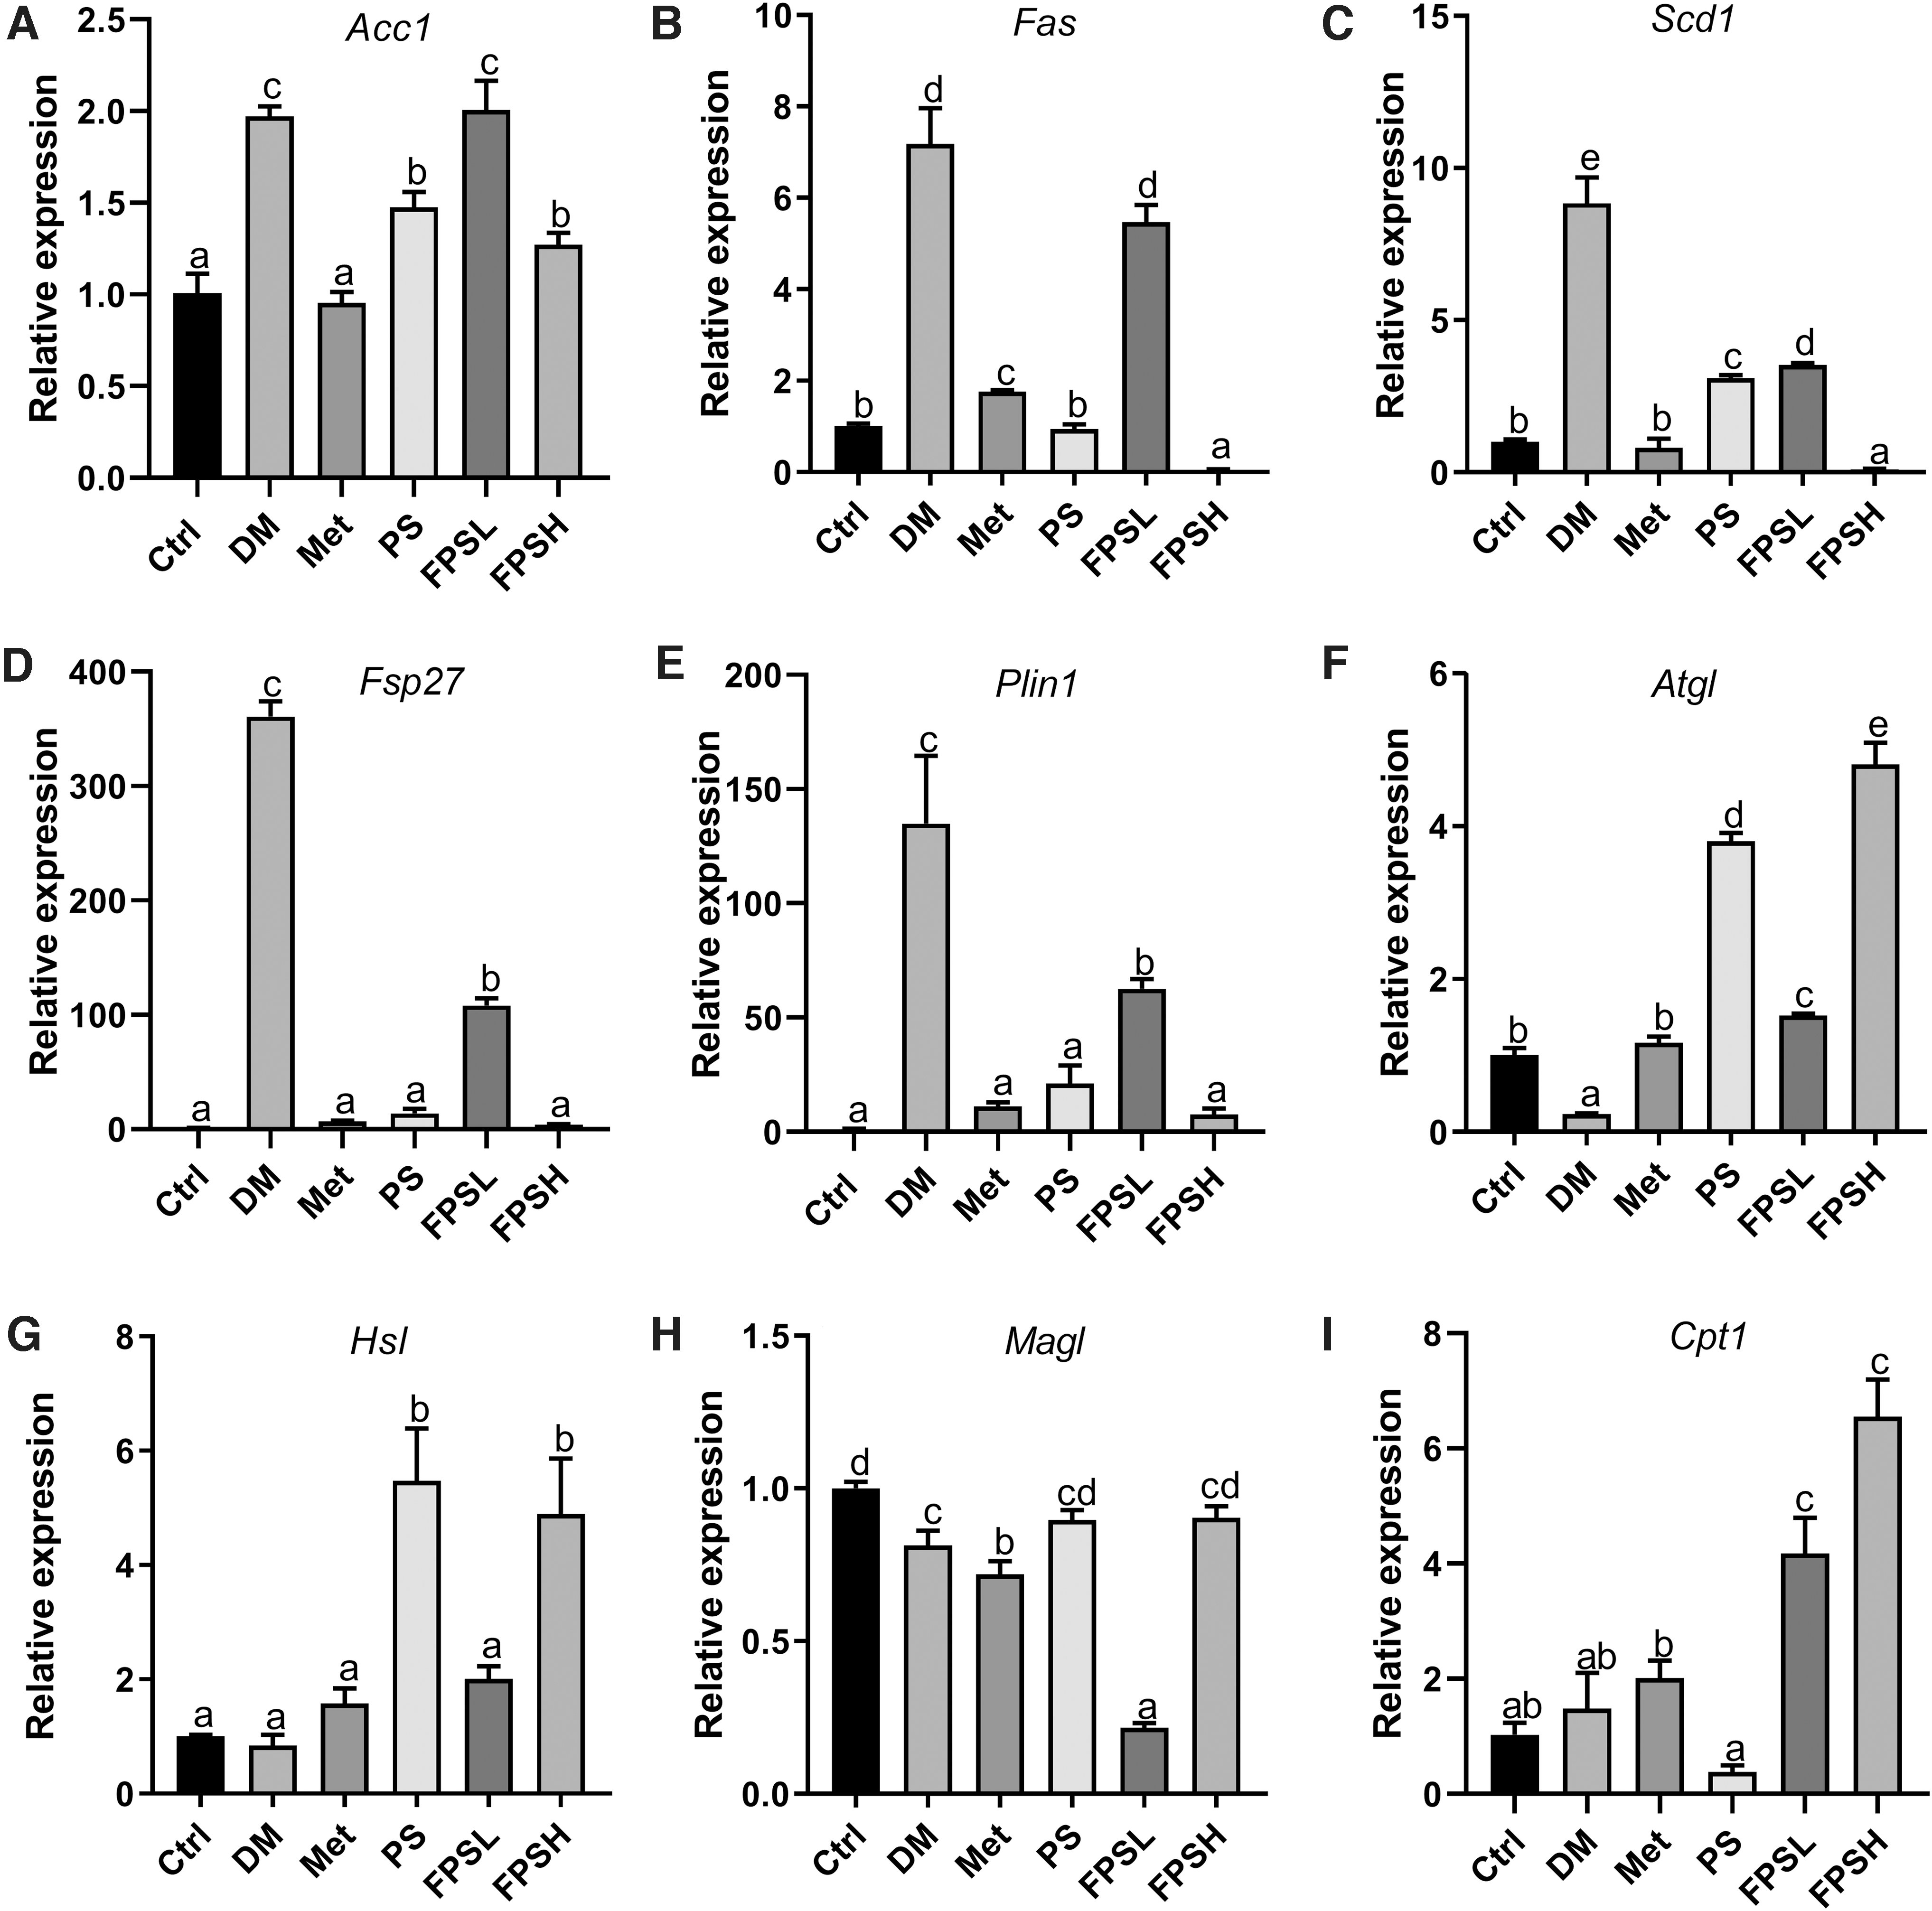
Expression of the genes associated with lipid metabolism in WAT. The expression of gene related to fatty acid synthesis
FPS reduced inflammation in T2DM mice
Next, the effect of FPS on the inflammatory response was assessed by quantitative real-time PCR. We observed that the interleukin 6 (Il-6), interleukin 1β (Il-1β), tumor necrosis factor-α (Tnf-α), and transforming growth factor-β (Tgf-β) levels were enhanced in the DM mice as compared with the Ctrl in the liver (Fig. 7A–D). Mice fed with1 g/kg FPS decreased the hepatic expression of Il-1β by 79.09% in comparison to DM mice (Fig. 7B). All treatment groups remarkably reversed the hepatic Tnf-α level when compared with the DM group (Fig. 7C). Whereas, FPS feeding groups did not alter the level of Il-6 and Tgf-β in the liver (Fig. 7A, D).
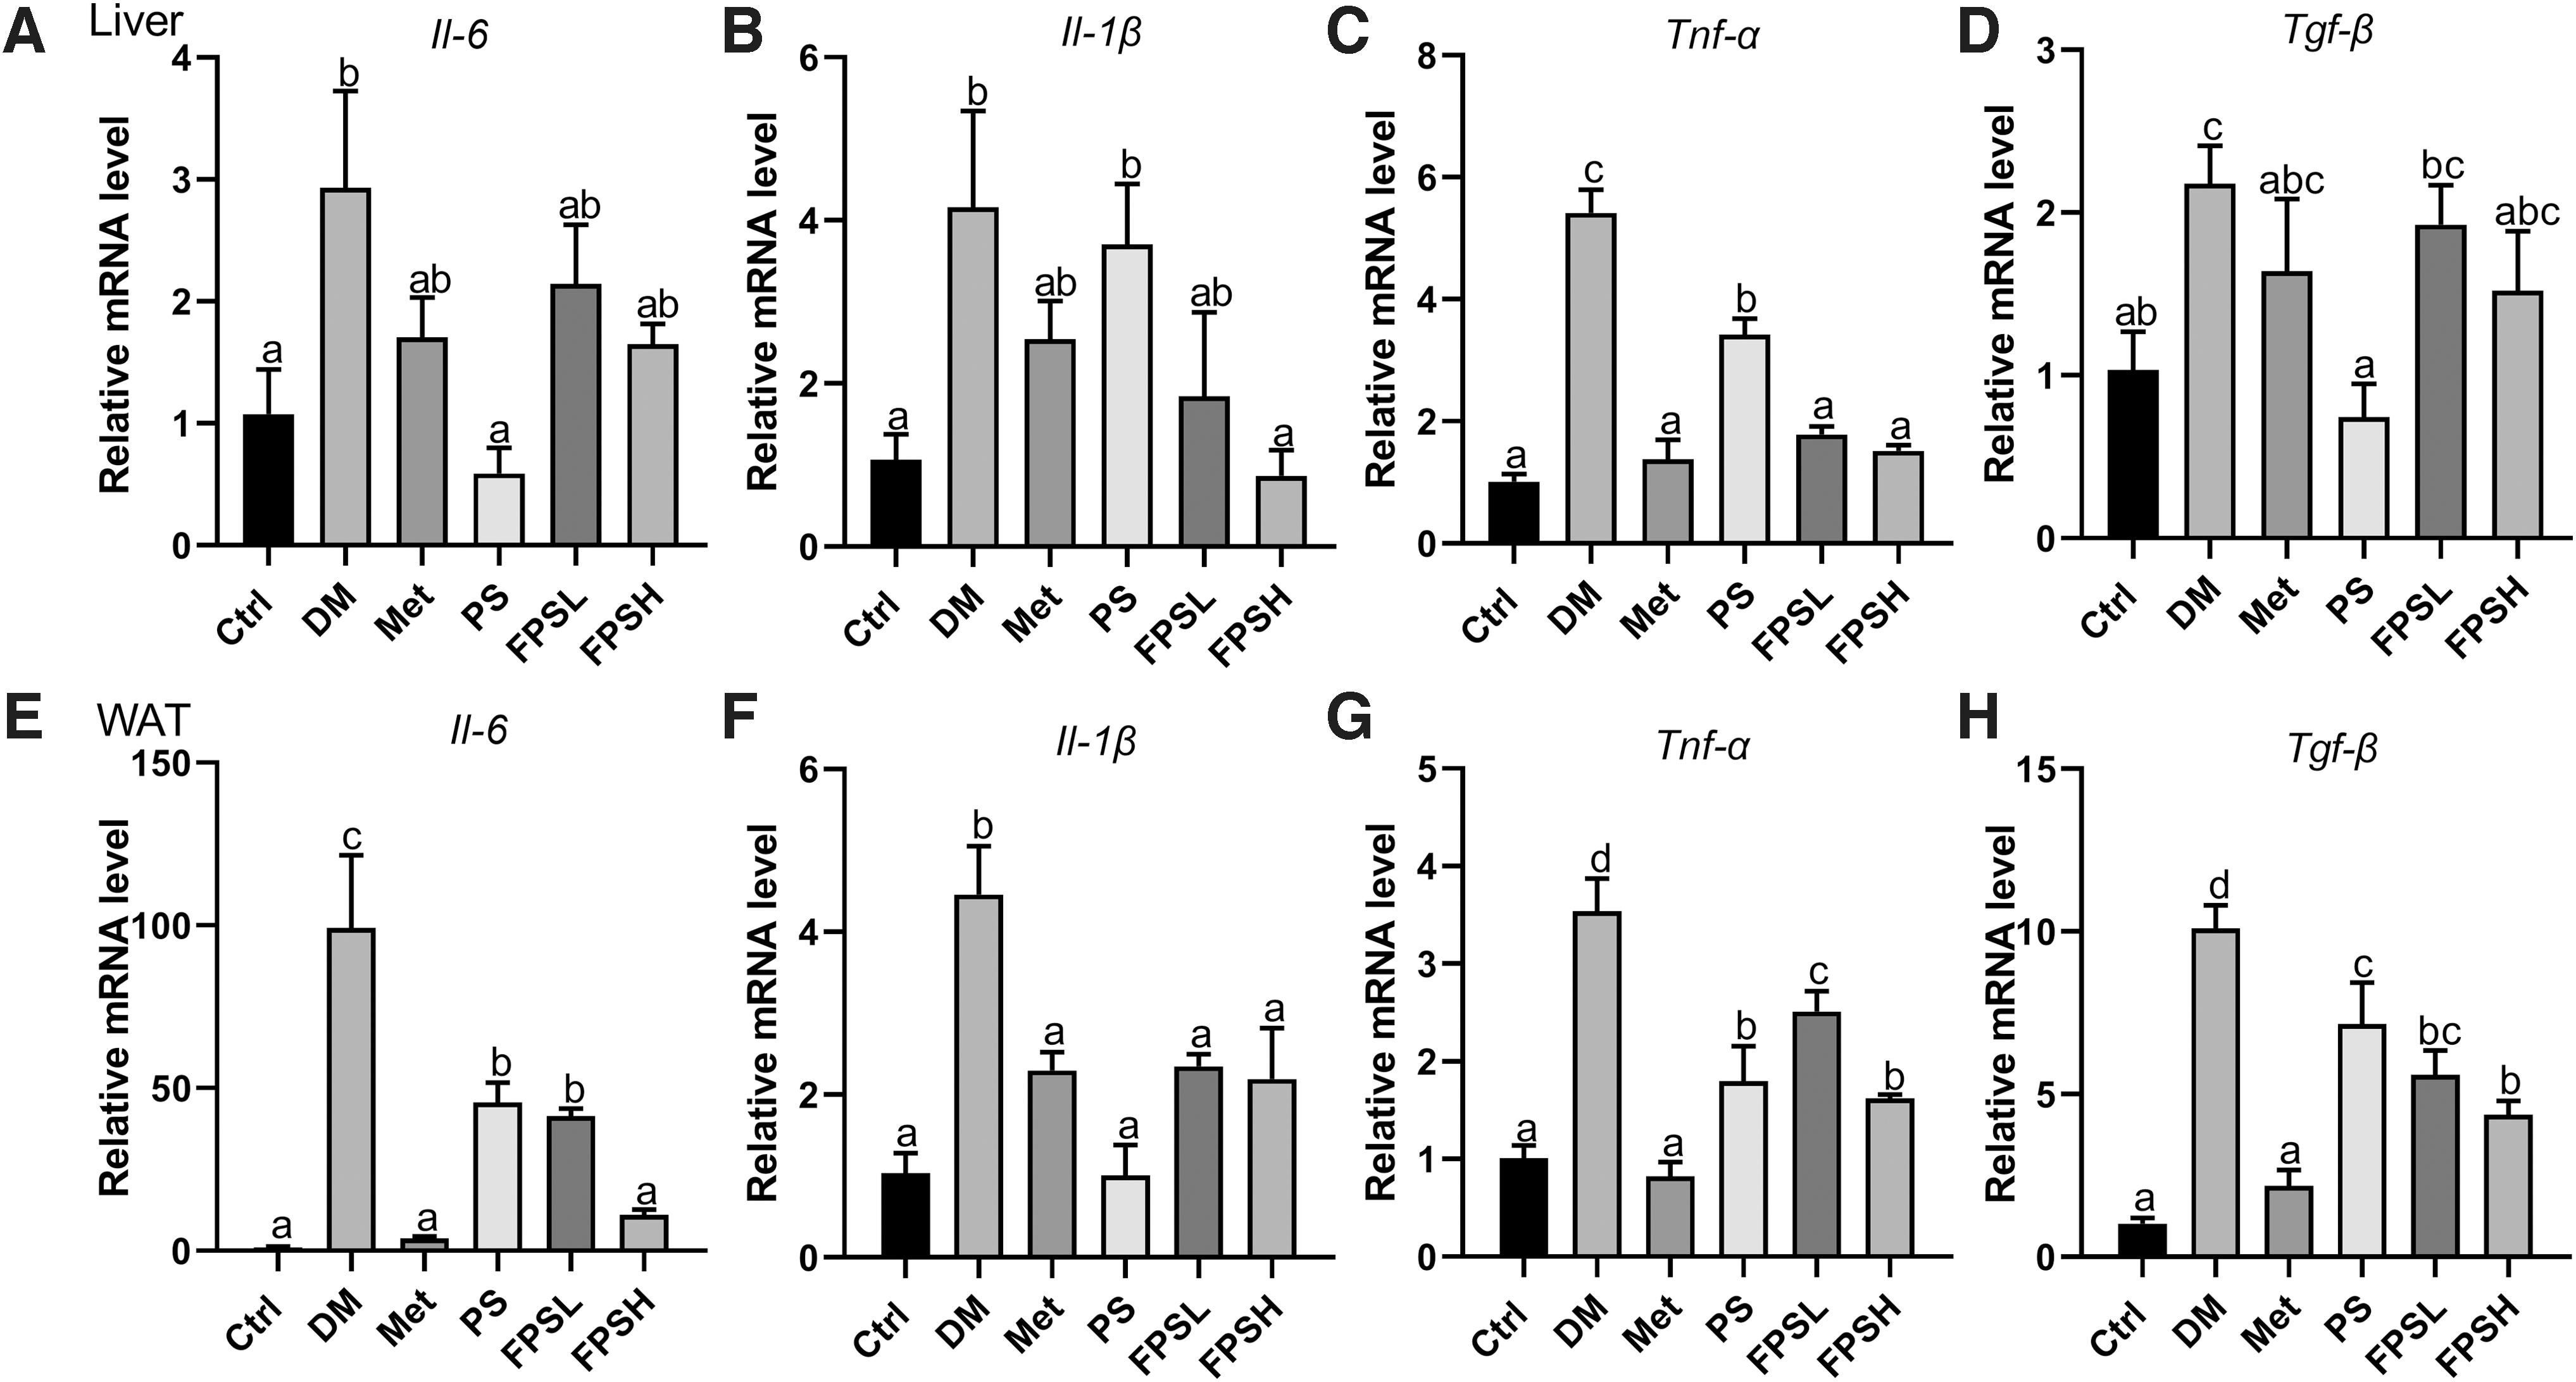
Effect of FPS on the expression of several inflammatory factors in liver and WAT. The relative mRNA level of Il-6, Il-1β, Tnf-α and Tgf-β in liver
Interestingly, FPS showed a profound anti-inflammatory effect in WAT. As expected, all the cytokines increased significantly in the DM group compared with the Ctrl group. Il-6 expression rocketed more than 95.34-folds in diabetic C57BL/6 mice, while gavaging mice with a high dose of FPS remarkably restored the Il-6 to one-tenth of the DM group (Fig. 7E). Besides, the mRNA level of the other three cytokines also reduced to 43.31–49.10% (Fig. 7F–H) in the FPSH group. In summary, FPS exerted a striking anti-inflammatory effect in the WAT of diabetic mice.
FPS enhanced the energy expenditure
Since AMPK is a critical signaling molecule involved in fatty acid oxidation, gluconeogenesis, and inflammation response, we next tested the phosphorylated AMPKα (p-AMPKα) and AMPK in the liver and WAT. As shown in Figure 8A and B, decreased hepatic AMPK phosphorylation was observed in the DM group, whereas FPSH treatment stimulated the p-AMPKα activation by 5.27-folds (Fig. 8A, B). In WAT, the phosphorylation of AMPK was severely inhibited in diabetic conditions. While after a long-term oral supplement of 1 g/kg FPS, the p-AMPK signaling was markedly increased, compared with the DM, Met, or PS group (Fig. 8C).
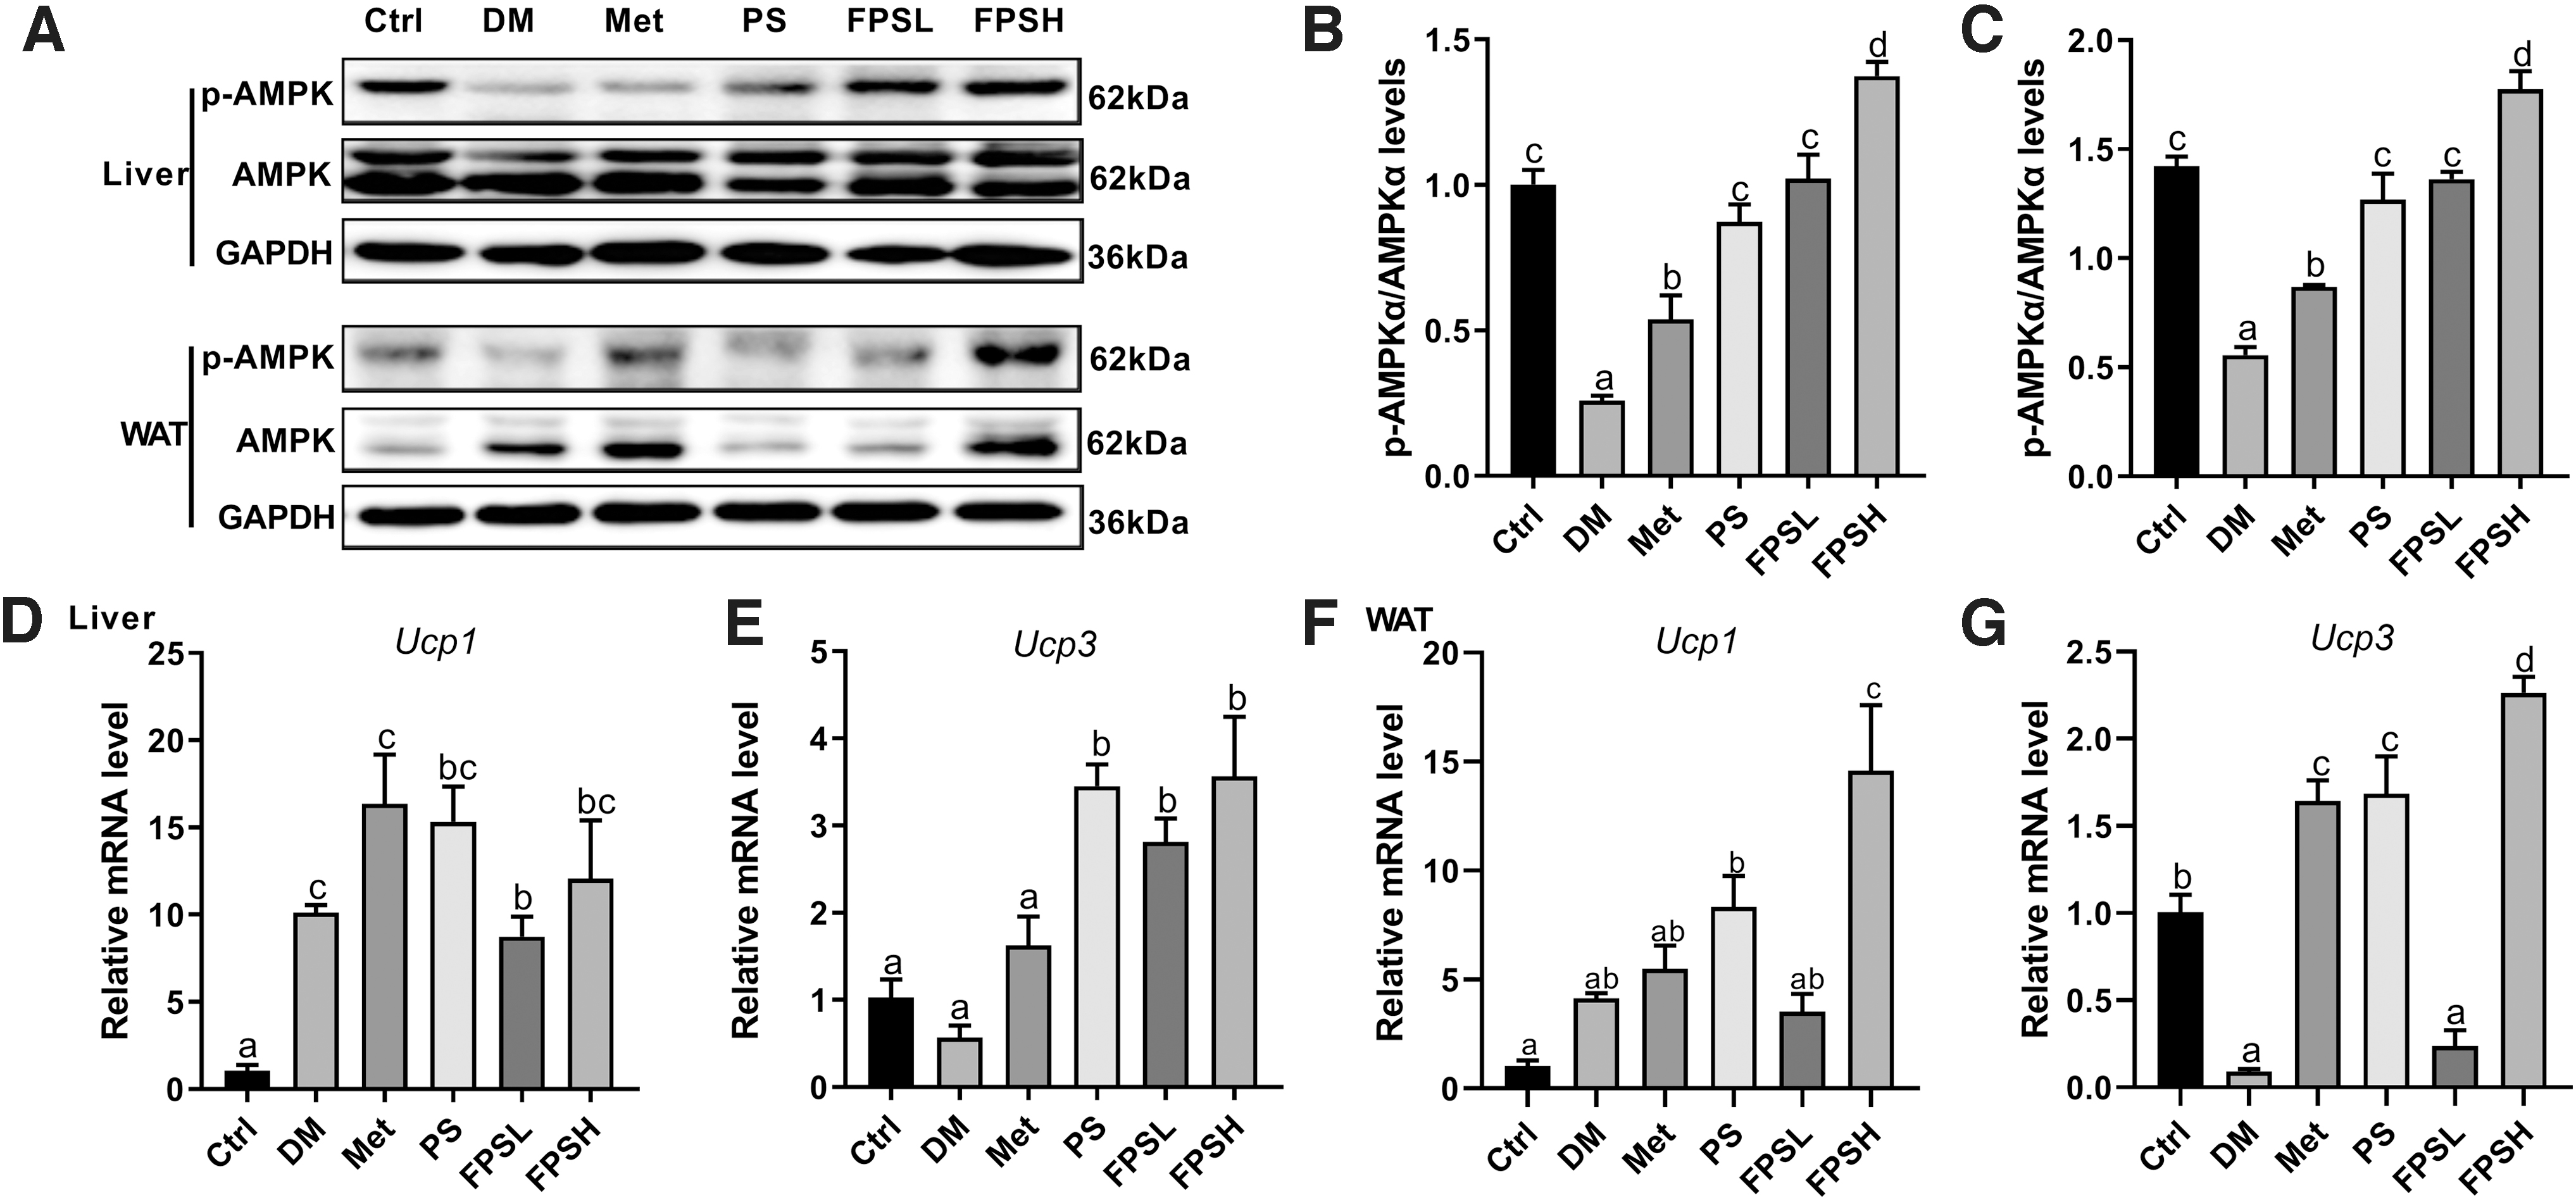
Effect of FPS on AMPK signaling and energy metabolism in liver and WAT.
Since AMPK was also believed in regulating energy homeostasis, FPS treatment was speculated to enhance the fundamental energy consumption. Thus, we tested the mRNA level of two uncoupling proteins: uncoupling protein 1 (Ucp1) and uncoupling protein 3 (Ucp3). Compared with the DM group, hepatic Ucp3 expression level from the FPSH group significantly increased by 6.25-folds (Fig. 8D, E). In WAT, Ucp1 and Ucp3 expression levels were 3.52 and 25.11-folds higher in the FPSH group than those in the DM group, respectively (Fig. 8F, G). Altogether, the above results indicated that FPS supplementation might enhance the energy expenditure through activation of AMPK and upregulation of uncoupling oxidative phosphorylation.
Discussion
T2DM is a common metabolic disease characterized by hyperglycemia and insulin resistance. Recently, plant-derived food with probiotics such as Lactobacillus has been widely tested to prevent the occurrence and development of T2DM and its complications. In this study, evidence from our study demonstrated that PS fermented with YM 1301 significantly alleviated the hyperglycemic and hyperlipidemic phenotype of diabetic C57BL/6 mice.
From the results of experiments, it can be concluded that FPS performed a significant antidiabetic effect. Except for the glucose- and insulin-lowering effects, supplement with FPS achieved a better result on reducing HOMA-IR and glycated hemoglobin versus the PS-treated group. OGTT and ITT results demonstrated that FPS treatment was more helpful in improving glucose tolerance and insulin sensitivity in DM mice, which was comparable to the Met treatment group. Later, we found an upregulated p-AKT level in the FPSH group. Since insulin-stimulated PI3K-AKT signaling leads to rapid translocation of the primary glucose transporter GLUT4 to the plasma membrane, it then triggers the glucose uptake process, we conclude that FPS treatment increase insulin sensitivity in the liver, skeletal muscle, and WAT.
Second, a striking lipid-lowering effect was observed on FPSH-fed diabetic C57BL/6 mice. Dairy consumption of FPSH significantly reduced TG and LDL in serum and inhibited the lipid accumulation in the liver and WAT. FPS significantly decreased Fsp27 expression and improved the level of Atgl and Magl, better than PS-treated cases in the liver. While in WAT, results exhibited overall changes in expression of Acc, Fas, Scd1, Fsp27, Plin1, Atgl, Hsl, and Cpt1 with FPS consumption. The equal reduction of Fsp27 and Plin1 was observed in both PS- and FPS-treated groups, which strongly supported the observation of small-sized fat cells since they were required to promote the lipid droplet fusion. 22,23 HSL is considered to be the major enzyme responsible for the hydrolysis of stored TG in adipose tissue. 24 We have shown that either FPS or PS treatment could increase the expression of Hsl and Atgl, which would result in the decomposition of TG to form diglycerol, monoglycerol, and finally free fatty acid.
FPS is likely to suppress the fat accumulation profoundly than PS by inhibiting the expression of Fas and Scd1, as well as enhancing the expression of Atgl in WAT. CPT1 and UCP1 were reported to promote FAs uptaken, 25 and enable heat production by uncoupling oxidative phosphorylation. 26 It is believed that FPS, not PS or Met, had an additive effect of stimulating fatty acid oxidation and heat production by improving the expression of Cpt1 and Ucp1 in WAT. 27
It is widely accepted that AMPK activity plays an important role in the regulation of carbohydrate and lipid metabolism. Activation of AMPK triggers GLUT4 translocation, increases glycolysis by enhancing phosphofructokinase 2 (PFK-2) expression, and inhibits glycogen synthesis (GS) by restricting GS expression. 28 Phosphorylated AMPK also inhibits hepatic fatty acid and VLDL synthesis by reducing the performance of SREBP. 29 Activation of AMPK was demonstrated to enhance the expression of CPT1 by inactivation of ACC1. 29 In the cholesterol synthesis pathway, AMPK inhibits the activity of HMG-CoA reductase and leads to decreased TC. 30 Data suggest FPS is a natural potent AMPK activator.
Besides, FPS tends to be more effective in improving glucose homeostasis by inhibiting the production of inflammatory factors, such as Il-1β and Tnf-α in the liver, as well as the Il-6 in WAT.
These findings indicate that FPS is a more potent alternative for reducing blood glucose, lipid accumulation, and inflammatory response. However, the current study still cannot fully clarify which component exactly strengthens the superior effect of FPS. Wang et al. declared that fermentation-induced improvement in diabetic Wistar rats from fermented carrot pulp with Lactobacillus plantarum NCU116 probably arises from the water-soluble polysaccharide, which had stronger hydroxyl radical scavenging activity. 31 Zhong and his colleagues attributed the glucose- and lipid-lowering effect of fermented blueberry to the organic and phenolic acids. 32
By previous studies, the percentage of PSP prominently increased after fermentation in our case, while the percentage of small saccharides decreased a lot. We speculated that PSP might be the key ingredient since PSP has been reported to be able to alleviate hyperglycemia by reducing oxidative stress and inflammatory responses in STZ-induced diabetic rats. 4,5,33 Phenolic compounds and their metabolites are also potential candidates since recent studies indicate that a combination of a few dietary polyphenols decreased lipid accumulation most effectively. 34 –36 Still, the underlying mechanisms for how FPS activates and phosphorylates the AMPK are not yet clear and warrant further investigation.
Footnotes
Author Disclosure Statement
No competing financial interests exist.
Funding Information
This work was supported by the National Key R&D Program of China (2018YFC1706500), the Natural Science Foundation of Shaanxi Province, China (2019JZ-12, 2017JM8009), and the Fundamental Research Funds for the Central Universities (GK201706008, 1301030122, 1301031898).
Supplementary Material
Supplementary Table S1