




Abstract
Excessive alcohol use often results in alcoholic liver disease (ALD). An early change in the liver due to excessive drinking is hepatic steatosis, which may ultimately progress to hepatitis, liver fibrosis, cirrhosis, and liver cancer. Among these debilitating processes, hepatic steatosis is reversible with the appropriate treatment. Therefore, it is important to find treatments and foods that reverse hepatic steatosis. Black carrot has antioxidant and anti-inflammatory effects. In this study, we examined the effectiveness of black carrot extract (BCE) on hepatic steatosis in in vivo and in vitro ethanol-induced liver injury models. For the in vivo experiments, serum aminotransferase activities enhanced by ethanol- and carbon tetrachloride were significantly suppressed by the BCE diet. Furthermore, morphological changes in the liver hepatic steatosis and fibrosis were observed in the in vivo ethanol-induced liver injury model, however, BCE feeding resulted in the recovery to an almost normal liver morphology. In the in vitro experiments, ethanol treatment induced reactive oxygen species (ROS) levels in hepatocytes at 9 h. Conversely, ROS production was suppressed to control levels and hepatic steatosis was suppressed when hepatocyte culture with ethanol were treated with BCE. Furthermore, we investigated enzyme activities, enzyme protein levels, and messenger RNA levels of alcohol dehydrogenase (ADH), cytochrome p450 2E1 (CYP2E1), and aldehyde dehydrogenase (ALDH) using enzyme assays, western blot, and quantitative reverse transcription–polymerase chain reaction analyses. We found that the activities of ADH, CYP2E1, and ALDH were regulated through the cAMP-PKA pathway at different levels, namely, translational, posttranslational, and transcriptional levels, respectively. The most interesting finding of this study is that BCE increases cAMP levels by suppressing the Pde4b mRNA and PDE4b protein levels in ethanol-treated hepatocytes, suggesting that BCE may prevent ALD.
INTRODUCTION
Heavy drinking often causes alcoholic liver disease (ALD). 1 An early change in the liver due to heavy drinking is hepatic steatosis, which often leads to hepatitis, liver fibrosis, cirrhosis, and liver cancer. 2 Among these debilitating processes, hepatic steatosis is reversible with the appropriate treatment. However, it is believed that the only way to treat the progression of ALD is to refrain from drinking. 3,4 Therefore, new pathophysiologically supported therapeutic or prophylactic treatment strategies are urgently needed.
Ethanol is normally metabolized to acetaldehyde by alcohol dehydrogenase (ADH) in the liver; however, excessive alcohol consumption induces hepatic microsomal cytochrome p450 2E1 (CYP2E1), an effective generator of reactive oxygen species (ROS). 5,6 Ethanol is further metabolized to acetic acid by hepatic mitochondrial aldehyde dehydrogenase (ALDH). It is known that alcohol or other substances suppress or promote the activity of these three enzymes. CYP2E1 is involved in alcohol metabolism, as well as in the production of ROS. Excessive production of ROS causes hepatocellular injury. Therefore, it is necessary to regulate the ROS levels. Furthermore, since ADH, CYP2E1, and ALDH jointly regulate alcohol metabolism, it is important to understand the regulatory mechanisms of these enzymes.
Our previous study showed that these alcohol metabolism-related enzymes were regulated in a cyclic adenosine 3′,5′-monophosphate (cAMP)-dependent manner after being treated with Ecklonia cava polyphenols. 7 Also, these phenomena were inhibited by the addition of H-89, a cAMP-dependent protein kinase inhibitor. 7 However, the regulatory mechanisms of the activities of ADH, CYP2E1, and ALDH and the involvement of cAMP in the expression of these three enzymes are not fully understood.
Black carrot (Daucus carota ssp. sativus var. atrorubens Alef.) was originally found in West- and Central-Asian countries. Anthocyanins, carotenoids, and phenolic acids 8,9 were identified as the major bioactive compounds of black carrot, all of which are known for their usefulness in promoting human health. 10,11 These compounds have been reported to protect metabolic syndromes through improving glucose tolerance, hypertension, and insulin resistance. 12 Anthocyanins, the major phenolic compounds, have also been shown to protect against various types of cancer. 13,14
In this study, we studied the effect of black carrot extract (BCE) for protection against ALD in an in vivo experimental system and the effect of BCE on ADH, CYP2E1, and ALDH activities in an in vitro ethanol-induced liver injury model. In addition, the effect of BCE on cAMP metabolism, especially on the expression of phosphodiesterase 4 (PDE4) was examined in hepatocytes treated with ethanol.
MATERIALS AND METHODS
BCE preparation
The powdered black carrot was extracted with 50% ethanol for 2 h. The solvent was concentrated by an evaporator, lyophilized to dryness, and the resulting powder was used as BCE. Fractionation of BCE was performed as follows: BCE dissolved in water was first fractionated with chloroform. The residue was fractionated with ethyl acetate and then butanol. Those fractions were evaporated and lyophilized until dry. The weights of powders of chloroform-extracted fraction (BCE-CHCl3), ethyl acetate-extracted fraction (BCE-AcOEt), butanol-extracted fraction (BCE-BtOH), and water-soluble fraction (BCE-water) obtained from 10 g of BCE were 0.2, 0.08, 2.54, and 7.55 g, respectively. The obtained powders were used as the fractionated samples.
Measurement of polyphenol content
The polyphenol content of BCE was measured using the Folin–Ciocalteu colorimetric method. 15 The BCE solution (0.25 mL), 1.25 mL of the phenol reagent (Fujifilm Wako Pure Chemical Co., Osaka, Japan) and 1.0 mL of 7.5% Na2CO3 were mixed. After 30 min incubation at room temperature, the absorbance at 760 nm was measured. Quantification was performed using the standard curve of gallic acid (0.03125–0.5 mg/mL). Total polyphenols were calculated as g/100 g gallic acid equivalents. All determinations were performed in triplicate.
Animals and experimental protocol
Animal experiments were conducted in compliance with the regulations of the Osaka City University Experimental Animal Committee (Permit No.: S0056). Twenty male Wistar rats (about 220 g body weight) obtained from Japan SLC, Inc., (Shizuoka, Japan) were grouped as follows, Group 1: control (C); Group 2: treated with ethanol and CCl4 (ET); Group 3: treated with CCl4 only (T); and Group 4: treated with ethanol, CCl4 fraction and fed 0.48% BCE diet (B). CCl4 (0.1 mL/kg body weight) was diluted to four-fold with olive oil. This concentration of CCl4 did not cause liver injury in the rats. 16 Rats were fed 5% ethanol ad libitum period 3 weeks and CCl4 was injected intraperitoneally twice a week. The morphological changes of livers in rats induced by 5% ethanol and CCl4 were similar to alcoholic cirrhosis in human. 17 –19 Blood was collected from the tail vein and abdominal vena cava. Livers were rinsed in 0.9% saline and fixed with formalin fixative for histological studies.
Biochemical assay of serum
The activities of aspartate aminotransferase (AST) and alanine aminotransferase (ALT) in serum were analyzed using the Transaminase CII Test Kit (Fujifilm Wako pure chemical Co.).
Histological analysis of liver
Liver specimens were stained with Hematoxylin and Eosin for the detection of hepatic steatosis, and Elastica van Gieson stain for the detection of hepatic fibrosis. Grouping of rats was blindly performed by a pathologist.
Hepatocyte culture
Hepatocytes were isolated using the collagenase perfusion method from male Wistar rats (about 300 g body weight). 20 Cell viability was measured using the Trypan Blue pigment exclusion method. The hepatocytes were incubated in Williams' E medium with 10% fetal bovine serum. After overnight incubation, the hepatocytes were incubated with 100 mM ethanol with or without BCE.
Cell viability
A neutral red assay 21 was used to measure cell viability. After medium removal, the hepatocytes were cultured with neutral red solution for 2 h and rinsed with 1% formaldehyde and 1% calcium chloride solution. Then neutral red was extracted from the hepatocytes for 30 min with 1% acetic acid and 50% ethanol solution. The absorbance of the extracted solution was measured at 540 nm using a spectrophotometer.
Measurement of cytotoxicity
Cytotoxicity was assayed using the Cell Counting Kit-8 (DOJINDO Molecular Technologies, Inc., Tokyo, Japan).
Lactate dehydrogenase activity
Lactate dehydrogenase (LDH) activity in the extracellular medium was measured. The medium was mixed with 3 mL of solution A (60 mM KH2PO4, 40 mM K2HPO4, and 5 mM sodium pyruvate) and 50 μL of solution B (15 μM NADH-Na and 200 μM NaHCO3), allowed to react for 3 min, and then the decrease in absorbance at 340 nm for 3 min using an ultraviolet (UV)-visible spectrophotometer.
ROS formation
ROS levels in the hepatocytes were measured according to the method as previously descibed. 18 Briefly, 5 μL of 2.4 mM 2′,7′-dichlorodihydrofluorescein diacetate was added to the medium 30 min before the end of incubation. After rinsing twice with PBS, a cover glass was adhered to the bottom of the culture dish. Subsequently, the hepatocytes were observed with a fluorescence microscope (LS101, Olympus Corporation, Tokyo, Japan). The ROS levels were quantified by measurement of fluorescence intensity by ImageJ software.
CYP2E1 activity
The cell lysate was centrifuged at 300 g at 4°C for 20 min. CYP2E1 activities were measured as the levels of p-nitrocatechol oxidized from p-nitrophenol according to the previously described method. 7
ADH and ALDH activities
ADH and ALDH activities were assayed according to the previously described method. 7 Assay solution (1.5 mL) contains 50 mM HEPES, 10 mM MgCl2, 1 mM DTT, 300 μM NAD+ plus 50 μL ethanol or acetaldehyde, respectively. The absorbance at 340 nm for 3 min was assayed using a UV-visible spectrophotometer.
Quantitative reverse transcription–polymerase chain reaction
Total RNA from hepatocytes was obtained using a commercial kit (High Pure RNA Isolation Kit, Roche, Mannheim, Germany). cDNA was synthesized using a commercial kit (PrimeScript™ RT Reagent Kit, TaKaRa Bio, Shiga, Japan). The quality of total RNA was assessed using an Agilent 2100 Bioanalyzer (Agilent, Tokyo, Japan). Quantitative reverse transcription–polymerase chain reaction (qRT-PCR) was performed using commercial real-time PCR reagent (iTaq Universal SYBR Green Supermix, Bio-Rad) on a Fast Real-Time PCR System (ABI 7500, Life Technologies). The primer sequences are shown in Table 1. The levels of mRNA expression were normalized to the housekeeping gene (β-actin). We used the StepOne software v2.2.2 (Thermo Fisher Sciences) for the ΔΔCt method.
The Sequence of the Primers
Western blot
Western blot was analyzed as previously described. 22 For the primary antibodies, an anti-CYP2E1 antibody and an anti-ALDH2 antibody were obtained from Enzo Life Sciences, Inc., NY, USA and Santa Cruz Biotechnology, Inc., TX, USA, respectively. An anti-ADH1 antibody and an anti-PDE4b were from Cell Signaling Technology, Inc., MA, USA. Biotinylated goat anti-rabbit immunoglobulin (DAKO, Denmark) was used for a secondary antibody. Then, horseradish peroxidase-coupled streptavidin (DAKO) was used to treat the membrane. The color development was measured by EZ West Lumi. The densitometric analysis of the protein bands was performed using the Densitograph Software Library CS Analyzer ver. 3.0 (ATTO Corporation, Tokyo, Japan).
Intracellular cAMP level
We used a commercial kit (DetectX® Direct Cyclic AMP Enzyme Immunoassay Kit, Arbor Assays Inc., MI, USA) to measure intracellular cAMP levels.
Statistical analysis
Data are expressed as the mean ± standard error of the mean or mean ± standard deviation. Statcel3 (OMS Publishing Inc., Tokorozawa, Japan) was used for the data analysis. The Tukey–Kramer method was employed for multiple comparisons. Statistically significant differences were shown as P < .05 or P < .01.
RESULTS
Effect of BCE treatment on serum AST and ALT activities in rats
The activities of serum AST and ALT were measured to determine the effect of BCE on liver damage (Table 2). The activities of AST and ALT in rats treated with ethanol and CCl4 (ET) were increased approximately three and eight folds, respectively, comparable to control rats (C). On the other hand, the activities of AST and ALT in rats treated with CCl4 only (T) were comparable to those of the (C) group. Moreover, the activities of AST and ALT in rats treated with ethanol, CCl4, and fed 0.48% BCE diet (B) were decreased to less than those in the (ET) group significantly.
Effect of Black Carrot Extract on Serum Aspartate Aminotransferase and Alanine Aminotransferase activities in Ethanol- and CCl4-Treated Rats
Data are presented as the mean ± SE (n = 5).
P < .05 compared with Control group.
P < .05 compared with ET group.
B, ethanol- and CCl4 (0.1 mL/kg of body weight)- and 0.48% BCE diet-treated group; BCE, black carrot extract; C, control group; ET, ethanol- and CCl4 (0.1 mL/kg of body weight)-treated group; SE, standard error; T, CCl4 (0.1 mL/kg of body weight)-treated group.
Effect of BCE treatment on liver steatosis and fibrosis
Histological analysis using Hematoxylin and Eosin staining was used to evaluate hepatic steatosis. No fat accumulation in hepatocytes was observed in the liver of (C) and (T) groups. In the (ET) group, hepatic steatosis was clearly observed. However, hepatic steatosis was significantly suppressed in group (B) (Fig. 1A). Elastica van Gieson staining was performed to evaluate the progression of liver fibrosis. We did not observe any histological abnormalities in the livers of the (C) and (T) groups, whereas significant liver fibrosis was observed in the (ET) group. However, when BCE was administered, no such liver fibrosis was observed in the (ET) group (Fig. 1B).
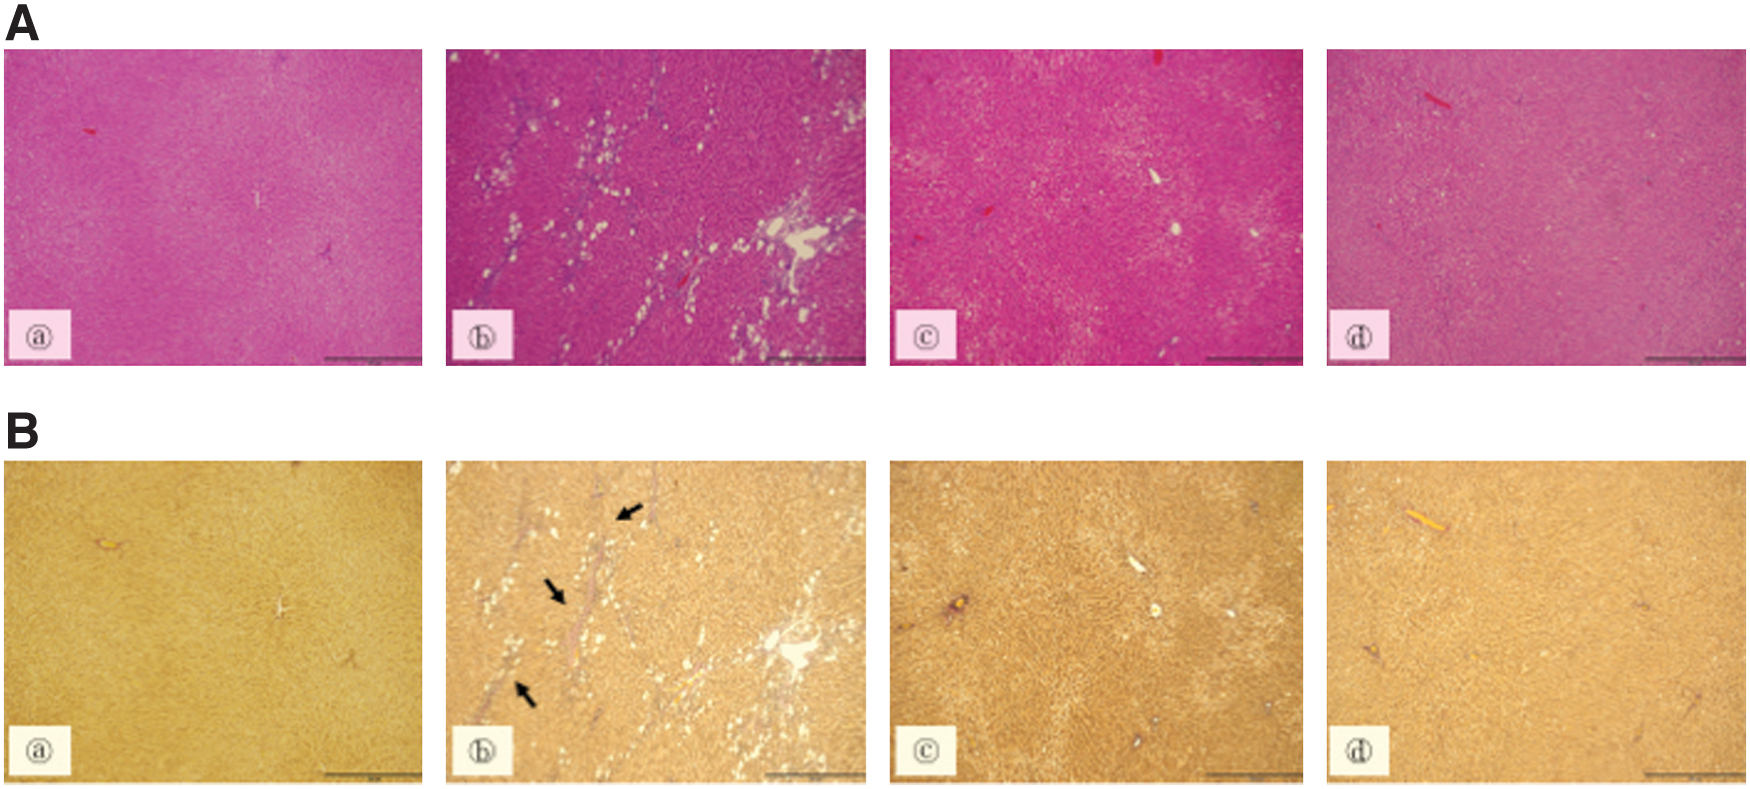
Changes in liver morphology revealed by Hematoxylin and Eosin
Effect of BCE on the cell viability
We reported previously that significant cell death was observed in hepatocytes treated with greater than 100 mM ethanol. 17 The blood ethanol concentration after excessive drinking ranges from 100 to 200 mM. 23,24 Therefore, hepatocytes were cultured with 100 mM ethanol with or without BCE (100–800 μg/mL). Cell viability after treatment with 100 mM ethanol was decreased significantly, however, the addition of 800 μg/mL BCE restored viability to the control level (Table 3). BCE (0–800 μg/mL) was added to the medium of hepatocytes to test cytotoxicity potential of BCE. Cell viability did not change up to a concentration of 800 μg/mL BCE, suggesting that BCE up to 800 μg/mL is not toxic to hepatocytes (Table 4).
Effect of Black Carrot Extract on the Cell Viability of Ethanol-Treated Hepatocytes
Hepatocytes were incubated with 100 mM ethanol with or without various concentrations of BCE. Cell viability was measured using the neutral red assay as described in the Materials and Methods section. Data are presented as mean ± SD of five experiments.
P < .05 compared with Control.
P < .01 compared with 100 mM ethanol.
SD, standard deviation.
Effect of Black Carrot Extract on the Cell Viability
Hepatocytes were incubated with various concentrations of BCE. Cell viability was measured using the neutral red assay as described in the Materials and Methods section. Data are presented as mean ± SD of five experiments.
Effect of BCE fractions on cell viability
The effect of BCE fractions on cell viability was investigated using the amount corresponding to the amount of each fraction contained in 800 μg BCE. The corresponding amounts for BCE-CHCl3, BCE-AcOEt, BCE BtOH, and BCE-water were 16, 6.4, 200, and 600 μg, respectively. BCE-BtOH and BCE-water fractions were measured using higher and lower than those quantities. However, BCE-CHCl3 and BCE-AcOEt fractions were toxic to hepatocytes when used in higher quantities, so we measured using only lower quantities.
As shown in Table 5, the addition of BCE-BtOH restored the cell viability after treatment with ethanol dose dependently, and the cell viability of the hepatocytes with 400 μg/mL added BCE-BtOH was almost the same level to that of control. Therefore, we used BCE-BtOH in subsequent experiments. We measured cell viability to determine whether cytotoxicity occurred by BCE-BtOH. Cell viability did not change up to a concentration of 400 μg/mL BCE-BtOH, suggesting that BCE-BtOH within 400 μg/mL is not toxic to hepatocytes (Table 6). On the other hand, we examined the relationship of polyphenol content and cell viability.
Effect of Various Fractions of Black Carrot Extract on the Cell Viability of Ethanol-Treated Hepatocytes
Hepatocytes were incubated with 100 mM ethanol with or without various fractions: chloroform fraction (BCE-CHCl3), ethyl acetate fraction (BCE-AcOEt), butanol fraction (BCE-BuOH), and water fraction (BCE-water). Cell viability was measured using the neutral red assay as described in the Materials and Methods section. Data are presented as mean ± SD of five experiments.
P < .05 compared with Control.
P < .01 compared with EtOH.
Effect of BCE-BuOH on the Cell Viability
Hepatocytes were incubated with various concentrations of BCE-BuOH. Cell viability was measured using the neutral red assay as described in the Materials and Methods section. Data are presented as mean ± SD of five experiments.
The polyphenol content in each fraction was analyzed by the Folin–Ciocalteu method 15 and found to be 11.6 ± 0.1%, 46.0 ± 1.8%, 11.4 ± 1.8%, and 4.8 ± 0.3%, for BCE-CHCl3, BCE-AcOEt, BCE-BtOH, and BCE-water, respectively. These results showed that the amounts of polyphenols are not related with the cytoprotective effect.
Effect of BCE-BtOH on ethanol-induced cytotoxicity
The ethanol induced-hepatocyte cytotoxicity and the protective effect of BCE-BtOH against ethanol were examined using the Cell Counting Kit-8. Significant decrease (P < .01) in cytotoxicity was observed at 24 h after ethanol addition, whereas no cytotoxicity was observed in ethanol- and BCE-BtOH-treated cells (Fig. 2A).

Cytotoxicity induced by ethanol and the protective effect of BCE-BtOH. Hepatocytes were cultured for 24 h with 100 mM ethanol with or without 400 μg/mL BCE-BtOH. Cytotoxicity was assessed by using the Cell Counting Kit-8
To measure cytotoxicity of EtOH and BCE-BtOH, LDH activity in the extracellular medium was also examined. The addition of EtOH significantly (P < .01) increased LDH activity, but the activity in ethanol- and BCE-BtOH-treated cells decreased to that in the control cells (Fig. 2B).
Effect of BCE-BtOH on ROS formation
ROS levels in the hepatocytes were examined with 2′,7′-dichlorodihydrofluorescein diacetate. ROS levels at 9 h were significantly (P < .01) increased in ethanol-treated hepatocytes. However, ROS levels in the hepatocytes treated with both ethanol and BCE-BtOH did not increase but remained near the level of control hepatocytes (Fig. 3).
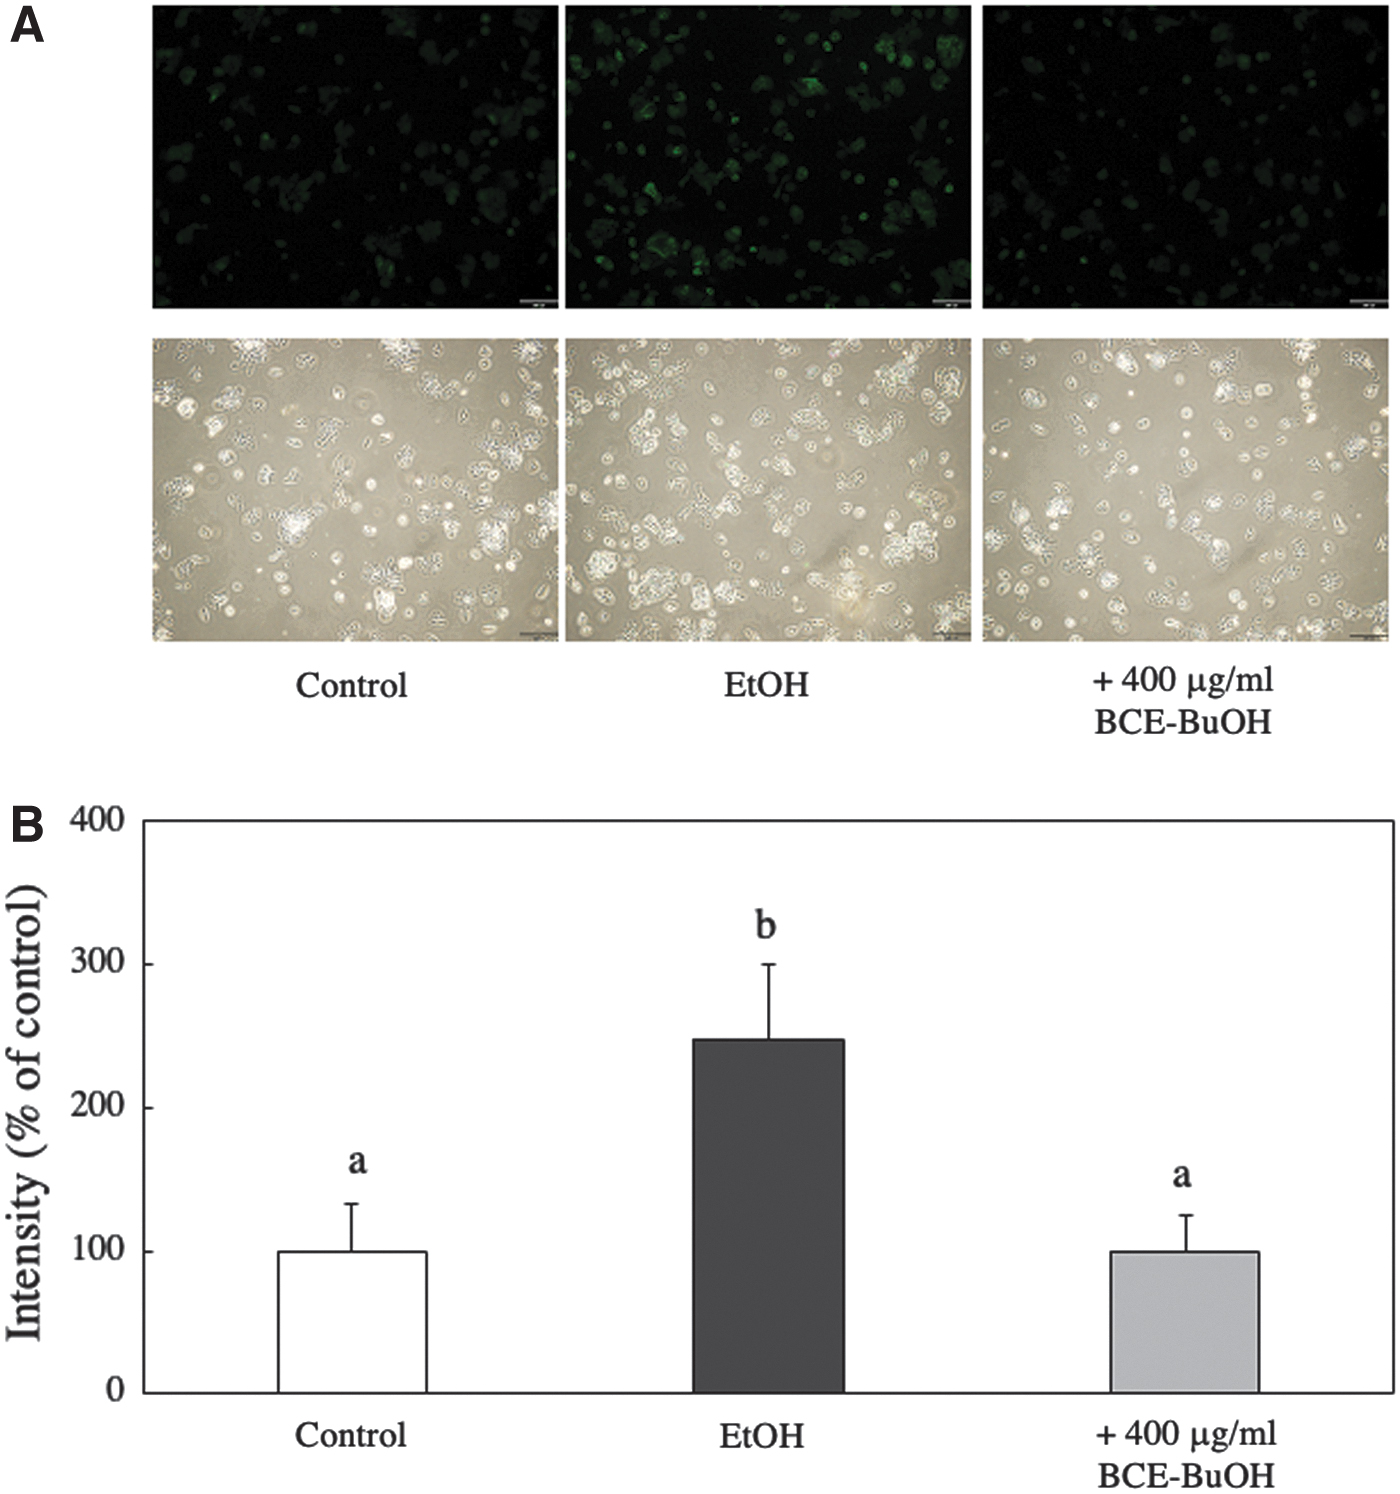
Effect of BCE-BtOH on intracellular ROS formation. ROS levels in hepatocytes cultured for 9 h were measured with 2′,7′-dichlorodihydrofluorescein diacetate.
Effect of BCE-BtOH on CYP2E1 protein and activity and Cyp2e1 mRNA level
CYP2E1 is the main cause of ROS formation in hepatocytes. Therefore, we examined the effect of BCE-BtOH on CYP2E1 protein and activity and Cyp2e1 mRNA level. CYP2E1 activity in 100 mM ethanol-treated hepatocytes increased significantly. In contrast, the CYP2E1 activity in the hepatocytes treated with both ethanol and BCE-BtOH was significantly lower, similar to the level of control hepatocytes (Fig. 4A). However, CYP2E1 mRNA and enzyme protein levels did not behave similarly to the enzyme activity (Fig. 4B, C).

Effect of BCE-BtOH on CYP2E1
Effect of BCE-BtOH on ADH protein and activity and Adh1 mRNA level
Although the levels of Adh1 mRNA did not change at all in the three groups, the protein level and activity of ADH were significantly increased by the addition of BCE-BtOH (Fig. 4D–F).
Effect of BCE-BtOH on ALDH protein and activity and Aldh2 mRNA level
The activity and protein level of ALDH were significantly enhanced by adding BCE-BtOH. Aldh2 mRNA levels were also significantly increased as well as activity and protein levels (Fig. 4G–I).
Effect of BCE-BtOH on cAMP levels
Some reports have shown that cAMP regulates enzyme activities related to alcohol metabolism. 25 –27 However, this involvement is not fully understood. So, the effect of BCE-BtOH on cAMP levels was studied. cAMP levels were significantly increased in ethanol and BCE-BtOH-treated hepatocytes (Table 7).
Effect of BCE-BuOH on intracellular cAMP Levels in Ethanol-Treated Hepatocytes
Hepatocytes were incubated with 100 mM ethanol with or without 400 μg/mL for 4 h. cAMP levels were measured as described in the Materials and Methods. The results represent the mean ± SD of four experiments. Values without a common letter are significantly different (P < .01).
Effect of H-89, a protein kinase A inhibitor, on alcohol metabolism-related enzymes
We used H-89 to investigate whether the cAMP/PKA pathway regulates alcohol metabolism-related enzyme. The activity of ADH enhanced by the addition of both ethanol and BCE-BtOH was significantly suppressed by the addition of H-89, whereas CYP2E1 activity, which was significantly suppressed by the addition of ethanol and BCE-BtOH, was enhanced by the addition of H-89. ALDH2 is an important enzyme related to acetaldehyde metabolism. The activity of ALDH2 enhanced by the addition of both ethanol and BCE-BtOH was suppressed by the addition of H-89 (Table 8).
Effect of Protein Kinase A Inhibitor on Alcoholic Metabolism-Related Enzymes in Ethanol- and BCE-BuOH-Treated Hepatocytes
To measure ADH or ALDH activity, hepatocytes were incubated with 100 mM ethanol with or without 400 μg/mL for 4 h. To measure CYP2E1 activity, hepatocytes were incubated with 100 mM ethanol with or without 400 μg/mL for 9 h. Alcoholic metabolism-related enzyme activities were measured as described in Materials and Methods. The results represent the mean ± SD of four experiments. Values without a common letter are significantly different (P < .01).
Effect of BCE-BtOH on PDE4b expression
Avila et al. showed that ethanol caused an increase in the PDE4 expression and a subsequent decrease in cAMP levels and downstream cAMP/PKA signaling. 28 Therefore, we measured Pde4b mRNA and PDE4b protein levels. Pde4b mRNA levels in ethanol and BCE-BtOH-treated hepatocytes for 3 h was significantly reduced compared with those in control cells (Fig. 5A). Furthermore, PDE4b protein levels in hepatocytes treated with ethanol and BCE-BtOH for 4 h were significantly lower than those in control or ethanol alone-treated hepatocytes (Fig. 5B).

Effect of BCE-BtOH on the expression of Pde4b mRNA and PDE4b protein levels.
DISCUSSION
Our studies showed that BCE was effective, even after digestion and absorption, for suppressing hepatic steatosis and fibrosis. It was also confirmed that after BCE treatment, the activities of markers of liver function, serum AST, and ALT, decreased to that of the control levels used in our investigations. These results indicate that BCE is effective against ALD in vivo.
Furthermore, the most interesting finding of this study is that BCE increased cAMP levels by suppressing the Pde4b mRNA and PDE4b protein levels in ethanol-treated hepatocytes. We also investigated the enzyme activities, the enzyme protein levels, and mRNA levels of ADH, CYP2E1, and ALDH, which are specific for cAMP; in particular, the regulation of intracellular cAMP levels 29 is greatly influenced by the PDE4 family. In the present study, we examined CYP2E1 and ALDH using enzyme assay methods, western blot analysis, and qRT-RCR analysis, which were regulated through the cAMP-PKA pathway.
cAMP regulates numerous intracellular signal transduction pathways involved in inflammation and cell survival. The cAMP levels are regulated by the activity of adenylyl cyclase and the activities of phosphodiesterases (PDEs). However, the function of cAMP is generally controlled by PDEs. PDE4, PDE7, and PDE8 act specifically on cAMP, and especially the PDE4 family is important to regulate the intracellular cAMP levels. 29
CYP2E1 plays a major role in intracellular ROS formation. Some researchers have reported that regulation of CYP2E1 expression on mRNA and protein levels are observed under certain physiological conditions, including obesity, diabetes, and alcohol consumption. 30,31 Johansson et al. showed that ethanol stabilized the catalytic site of CYP2E1 and thereby regulated the enzyme posttranslationally. 32 Wang et al. also showed that CYP2E1 protein levels are regulated with ubiquitin-dependent proteasome degradation enhanced by multisite phosphorylation by PKA and/or protein kinaseC. 25 Therefore, it is important to clarify how the CYP2E1 expression is regulated. We found that ethanol-enhanced CYP2E1 activity was inhibited posttranslationally by the addition of BCE-BtOH and that its inhibition was suppressed by adding H-89 (Table 8). These results showed that BCE-BtOH regulates CYP2E1 activity posttranslationally through cAMP/PKA signaling.
We have shown that Ecklonia cava polyphenols enhance cAMP-dependent activation of ADH and CYP2E1 in hepatocytes treated with ethanol. 7 Potter reported that adding dibutyryl cAMP increased Adh1 mRNA at 12 h and ADH activity at 24 h in hepatocytes. 27 In this study, we confirmed that both ADH protein and ADH activity were translationally enhanced in the hepatocytes treated with ethanol and BCE-BtOH for 4 h. Furthermore, addition of H-89 suppressed ADH activity. From these results, ADH activity was suggested to be translationally regulated through the cAMP/PKA signaling.
We also revealed that the increase in ALDH activity by BCE-BtOH was caused by an increase in the Aldh2 mRNA and ALDH2 protein levels in hepatocytes and addition of H-89 suppressed ALDH activity. Crabb et al. reported that ALDH2 activity was enhanced by a cAMP analog in rat H4IIEC3 hepatoma cells. 33 These results suggest that BCE-BtOH transcriptionally regulates ALDH2 activity through cAMP/PKA signaling. Furthermore, we and other researchers 33,34 observed that ethanol reduced the activity of ALDH2 slightly. These results show that the activities of three important alcoholic metabolism-related enzymes, ADH, ALDH, and CYP2E1, are regulated by the cAMP/PKA signaling.
The present study showed that BCE enhanced the levels of cAMP in hepatocytes. Activities of adenylate cyclase and/or phosphodiesterase regulate intracellular cAMP levels. Recent report of Avila et al. showed that cAMP levels were reduced through increasing hepatic PDE4 expression due to chronic alcohol ingestion. 28 Furthermore, Rodriguez et al. reported that alcohol-induced liver injury was prevented by inhibiting PDE4. These findings suggest that inhibition of PDE4 is a useful treatment for ALD. 35 In this study, we found that BCE reduced the expression of hepatic PDE4.
It is crucial to know which components of BCE prevent liver damage. Various polyphenols are contained in black carrots. Therefore, BCE-BtOH was analyzed using proton nuclear magnetic resonance spectroscopy. However, the resulting spectra indicated that BCE-BtOH contained various compounds with benzene ring(s) and many glycosides. Therefore, it is necessary to reveal which compound(s) is/are the active component(s).
In conclusion, we found that BCE protects against ethanol-induced liver injury with in vivo and in vivo models. Furthermore, our results indicated that BCE increased cAMP levels by the suppression of Pde4b mRNA and PDE4b protein levels, thereby regulating the activities of ADH, CYP2E1, and ALDH, at the translational, posttranslational, and transcriptional levels, respectively (Fig. 6). Our findings suggest that BCE is beneficial for the prevention of ALD.
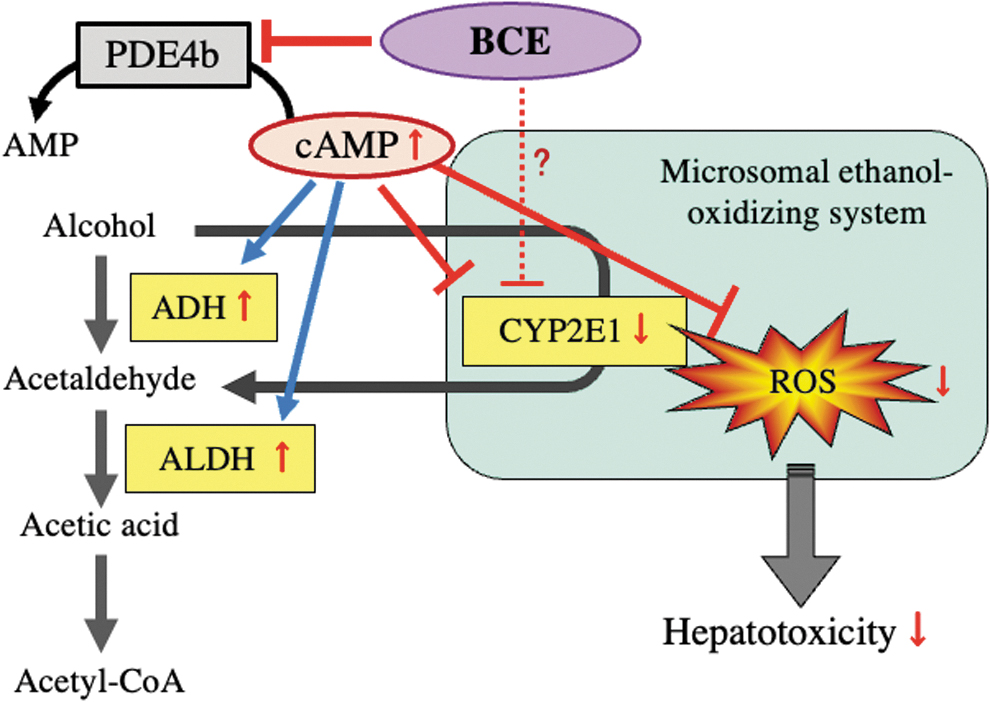
Preventive effect of BCE against ethanol-induced hepatic injury. BCE increases cAMP levels with the suppression of Pde4b mRNA and PDE4b protein. The increased cAMP activates PKA and then increases ADH and ALDH activities, at the translational and transcriptional levels, respectively. On the other hand, CYP2E1 is regulated at the posttranslational level by the cAMP/PKA pathway. However, it is unknown whether BCE directly inhibits CYP2E1 activity. BCE regulates the activities of three alcoholic metabolism-related enzymes, ADH, CYP2E1, and ALDH and then suppresses the overproduction of ROS, the main cause of hepatotoxicity.
Footnotes
AUTHORs' CONTRIBUTIONS
A.K., T.N., I.M.-Y., and A.K.-Y. designed the research; A.K.-Y. conducted the research; H.S. and M.K. provided essential materials; A.K., T.N., and A.K.-Y. analyzed the data; A.K., I.M.-Y., and A.K.-Y. wrote the article; A.K.-Y. had primary responsibility for final content; and all authors have provided important intellectual input and have read and approved the final article.
DISCLAIMER
Konan Chemical Industry, Co., Ltd. (KCI) did not have any additional role in the design, data collection and analysis of the study, nor the decision to publish or preparation of the article.
AUTHOR DISCLOSURE STATEMENT
A part of the research grant and black carrot extract were provided by KCI. We declare that these relationships do not affect the results and conclusions of this study.
FUNDING INFORMATION
This work was supported by JSPS KAKENHI (Grant No. 15K00832). Konan Chemical Industry, Co., Ltd. (KCI) provided the black carrot extract, a part of the grant, and support in the form of salary for H.S. and M.K.