




Abstract
Antioxidant-related parameters and anti-inflammatory and antimicrobial activities against Listeria monocytogenes were assessed in eight North East Spain poplar propolis samples. Propolis extracts (PEs) were obtained using 70% ethanol (PEE) and methanol (PME). Yield and total phenol compounds were higher in PEE. Phenolic acids were analyzed by a high-performance liquid chromatograph–diode array detector. Caffeic and ferulic acids were quantified in all PEE and PME. All samples contained p-coumaric acid (quantified in 6 PEE and in 3 PME). Ascorbic acid was detected in all propolis, but mainly quantified in PME (≤0.37 mg/g PE). Biological properties were tested on PEE. As for antiradical activities, trolox equivalent antioxidant capacity (TEAC) [against 2,2′-azino-bis(3-ethylbenzothiazoline-6-sulfonic acid)•+], ranged between 578 and 4620 µmol trolox/g, 2,2-diphenyl-1-picrylhydrazyl (DPPH) (against DPPH free radical), between 0.049 and 0.094 mg/mL, antioxidant activity against hydroxyl (•OH) radical (AOA), between 0.04 and 11.01 mmol uric acid/g, and oxygen radical absorbance capacity (ORAC) against peroxyl (ROO•) radical between 122 and 3282 µmol trolox/g. Results of TEAC, AOA, and ORAC were significantly correlated. IC50 anti-inflammatory activity ranged from 1.08 to 6.19 mg/mL. Propolis showed higher inhibitory activity against L. monocytogenes CECT934 and L. monocytogenes CP101 by agar well diffusion (P < .05) (10.5 and 10.2 mm, respectively) than against L. monocytogenes CP102 (7.0 mm). Data of this research show that North East Spain propolis may be of interest for pharmaceutical and food industry use.
INTRODUCTION
Bees visit plants to collect nectar, honeydew, pollen, resins, and gums. Inside and among the honeycombs of hives, there is a sticky substance called propolis. Propolis, or bee glue, is a natural substance produced by bees from resins and gums coming from bark and buds mainly from various plants such as birches, poplars, oaks, willows, conifers, and many others; bees transport propolis inside the hive and mix them with salivary secretions and wax to seal the gaps and varnish the inside of the hive. 1,2
Chemical composition and properties of propolis were intensely researched since the 90s. 3 –17 Composition of propolis varies from hive to hive, from district to district, and depends on harvesting time, seasonality, illumination, altitude, collection type, as well as food availability and activity developed during propolis exploitation. 3 Most propolis show considerable similarities in their overall chemical nature: 50% resin, 30% wax, 10% essential oils, 5% pollen, and 5% of other organic compounds. 4 In propolis more than 300 different compounds were identified, including flavonoids, polyphenolic esters, terpenoids, steroids, amino acids, caffeic acid and its esters, other aromatic and aliphatic acids and their esters, carbohydrates, aldehydes, amino acids, ketones, chalcones, dihydrochalcones, terpenoids, vitamins, and inorganic substances. 1,5 Propolis are classified according to their botanical origin and chemical composition into six types as follows: poplar (Europe, North America, nontropic regions of Asia), birch (Russia), green (Brazil), red (Cuba, Venezuela), “Pacific” (Pacific region), and “Canarian” (Canary Islands) propolis. 6
An extensive review on the pharmacological properties of propolis highlights valuable potential biological properties, antibacterial, antifungal, antiprotozoan, antiviral, antioxidant, anti-inflammatory, antitumor, hepato-protective, antineurodegenerative, local-anesthetic, free-radical-scavenging, immunostimulating, cytotoxic, genotoxic, and antigenotoxic. 7
Balsam content of propolis is usually extracted with alcohols. Ethanolic solutions can be used as a final dosage form or eventually incorporated into foods, beverages, medicines, or cosmetics in final concentrations between 10% and 30% (w/w). 18 Obtaining propolis balsam is very interesting for the food industry, especially within the field of functional foods. Several studies described potential bioactive properties of propolis. One of them referred to a propolis-based dietary supplement and its use in combination with mild heat for apple juice preservation 19 and other research to possible bioactive properties of honey with propolis. 20
It is well known that a balance diet helps promote health while preventing diseases. Many degenerative diseases, including cancer, atherosclerosis, rheumatoid arthritis, and neurodegenerative diseases, are the result of oxidative damage caused by free radicals, 21 and they can be trapped or neutralized by antioxidant substances naturally present in medicinal plants, fruits, and vegetables. 22 –24 Phenolic compounds are secondary metabolites produced by multiple plant species and represent the most diverse class of compounds present in propolis. Phenolic compounds constitute one of the major groups of compounds known to act as primary antioxidants or free radical terminators and inhibit some molecular targets of pro-inflammatory mediators in inflammatory responses. 25 Owing to the high quantity of phenolic acids and flavonoids in propolis, this bee product shows antioxidant, antibacterial, and anti-inflammatory properties. The most important phenolic compounds in propolis are flavonoids that demonstrated cytotoxic, proapoptotic, and antioxidative activities. 26 Ascorbic acid or vitamin C contributes to maintain the normal function of the immune system during and after intense physical exercise. 27 This vitamin was analyzed in propolis. 24
In literature, there are few studies about the composition of propolis from Spain. 28 –35 Therefore, in order to increase the knowledge about Spanish propolis, the objectives of this research were to determine the yield and the phenolics’ composition of both ethanolic and methanolic extraction of balsam content of North East Spain propolis and to characterize them using the ethanolic extract to assess their antioxidant-related parameters, as well as to assay some of their potentially biological activities. The analyzed parameters were total phenolics' content (TPC), total flavonoids' content (TFC), phenolic acids (gallic, p-coumaric, chlorogenic, caffeic, and ferulic acids), ascorbic acid, antiradical, anti-inflammatory, and antimicrobial activities.
MATERIALS AND METHODS
Reagents and apparatus
Gallic acid, caffeic acid (CA), catechin (Ct), p-coumaric acid, ascorbic acid, chlorogenic acid, ferulic acid, and trolox [(+)-6-hydroxy-2,5,7,8-tetramethylchromane-2-carboxylic acid] were purchased from Sigma-Aldrich; uric acid was purchased from Roche (Mannheim, Germany); and N-acetyl-
Polyvinylidene fluoride (PVDF) 0.45 µm syringe filters (Chmlab Group). High performance liquid chromatograph HPLC 1100 (Agilent Technologies), coupled to diode array detector (HPLC-DAD), chromatographic column ACE C18, (150 × 4.6 mm, 5 µm particle diameter) (Symta), chromatographic oven 90–2215 SSI (Lab-Alliance) and Spectrophotometer Varian Cary 400 Bio were used for the analyses.
Propolis samples and balsam components’ extraction
Eight raw propolis samples (P1-P8) were collected from different geographical locations placed in North East Spain (Fig. 1). According to the beekeepers, the main plant species surrounding the beehives were poplar (Populus spp.), oak (Quercus spp.), and rosemary (Rosmarinus officinalis L.) for samples P1, P2, P3, P6, P7, and P8, as well as poplar (Populus spp.), thyme (Thymus vulgaris L.), dandelion (Taraxacum officinale L.), and sainfoin (Onobrychis sativa Lam.) for samples P4 and P5. The propolis were collected by scratching, during the last trimester of 2018. They were stored at −20°C in plastic jars until preparing propolis extracts (PEs) for analysis.

Geographical location of propolis samples.
PEs were obtained in triplicate grinding each propolis sample in a marble mortar at −20°C. Propolis ethanolic extracts (PEEs) were prepared mixing 2.00 g propolis with 20 mL 70% ethanol/water (v/v). Propolis methanolic extracts (PMEs) were prepared mixing 2.00 g propolis with 20 mL methanol. Mixtures were subjected to mechanical agitation in glass beakers in the absence of light and at room temperature throughout 3 days. To remove wax and insoluble impurities, mixtures were frozen at −20°C/24h and next filtered (Whatman No. 1). Then, extracts were dried in a TurboVap II (Zymark, Germany) at 60°C and 0.5 bar (N2) until total solvent removal. Yield rate [Y(%)] was calculated as follows: [Y(%) = (E − T)/P × 100], where E is the weight of the glass beaker with PE, T is the weight of the glass beaker, and P is the weight of the raw propolis.
Total phenolics’ content and total flavonoids’ content
TPC was assessed in PEE and PME by the Folin–Ciocalteu procedure. 36,37 One milliliter PE/blank/standard, 4 mL of Folin–Ciocalteu, and 6 mL of Na2CO3 (20%) were mixed and made up to 50 mL with distilled water. After 2 h in dark, absorbance was read at 760 nm against a blank, where methanol was used instead of sample. CA (50–500 μg/mL) was used as standard for the calibration curve. The results were expressed as mg CA/g PE.
TFC was analyzed in PEE and PME using the aluminum chloride method. 10 Absorbance was read at 510 nm against the blank (1 mL of methanol). Ct (0.01–1 mg/mL) was the standard used for the calibration curve. Results were expressed as mg Ct/g PE.
Phenolic acids by HPLC-DAD
Phenolic acids were analyzed by HPLC-DAD. For phenolic acid extraction 0.5 g dry PE, for both PEE and PME, was mixed with 7 mL of methanol and 2 g/l of butylated hydroxyanisole:acetic acid 10% (85:15, v/v). The mixture was vortexed for 3 min and sonicated during 30 min. Then, the mixture was made up to 10 mL with Milli-Q water and vortexed again during 5 min. One minute after being vortexed, 1 mL of the sample was purified through PVDF 0.45 μm filter and stored in an amber vial at −20°C.
Quantification was performed using calibration curves on a daily basis in the range 0.25–50 mg/L of the standard mixture (gallic, p-coumaric, chlorogenic, caffeic, and ferulic acids). The stock solution of phenolic acids was prepared at 100 mg/L in methanol. The linearity of all compounds was satisfactory (R 2 > 0.9987) between 0.005 and 2 mg/g PE. Quantification limit for each acid was 0.005 mg/g PE.
PE and the standards were analyzed by reversed-phase HPLC-DAD, using an ACE C18 column, whose temperature was kept at 25°C. The mobile phase was water containing 2% acetic acid (A) and acetonitrile (B). Acetonitrile concentration was gradually modified as follows: 0–7 min, 0%; 7–12 min, 20%; 12–25 min, 20%; and 25–30 min, 0%, following the method described by Santiago et al. 38 The flow rate was 1 mL/min and the injection volume 20 µL. Quantifications were carried out by peaks integration, using the external standard method, at 270 nm for gallic acid (GA), 310 nm for p-coumaric acid, and 325 nm for chlorogenic, caffeic, and ferulic acids. Chromatographic peaks were confirmed by comparing their retention time with those of reference standards and by DAD spectra.
Ascorbic acid by HPLC-UV
The quantification of ascorbic acid in PE (PEE and PME) was carried out following the procedure described by Gutierrez et al. 39 PE (0.5 g) was diluted to 10 mL with H3PO4 0.05N and then purified through PVDF 0.45 µm filter. PE was analyzed before 3 h. Ascorbic acid was analyzed by reversed-phase HPLC-UV, using an ACE C18 column, whose temperature was kept at 25°C. The mobile phase was Na2H2PO4 1% (w/v) at pH 2.7 in isocratic conditions for 10 min. The flow rate was 0.9 mL/min, the injection volume 20 µL. The wavelength for detection was 245 nm. Quantification was carried out by external standard curve, using ascorbic acid in H3PO4 0.05N (0.25–50 mg/L) as standard, preparing the standard fresh daily. The linearity of all compounds was satisfactory (R 2 > 0.9974) between 0.01 and 2 mg/g PE, and the quantification limit was 0.01 mg/g PE.
Bioactive properties
Antiradical, anti-inflammatory, and antimicrobial activities were assessed in PEE, which were dissolved in 25 mL 70% ethanol and kept at −20°C until analysis.
Antiradical activities
2,2′-azino-bis(3-ethylbenzothiazoline-6-sulfonic acid)•+ scavenging activity test: Trolox equivalent antioxidant capacity (TEAC) was evaluated using ABTS [2,2′-azino-bis(3-ethylbenzothiazoline-6-sulfonic acid)] as the source of free radicals 40 reading the absorbance at 734 nm. Trolox was used as standard for the calibration curve (0.625–3 mM). IC50 (50% inhibitory concentration in mg/mL) was evaluated. In addition, the percentage inhibition [((Ab − As)/Ab) × 100] after 6 min was calculated, being Ab the absorbance of blank and As the absorbance of sample or standard. Results were expressed as μmol trolox (T)/g PE.
2,2-diphenyl-1-picrylhydrazyl free radical-scavenging activity: DPPH (2,2-diphenyl-1-picrylhydrazyl) was evaluated following the procedure described by Miguel et al. 40 Different concentrations of PEE samples were assayed. The absorbance was read at 517 nm (A1) against a blank (A0, methanol instead of sample). The percentage inhibition [(A0 − A1/A0) × 100] was plotted against PE concentration, and IC50 was determined.
Radical-scavenging effect on hydroxyl radicals (AOA assay): Hydroxyl radicals scavenging ability of PEs were assayed following the procedure of Koracevic et al. 41 Each sample (A1) had its own control (A0), in which acetic acid (20%) was added before Fe-EDTA and H2O2. For each batch of analysis, a negative control (K1 and K0) was prepared, containing the same reagents as A, except the sample, which had been replaced with phosphate buffer. One millimolar of uric acid in NaOH (5 mM) (U1 and U0) was used as standard for calibration. Antiradical activity was calculated as mmol uric acid [(UA)/g PE = 0.13 × (CUA) × (K − A)/(K − U)], where CUA is the concentration of uric acid (1 mM), K is the absorbance of control (K1–K0), A is the absorbance of sample (A1–A0), and U is the absorbance of uric acid solution (U1–U0).
Radical-scavenging effect on peroxyl radicals: Oxygen radical absorbance capacity (ORAC) was determined according to the method described by Huang et al. 42 with modifications using a fluorometer Varioskan LUX microplate reader (Thermo Scientific). Three microliters of fluorescence (4.1 µM; Sigma-Aldrich) was added to 187 µL of sample, buffer (sodium phosphate 75 mM, pH 7.4), or trolox (0.2 µM) solutions in a 96-well white plate (Greiner Bio-one) at 37°C for 5 min. Then, 10 µL of 0.37M 2,2′‐azobis(2‐amidinopropane) dihydrochloride was added to the mixture and measured every 6 min for 120 min (excitation wavelength 485 nm and emission wavelength 522 nm). The results were expressed as the trolox equivalent (µmol) per gram of propolis [(area sample − area blank)/((area trolox − area blank)/µmol trolox)].
Anti-inflammatory activity
Anti-inflammatory activity of PEE was assessed by hyaluronidase inhibition assay, based on the mechanism of the Morgan–Elson reaction. 43 Enzymatic activity was defined as 1 unit of hyaluronidase that catalyzes the liberation of 1 μmol NAG per minute under specified conditions. NAG standard solutions (0–4.44 mM) were used for calibration curves. With the NAG formed in each enzymatic reaction and using the linear regression equation, the percentage of enzyme inhibition was calculated as % Inhibition = (A − B/A) × 100, where A was μmol of NAG in the positive control (where microliters of sample were substituted by buffer) and B was μmol of NAG of each sample reaction. IC50 was determined.
Antimicrobial activity
Antimicrobial activity of PEE was evaluated by agar well diffusion, measuring the inhibition halo. Three strains of Listeria monocytogenes were used: CECT 934, CP101, and CP102 (last two are from bacterial collection of the Human Nutrition and Food Science Unit, at Zaragoza University, isolated from ready to eat meat products). Stock cultures were kept on brain heart infusion (BHI, Oxoid, England) with glycerol (20%) at −20°C. Bacterial inoculum was prepared in BHI for 17 h at 37°C. The density of the cell suspensions was adjusted to the turbidity of a 0.5 McFarland Standard (equivalent to 8 log cfu/mL). Agar plates (MH; Mueller-Hinton, Oxoid) were inoculated with 100 µL of bacterium suspension (8 log cfu/mL) over the surface of the plate. Two hours later, sterile discs (6.0 mm diameter) impregnated with 15 μL of each PEE were placed on the surface of the agar using a sterile tweezer. Plates were incubated at 37°C for 48 h. A positive disc (ampicillin, 10 µg) and a negative control (ethanol 70%) were also tested. Inhibition halos were measured using a Vernier caliper. The diameter of zones (mm), including the diameter of the discs, was recorded.
Statistical analysis
All the analyses were performed in triplicate. Normality test was done for all the parameters. The parametric values were evaluated by multiple range tests by Tukey LSD test (P < .05), whereas nonparametric values were analyzed by Kruskal–Wallis test, followed by box and whiskers graphic interpretation. Pearson correlations were applied to the results. Statistical software Statgraphics Centurion XVII was used.
RESULTS
Yield
The yield of PE from North East Spain was highly variable (Table 1), with values between 23.8% and 72.6% for extraction with 70% ethanol (PEE) and from 22.9% to 65.2% for methanolic extraction (propolis methanolic extract, PME). Six samples showed a yield higher than 40% using both solvents, although in general, PEE showed higher yield than PME.
Yield of Propolis Extract, Phenolic Acids (mg/g PE), and Ascorbic Acid (mg/g PE) of North East Spain Propolis
Quantification limit: for phenolic acid 0.005 mg/g PE; for ascorbic acid 0.01 mg/g PE.
Different letters show significant differences (P < .05) between propolis samples.
Poplar propolis samples from different North East Spain geographical locations.
shows significant differences (P < .05) between PEE and PME for each propolis sample.
ND, not detected; NQ: not quantified; PEE, propolis ethanolic extract; PME, propolis methanolic extract.
Antiradical, Anti-Inflammatory, and Antimicrobial Activities Against L. monocytogenes of North East Spain Propolis Ethanolic Extracts (n = 3)
ABTS, 2,2′-azino-bis(3-ethylbenzothiazoline-6-sulfonic acid); DPPH, 2,2-diphenyl-1-picrylhydrazyl; ORAC, oxygen radical absorbance capacity.
Different letters show significant differences (P < .05) between propolis samples.
TPC and TFC
Figure 2 shows averages and standard deviations of TPC (Fig. 2A) and TFC (Fig. 2B). TPC results were expressed as mg CA per gram PE or balsam instead per gram raw propolis, because this was considered more accurate, considering the propolis yield variation. TPC ranged from 194 to 358 mg CA/g PEE and from 172 to 337 mg CA/g PME. Despite obtaining higher values in the PEE, a positive high correlation was observed between the TPC values obtained by both extraction methods (r = 0.9712, P = .0000; Supplementary Table S1). The results were not correlated to the geographical location.
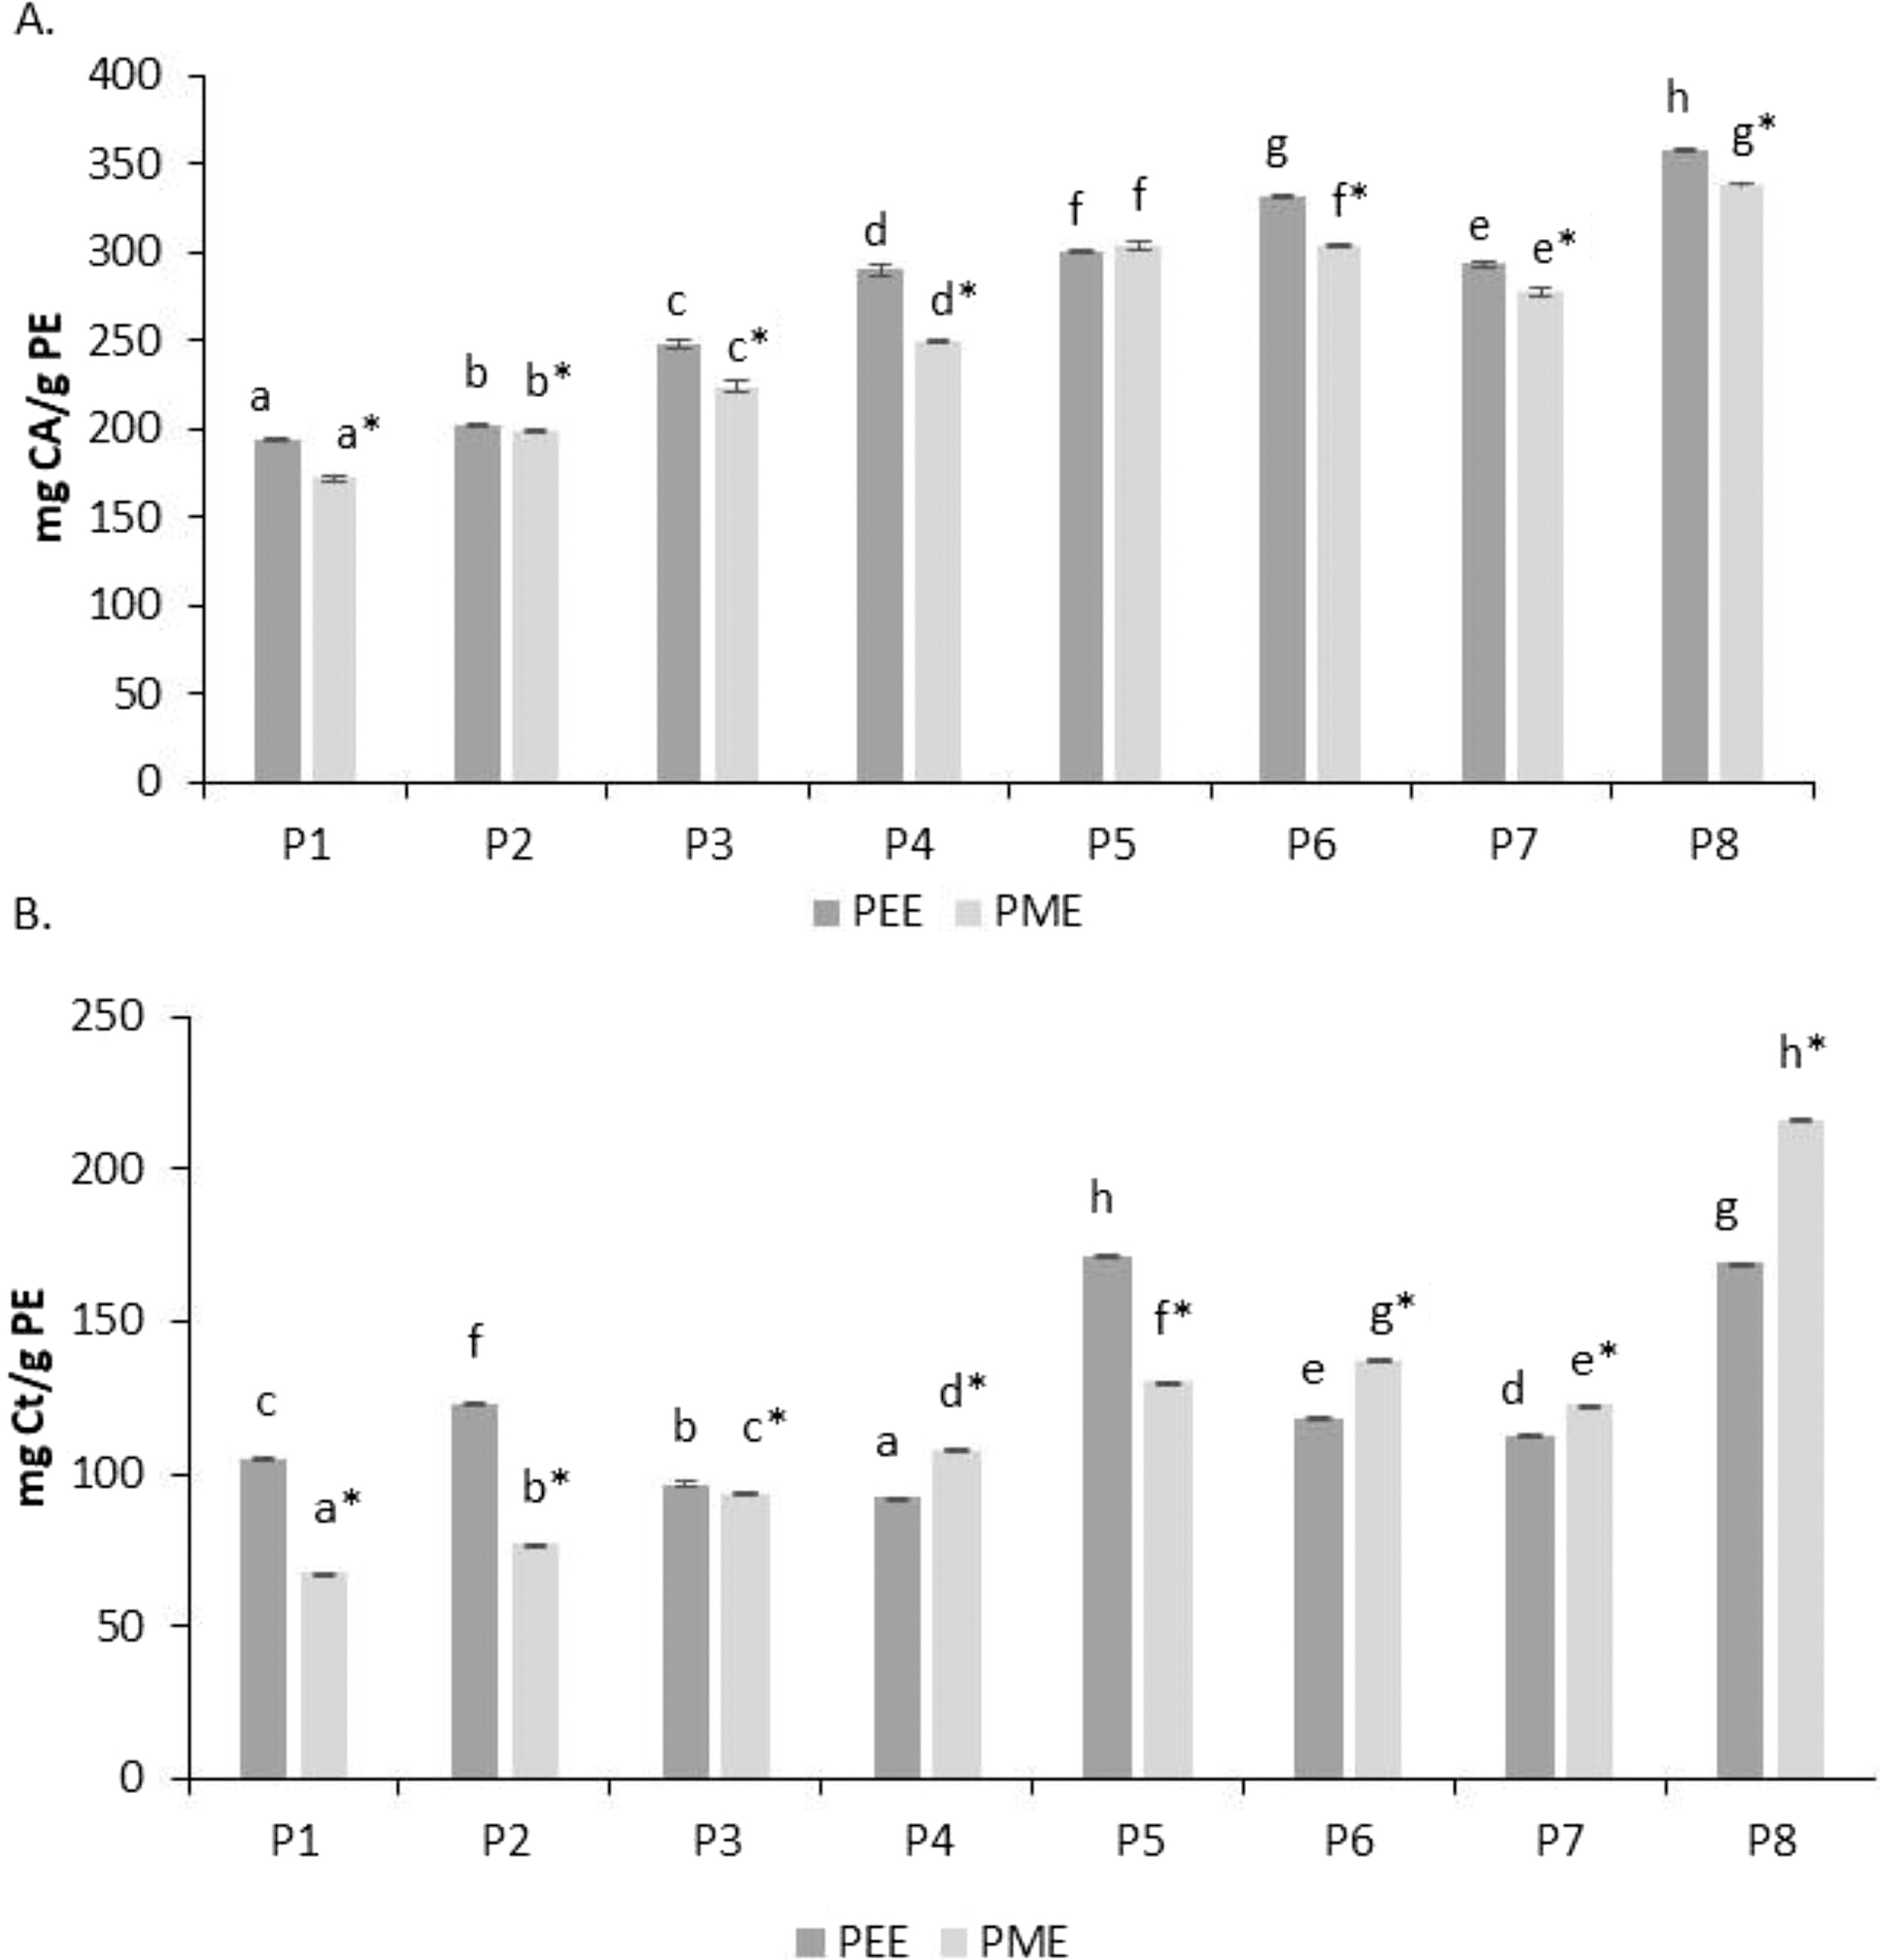
Total phenolics' content (mg CA/g)
TFC results were expressed as mg catechin Ct per gram of PE (mg Ct/g PE). They varied between 92 and 172 mg Ct/g PEE and between 67 and 216 mg Ct/g PME. There were also significant differences between both extraction solvents, but in this case, half of the samples showed higher TFC when ethanol was used, and the other half higher values when methanol was used. This was probably due to the fact that some flavanols and phenolic acids such as luteolin and rutin were better extracted with ethanol, whereas other flavonoids were better extracted with methanol. 44,45 The results of TFC obtained by PEE and PME were moderately correlated (r =0.6855; P = .0002) (Supplementary Table S1). As in TPC, the results were not related to the geographical location.
Phenolic acids
Among the assessed phenolic acids (Table 1; Supplementary Fig. S1), only caffeic and ferulic acids were quantified in high amounts in all PE, regardless of whether they were extracted with ethanol or methanol. p-coumaric acid was observed in all propolis but it was quantified in 6 PEE and in 3 PME (in P3 and P4 p-coumaric acid was only detected in PME). GA was quantified in four propolis samples and only in P1 by both solvents, whereas chlorogenic acid in seven, only in P1 and P7 by both PEE and PME.
Ascorbic acid
Ascorbic acid was detected in all samples, but in most of them the values of this vitamin were below the quantification limit. Vitamin C was only quantified in P6 in PEE and in P4, P6, P7, and P8 in PME with values between 0.29 and 0.37 mg/g PE.
Bioactive properties
Antiradical, anti-inflammatory, and antimicrobial activities (Table 2) were determined only in PEE, although both solvents (ethanol 70% and methanol) were good extractive agents for polyphenols, because: (1) ethanol 70% achieved a higher total phenols’ extraction than methanol, (2) ethanol is the most common extractant agent described in the literature so that the activities measured on PEE were more comparable with those of other research works, and finally, (3) methanol is considerably more toxic than ethanol so that, at equal efficacy, it is better to use the less toxic solvent.
Antiradical activities
Antioxidant capacity should be analyzed by methods based on different mechanisms, and against several free radicals, 46 as antiradical activities. 47 TEAC was expressed in two different units in order to better compare our results with those of other works. TEAC IC50 varied between 0.47 and 2.05 mg/mL and TEAC expressed as µmol T/g PEE showed values between 578 and 4620 µmol T/g PEE. DPPH IC50 ranged between 0.049 and 0.094 mg/mL. DPPH free radicals scavenging activity was highly positively correlated with TPC of PEE (r = 0.9183) and moderately correlated with TFC of PEE (r = 0.6616) (Supplementary Table S1). AOA ranged between 0.04 and 11.01 mmol AU/g PEE. For ORAC, the results varied from 122 to 3282 µmol T/g PEE. For all radicals a wide variance was obtained, showing no relation to the geographical origins. In general, significant correlations were found among TEAC, ORAC, and AOA with correlations’ coefficients (P = .0000): r (TEAC-AOA) = 0.9781; r (TEAC-ORAC) = 0.9824; r (AOA -ORAC) = 0.9888 (Supplementary Table S1).
Anti-inflammatory activity
IC50 anti-inflammatory activity of North East Spain propolis ranged from 1.08 to 6.19 mg/mL. Anti-inflammatory activity was moderately correlated to TEAC (r = 0.5749; P = .0033), AOA (r = 0.5966; P = .0021), and ORAC (r = 0.5734; P = .0034) (Supplementary Table S1).
Antibacterial activity against L. monocytogenes
All propolis showed antimicrobial activity against the three studied strains of L. monocytogenes, exhibiting higher activity against L. monocytogenes CECT934 (10.5 mm) and L. monocytogenes CP101 (10.2 mm) than against L. monocytogenes CECT102 (7.0 mm). Antibacterial activity was moderately correlated with and TFC of PEE (Table 1S, supplementary material), whereas a negative correlation was observed with ABTS, ORAC, and hydroxyl antiradical activity (Supplementary Table S1).
DISCUSSION
Yield
Our yields in poplar PE were similar to those obtained by Escriche and Juan-Borras 31 (51.0–80.5%) with double maceration with 70% ethanol in poplar propolis. However, other studies showed lower values, between 12% and 45% using ethanol as solvent. 48,49 Conversely to our results, Saito et al. 50 obtained higher yield in PME (52% and 55%) than in PEE (37% and 45%) in green and red propolis, respectively. This different yield could be due to the composition of the raw propolis such as insoluble impurities (i.e., wings and legs of bees, stomata, or woods), wax content in propolis, the propolis collection technique, 33 or the solvent used.
TPC and TFC
TPC values were similar to those obtained in other studies on Spanish samples. Kumazawa et al. 30 obtained values between 31.4 and 364 mg GA/g PEE in Andalusian propolis, Luis-Villaroya et al. 19 reported a mean value of 82.15 mg CA/g in propylene glycol extract, Escriche and Juan-Borras 31 obtained values of 353 and 442 mg GA/g PEE in Valencian propolis, Serra-Bonvehí and Lacalle-Gutiérrez 51 reported values between 210 and 340 mg GA/g propolis in Northeastern Spanish PEE, and Osés et al. 34 described values from 65.5 to 228.4 mg GA/g propolis in PEE. Although these values being quite similar, a proper comparison could not be done, because different standards and/or different solvents were used, and sometimes values were expressed per gram of PE or per gram of propolis. In the literature, few studies used CA as standard for propolis TPC, including the work of Kalogeropoulos et al. 52 on Greek propolis with values between 80.2 and 338 mg CA/g PEE and the research of Luis-Villaroya et al. 19 on Moroccan propolis with values from 0.74 to 91.22 mg CA/g propolis in propylene glycol extract. Other values obtained in propolis from European and Mediterranean countries were quantified as GA units, with values ranging from 6.74 to 486.9 mg GA/g using ethanol as solvent, 15,17,24,34,53 –65 whereas values from 2 to 325 mg GA/g were obtained in methanol extracts. 24,66,67 It is likely that this high variability of TPC is related to the amount and composition of phenols in propolis, which depends on botanical origins, harvesting season, and weather conditions, among other variables.
Regarding TFC, although different authors described Ct, rutin, and luteolin in propolis, 31,35,53,58,67,68 very few works studied flavanols as “total flavonoids' content” index. Some propolis from different countries (Portugal, Spain, Turkey, and Brazil) reported similar values to those obtained in our study, ranging from 21 to 153 mg Ct/g for PEE 10,20,34,56 and from 14 to 136 mg Ct/g for PME. 10 However, lower values were observed by Gargouri et al. 17 and Béji-Srairi et al., 64 who obtained values from 1.17 to 31.79 mg Ct/g in Tunisian PEE. In addition, lower results were obtained when propylene glycol (0.096 mg Ct/g) or water (6–42 mg Ct/g) was used as solvent. 10,19 The high variability can be due to differences in botanical and geographical origins and solvents used for extraction. The procedure to determine TFC in propolis carried out in alkaline medium is not so frequently used as the procedure in neutral medium (without NaNO2), because the former is less selective for flavonoids’ determination than the latter. TFC assessed in neutral medium includes flavonols and luteolin. TFC assessed in alkaline medium includes rutin, luteolin, and catechins, as well as other phenolic acids which absorb at 510 nm (i.e., chlorogenic acid). 69 However, this index could be efficiently used as good marker for phenolic and flavonoid compounds, because it demonstrated to be correlated with TPC, having shown a better correlation when methanol was used in the extraction (r = 0.9142) (Supplementary Table S1).
In this study higher TPC was obtained in PEE than in PME, whereas TFC in some propolis samples was higher in PEE and in other propolis samples was higher in PME. There was no relationship between TPC or TFC and specific geographical locations. Other researchers described similar results, when using ethanol at different concentrations (50%, 70%, 80%, 85%). Ethanol proved to extract higher amounts of phenols in comparison with other solvents (methanol, water). 10,24,40 However, Sambou et al. 70 and Saito et al. 50 obtained higher TPC in PME than in PEE using conventional, Soxhlet, microwave-assisted, and ultrasound-assisted extraction methods. In relation with TFC, Mouhoubi-Tafinine 24 and Silva et al. 10 also obtained higher amounts in PEE than in PME, when ethanol 80–85% was used, whereas other works showed higher flavonoids in PME 40,50,70 using conventional, microwave-assisted, and ultrasound-assisted extraction methods; with Soxhlet extraction, a higher TFC was achieved using ethanol as solvent. 70
Phenolic acids
Comparing our data for phenolic acids with those reported for other Spanish propolis, similar values of CA were obtained in Andalusian propolis (5.0 mg/g PEE). 5 However, other studies on Spanish propolis showed higher CA contents (12.1 mg/g of raw propolis and 60–79 mg/g of balsam) 31,32 and higher p-coumaric and ferulic acid amounts (21–47 and 15–19 mg/g balsam, respectively) when using 70% ethanol. Osés et al., 34 who also analyzed propolis from Spain, provided values between 0.3 and 11.0 mg/g for ferulic acid, between 0.7 and 6.4 mg/g for CA, and between 1.2 and 12.2 mg/g for p-coumaric acid in PEE. Our values were similar to those of poplar propolis from other countries, such as Cyprus and Greece, Morocco, Palestine, Turkey, Romania, and Poland, where the values for phenolic acids ranged as follows: chlorogenic acid: 0.02–0.15 mg/g, GA: 0.04–0.11 mg/g, p-coumaric acid: 0.07–2.18 mg/g, ferulic acid: 0.1–1.87 mg/g, and CA: 0.14–6.70 mg/g extracted with 70% ethanol and determined by GC-MS. 16,52,59,62,67 Higher values were described for PEE in other studies: In Turkish samples, Ristojevic et al. 53 reported values between 1.00 and 19.42 mg/g for ferulic acid, between 3.96 and 34.78 mg/g for CA, and between 1.26 and 4.47 mg/g for p-coumaric acid, and Özkök et al. 56 reported values between 1.28 and 4.92 mg/g for ferulic acid, between 1.2 and 7.6 mg/g for CA, and between 1.26 and 4.47 mg/g for p-coumaric acid. In Chinese Populus spp. propolis Zhang et al. 71 obtained values between 0.26 and 3.38 mg/g for ferulic acid, between 3.91 and 15.1 mg/g for CA, and between 0.98 and 21.2 mg/g for p-coumaric acid. On PME lower values were obtained 67 for GA (0.04–0.09 mg/g), chlorogenic acid (0.02–0.15 mg/g), CA (0.61–1.51 mg/g), and ferulic acid (0.16–0.68 mg/g) and higher values for p-coumaric acid (3.14–5.61 mg/g) in Turkish propolis.
Considering our data, neither ethanol nor methanol proved to be the best extractant agent for all phenolic acids in every propolis, probably because of differences in propolis composition that could affect solvent extraction.
Ascorbic acid
As far as we know, this is the first study in which ascorbic acid was analyzed by HPLC-DAD in Spanish propolis. Literature describes spectrophotometric methods to determine this vitamin in propolis, exhibiting a high variability of results. Ascorbic acid of Algerian propolis ranged from 0.0003 to 0.04 mg/g, 24,72 being the values lower than ours. In contrast, higher values were reported for stingless bees propolis with mean values of 0.91 mg/g in Malaysian propolis 73 and 19.51 mg/g in Bangladesh propolis. 74 The high variability of ascorbic acid amounts described for different propolis is likely due to the use of different analytical procedures and different solvents, as well as to differences in botanical origins, climatic, and propolis storage conditions, since ascorbic acid is easily oxidized in contact with air. Our results showed that methanol exhibited a higher extractant power than ethanol.
Bioactive properties
Antiradical activities
Most research articles on propolis determined antiradical activity using DPPH and FRAP. We decided not to perform the FRAP method, because it provides little additional information to the DPPH since results obtained by both procedures demonstrated to be correlated. 46
As for TEAC, our data about North East Spain propolis were higher than those reported by Osés et al., 34 whose values ranged between 110 and 253 µmol T/g PE and those obtained in Chinese propolis (36.76–106.73 µmol TE/g PE). 75 However, Béji-Srairi et al. 64 reported lower IC50 values (0.24–0.62 mg/mL), which mean a higher antiradical activity against ABTS radical if compared with our values.
Our IC50 for DPPH scavenging activity ranged between 0.049 and 0.094 mg/mL. Luis-Villanoya et al. 19 obtained a similar IC50 value (0.055 mg/mL). Lower concentrations (IC50) and therefore higher antiradical activity were obtained by Miguel et al. 40 (0.009–0.039 mg/mL), Moreira et al. 76 (0.006–0.052 mg/mL), and Peixoto et al. 57 (0.014–0.025 mg/mL) in propolis from different regions of Portugal. Other studies in Spanish propolis showed a percentage of inhibition of DPPH between 7.39% and 85.7%. 30,51,77 Different researches carried out in European and Mediterranean countries showed that IC50 DPPH values varied between 0.02 and 1.08 mg/mL. 55,56,58,59,62,64,65,67 In some studies carried out in propolis from Palestine and Saudi Arabia, higher values and therefore lower antiradical activity were obtained: from 0.05 to 1.02 mg/mL, 61 from 0.040 to 0.140 mg/mL, 58 and a mean value of 0.11 mg/mL. 66 This high variability could be related to geographical and botanical origins of propolis samples. DPPH scavenging activity seemed to be related with phenols and flavonoid compounds because it was positively correlated to them.
With regard to AOA, our results were higher than those previously reported on propolis samples (0.053–0.117 mmol UA/g propolis). 34,78
As for ORAC, although peroxyl radical is of great physiological importance, we did not find any work evaluating its content in propolis samples, so it was impossible to carry out any comparison of our results. The wide variance obtained for all radicals showed the high diversity of the eight propolis. Indeed, as our samples came from the same region, our results confirm the high variability showed by propolis of the same botanical origin or collected in close geographical areas. Apparently, most antiradical activity of propolis was provided by other compounds apart from phenolics, such as proteins, because no correlations were observed between antiradical activities: TEAC, AOA, and ORAC and TPC and TFC of PEE. As a final consideration, it is important to highlight the importance of assessing antiradical activities by different methods involving the use of different free radicals and different mechanisms of action, 46 as we did in our study. Antiradical activities’ results of this study showed the interesting antioxidant potential of the analyzed propolis.
Anti-inflammatory activity
Comparing our data with those described in the literature, Silva et al. 10 obtained higher IC50 values (lower anti-inflammatory activity), ranging between 18 and 23 mg of propolis/mL in Portuguese propolis. In our work, anti-inflammatory activity was moderately correlated to TEAC, AOA, and ORAC so that the same compounds could be responsible for both anti-inflammatory and antiradical activities. Therefore, the particular compounds/group of compounds of propolis responsible for anti-inflammatory activity should be further researched. Araujo et al. 79 concluded that anti-inflammatory activity was due to one or two bioactive compounds instead of the synergic effect of all phenolic compounds. Conversely, other researchers argued for a synergistic effect. In this way, Mirzoeva et al. 80 attributed the anti-inflammatory effects of propolis to the combined effect of CA, quercetin, naringenin, and CAPE, whereas Krol et al. 81 believed that this effect was mainly due to salicylic acid, apigenin, ferulic acid, and galangin.
Antibacterial activity against L. monocytogenes
Despite there being numerous studies on the antibacterial effect of propolis against different bacteria and yeasts and the problem associated to L. monocytogenes in key sectors such as the meat industry and mainly the poultry industry, very few studies evaluating the antibacterial activity of propolis against this pathogen were carried out. Other studies also showed antimicrobial activity against this pathogen. Our values were similar to those of Marghitas et al. 82 (7–17 mm). Kacániová et al. 83 reported lower values (4–6.33 mm), whereas Ding et al. 75 and Shehata et al. 54 analyzed propolis with higher antimicrobial activity against L. monocytogenes (9.90–21.58 mm). The antibacterial activity of North East Spain propolis seemed to be related with flavonoids and not related with the compounds responsible for most antiradical activities (TEAC, ORAC, and AOA).
CONCLUSIONS
The yield and TPC for PEE were higher than for PME. In contrast, methanol proved to be a better extractant agent for ascorbic acid.
DPPH antiradical activity, as well as antimicrobial activities, seemed to be related with phenols and flavonoids, while TEAC, AOA, ORAC, and anti-inflammatory activity seemed to be more related with other compounds. Therefore, the significant amounts of phenolic compounds exhibited by North East Spain propolis contributed to enhance their antiradical activities, as well as their possible anti-inflammatory activity. Nevertheless, apart from phenolics and ascorbic acid, other compounds could be also responsible for the potential biological activities of propolis. These results show that propolis is a promising bee product for both pharmaceutical and food industries.
The antimicrobial activity against L. monocytogenes indicated that propolis can also be successfully used against this microorganism in the food industry, especially in the poultry sector, either as an additive or as part of smart packaging.
Footnotes
Acknowledgment
The research work has been supported by the Gobierno de Aragón (grant Grupo AESA). The authors thank the beekeepers for providing the propolis samples for this study.
Data Availability
All data generated or analyzed during this study are included in this published article (and its supplementary information file).
Authors’ Contributions
Conceptualization: S.M.O., M.T.S., S.B., R.L., and M.A.F.-M.; methodology: A.R.-F., R.L., S.B., S.M.O., M.T.S., and M.A.F.-M.; software: S.B. and S.M.O.; validation: A.R.-F., M.T.S., and R.L.; formal analysis: A.R.-F. and R.L.; investigation: A.R.-F., R.L., S.B., S.M.O., M.T.S., and M.A.F.-M.; resources: S.M.O.; data curation: S.M.O. and M.T.S.; writing—original draft preparation: M.A.F.-M., M.T.S., R.L., and S.M.O.; writing—review and editing: M.A.F.-M., M.T.S., R.L., and S.M.O.; visualization: M.A.F.-M.; supervision: S.M.O. and M.A.F.-M.; project administration: S.M.O., R.L., S.B., and M.T.S.; funding acquisition: M.T.S. All authors have read and agreed to the published version of the article.
Author Disclosure Statement
The authors declare no conflict of interest.
Funding Information
This research received no external funding.
Supplementary Material
Supplementary Figure S1
Supplementary Table S1
References
Supplementary Material
Please find the following supplemental material available below.
For Open Access articles published under a Creative Commons License, all supplemental material carries the same license as the article it is associated with.
For non-Open Access articles published, all supplemental material carries a non-exclusive license, and permission requests for re-use of supplemental material or any part of supplemental material shall be sent directly to the copyright owner as specified in the copyright notice associated with the article.
