




Abstract
Exclusive enteral nutrition (EEN) is highly effective in achieving remission and improving nutritional status in pediatric Crohn’s disease (CD), commonly associated with altered body mass composition (BC). Bioimpedance analysis (BIA) with phase angle (PA) assessment is a noninvasive, reliable tool in screening for BC alterations. In the present study we aimed to assess the PA’s usefulness in the detection of malnutrition in newly diagnosed pediatric CD, ongoing EEN treatment, and during 1-year follow-up. Patients and study design: Fourty-three patients with CD, qualified for EEN, were enrolled in the study. Additionally, 22 healthy children, being in the same age category, served as controls. Fat-free mass (FFM), fat-free mass index (FFMI), and BIA-derived PA were assessed at diagnosis, after EEN completion, and at week 52. The same parameters were obtained in the control group once. The majority of patients presented with normal body mass index at diagnosis. PA values were lower than 5 degrees in 65% of the study group. FFMI deficiencies were observed in 74% of patients. After EEN completion, an increase in FFM (P < .001) was observed. The highest mean of FFM (P < .001) and PA (P < .001) were observed at week 52. A strong correlation between PA and FFM at CD diagnosis (Spearman’s rho = 0.671, r = 0.702, P < .001), after EEN completion (Spearman’s rho = 0.781, P < .00) and at week 52 (Spearman’s rho = 0.657, P < .001) was present. PA has been observed as positively associated with albumin concentrations both at diagnosis and after EEN. Our study provides some support that PA may be a reliable tool for screening alteration in BC, especially FFM and lean tissue mass (LTM). Moreover, PA has been observed as positively associated with albumin levels at CD diagnosis, which provides some evidence that it may be considered as a risk indicator of malnutrition and protein deficiency in newly diagnosed CD pediatric patients.
INTRODUCTION
Malnutrition is common in both pediatric and adult patients with Crohn’s disease (CD), particularly in an active phase of the disease, and is an important clinical issue, being correlated to an increased risk of infections, complications, and poor prognosis. 1 In addition to intestinal inflammation, many factors can contribute to the development of malnutrition, including common symptoms of CD such as diarrhea, nausea, vomiting, poor food intake, and maldigestion. 2 Basic nutritional screening using only anthropometric parameters such as body mass index (BMI) may provide inadequate assessment of body composition and misdiagnosis of malnutrition. Bryant et al., in their systematic review, indicated that only 5% of IBD patients were identified as being underweight when using BMI criteria, but nearly one-third of CD patients presented with altered body mass composition (BC) characterized by reduced body mass index (BMI), fat-free mass (FFM), and fatty mass (FM). 3
Bioelectrical phase angle (BIA) is a simple, noninvasive diagnostic tool, which allows one to assess BC with the use of electrical resistance of human tissues, through which low-voltage current is passed. 4 –6 In a three-compartment model, BC is divided into fat mass (FM), lean tissue mass (LTM) and total body water (TBW), which enables the calculation of FFM and FFMI. BIA is based on the measurement of two components of total body impedance: resistance (R) and reactance (Xc), combining these factors with anthropometric variables (weight and height), sex, and age to estimate body compartments using prediction equations. The resistance causes a voltage drop, while reactance influences the current phase shift, which is represented in a vector manner by PA. PA values in a healthy population are within the range of 5–7 degrees. Lower values are found in the case of malnutrition and chronic diseases. 7,8 PA is strongly recommended by the European Society for Clinical Nutrition and Metabolism (ESPEN) as a prognostic measure of malnutrition. 9,10 At the time of CD diagnosis, alteration in BC is often found, mainly expressed by LTM and FFM deficiencies leading to growth retardation, pubertal delay, and decreased bone mineral density.
Exclusive enteral nutrition (EEN), is recommended as the primary treatment for inducing clinical remission in children and adolescents with mild to moderate active luminal CD, with a high rate of response and mucosal healing. 11 It also provides superior results to steroids with minimal side effects, additionally resulting in weight gain and improvement of nutritional status and quality of life. 11 –13 This therapy consists of exclusive administration of a liquid, usually polymeric, formula that covers 100% of the patient’s energy requirements with the exclusion of all other dietary sources. The formula can be taken orally or by nasogastric tube. The duration of EEN varies between 6 and 12 weeks, with a gradual reintroduction of processed food following this period.
The aim of this study was to evaluate the usefulness of PA in detecting malnutrition in newly diagnosed children with CD and to assess nutritional status using BMI, FFM, FM, and BIA-derived phase angle in these patients after completion of EEN and after 1 year of follow-up. Additionally, to show the impact of EEN on BC, the data were compared with the control group.
Patient population and methods
A total of 43 pediatric patients aged 7–17 (14.4 ± 3.7 IQR) years hospitalized at the Department of Pediatrics, Gastroenterology, and Nutrition, University Children’s Hospital in Cracow, with newly diagnosed, mild to moderate luminal CD, were enrolled in the prospective, observational study compared with a control group. The controls were 22 healthy children, being in the same age category, without any gastrointestinal or nutritional disorders.
CD diagnosis was based on the modified Porto criteria, disease localization and phenotype were assessed in accordance with the Paris classification. 14,15 Pediatric Crohn’s Disease Activity Index (PCDAI) was calculated. 16 Children were eligible for the study if they were qualified for a 6-week course of EEN with a polymeric diet, administered orally or via nasogastric tube, according to patients’ preferences and tolerance. Basic caloric requirements were calculated using the Schofield equation and amounted to 120–130% of resting energy expenditure. 17 Bioimpedance analysis of BC was performed using the bioimpedance analyzer BIA 2000 Mz (Bianostic—AT, Germany) with a multifrequency option (1, 50, 100 Hz) and a current voltage 0.8 mA. Nutri-4 (Data Input, GmbH, Germany) software was used to assess TBW (with FFM, FFMI calculation), FM, FMI, LTM, and PA. There were no ascertained standardization criteria for body composition (BC) measurements. The following criteria have been settled to eliminate measurement bias: measurement taken in the morning, before breakfast, fasting, wearing light first-layer clothing only, bare feet, lying horizontally, and limbs abducted in the same way (angle approximately 30 degrees). Subjects should be presented with no signs of dehydration.
Results were compared to the reference flow charts. 15 –22 All parameters were obtained three times in the study group (at diagnosis, after EEN completion, and at week 52) and once in controls. Anthropometric measurements with BMI calculation, standard laboratory tests (C-reactive protein, erythrocyte sedimentation rate, albumin concentration), as well as fecal calprotectin were performed thrice in the CD population and once in the control group.
The study obtained approval from the Jagiellonian University Bioethics Committee, no. KBET/298/B/2012.
Sample size
As we decided to assess the usefulness of PA in detecting malnutrition by the comparison of PA with other BC parameters, the consideration of the sample size was based on the estimations provided by Wallen & Fraenkel showing 30 cases to be the minimum for a correlational study. We have decided to double, at least, the sample. To get a broader span of the subject’s BC characteristics, children with and without CD were recruited. As there were also other objectives of the study presented with the main interest focused on the children diagnosed with CD, the recruitment allocation ratio was 2:1.
The study subjects were recruited at the University Hospital in Krakow. There were consecutive patients referred by GPs. The treatment for CD in children is offered to all required children and is not limited to some districts. Consequently, the study sample included children from the majority of areas in Poland. There were also no special limitations for controls.
Statistical analysis
Continuous variables were presented as mean and standard deviation or median and quartiles as appropriate to the data distribution. Categorical variables were presented as percentages. The Shapiro-Wilk test was used to assess the normality of continuous variables, and afterward Mann–Whitney U test. Linear dependence between variables for normally distributed variables was described by the Pearson correlation coefficient (Pearson’s r); for non-normally distributed variables, Spearman’s rank correlation coefficient (Spearman’s rho) was used. Additionally, to compare PA with albumin concentration (which was among the main interests in our research), we used the Passing-Bablok regression models. This is a robust, nonparametric method considered to be useful when two measurements are measured with some error. The regression coefficients with 95% confidence intervals (95% CI) have been presented. Statistical analysis was performed with STATA Statistics/Data Analysis v.13.1 (StataCorp, College Station, Texas, USA). Two-sided P-values <.05 had been considered statistically significant.
RESULTS
43 children (23 boys, 20 girls), with newly diagnosed CD, qualified for EEN for induction of remission treatment and were enrolled in the study. All patients completed a 6-week course of EEN. One-year follow-up measurements were performed in 38 children at week 52 after enrollment into the study. Three patients required therapy intensification, two children moved out and changed treatment centers. The characteristics of CD patients are shown in Table 1.
The Baseline Characteristics of the CD Pediatric Population
AZA, azathioprine; BMI, body mass index; CD, Crohn’s disease; Crohn’s disease localization in accordance with the Paris classification (B1—nonstricturing/nonpenetrating CD; B2—stricturing CD; B3, penetrating CD; G 0, no evidence of growth delay; G 1—growth delay; L1—terminal ileal/limited cecal; L2—colonic; L3—ileocolonic; L4a—upper disease proximal to ligament of Treitz; L4b—upper disease distal to ligament of Treitz and proximal to distal 1/3ileum; p—perianal disease); IFX, infliximab; IQR, interquartile range; MP, mercaptopurine; MTX, methotrexate; n, number of patients; PCDAI, Pediatric Crohn’s Disease Activity Index; SD, standard deviation.
The majority of patients (27, 63%) presented with normal BMI, concomitantly showing lowered FFM and FFMI in comparison to reference values. FFM beneath 5 centiles was found in 23 (54%), FFMI in 32 (74%) patients. The majority of patients did not reveal FM deficiency. FM, FMI beneath the 5 centile, was observed in 3 (7%) of the children in the studied group. In 28 (65%) CD patients, PA values were lower than 5 degrees and did not exceed 7 degrees in any patient.
The comparable analysis of the CD group with the control group did not reveal significant changes in baseline BC values (Table 2).
Body Mass Composition Parameters in the Newly Diagnosed CD Group and in the Control Group
FFM, fat-free mass; FFMI, fat-free mass index; FM-fat mass; FTI, fat mass index; LTI, lean tissue mass index; LTM, lean tissue mass; ns, not statistically significant; p, statistical significance indicator; PA, phasal angle; TBW, total body water.
PA strongly correlated with FFM (Sperman’s rho = 0.671, P < .001), LTM (r = 0.728, P < .001), and LTI (r = 0.814, P < .001), concomitantly showing no correlation (P > .05) with FM and FMI. PA has been observed as positively associated with albumin concentrations (Fig. 1).
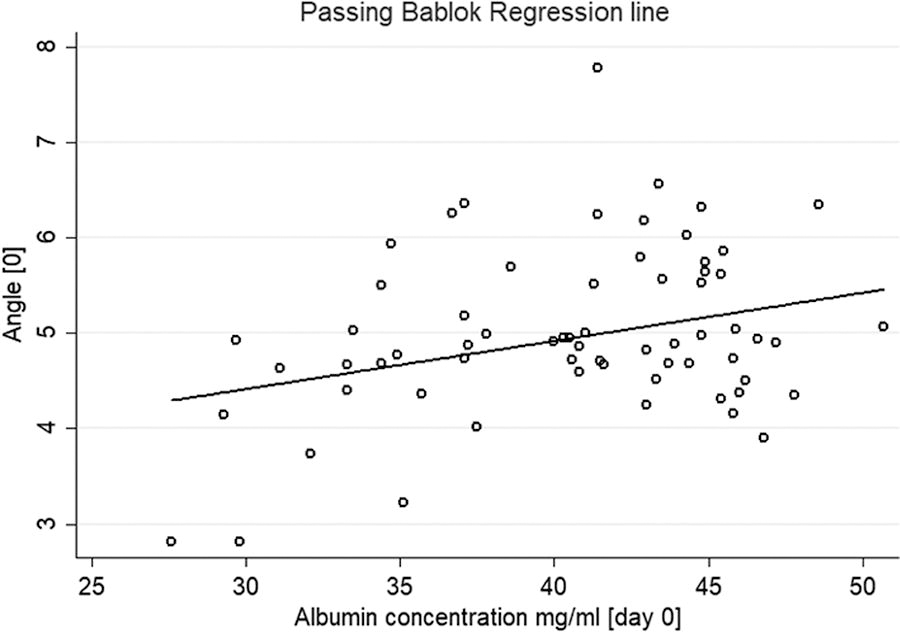
Association between PA and albumin concentration at CD diagnosis. CD, Crohn’s disease; PA, phase angle.
BC after EEN completion
With EEN induction therapy, clinical remission (PCDAI <10 points) was achieved in 35 (81%) patients and clinical response (PCDAI <12) in 4 (9%) children. Regardless of achieving remission, improvement in nutritional status was observed in 41 children.
EEN had an impact on the increase in FFM (P < .001), LTM (P = .003) and FM (P < .001) (Table 3). In accordance with the reference values, the percentage of patients with FFM below the 5 centile decreased (33% vs. 53%), the majority of children, 27 (63%) presented with both FFM and FM between 5th and 84th centile. No patient had FM below the 5th percentile.
Body Mass Composition Parameters in CD Group at Diagnosis and After EEN Completion
Body Mass Composition Parameters After EEN Completion and at Week 52
PA strongly and positively correlated with several BC variables, as FFM (Spearman’s rho = 0.781, P < .001), TBW (Spearman’s rho = 0.787, P < .001) LTM (Spearman’s rho = 0.804; P < .001), FFMI (Spearman’s rho = 0.679, P < .001) and LTI (Spearman’s rho= 0.758, P < .001) and additionally with FM (Spearman’s rho = 0.578, P < .001).
The association between PA and albumin concentrations were even stronger than at the beginning of the EEN (Fig. 2). The correlations were independent of achieving CD remission.
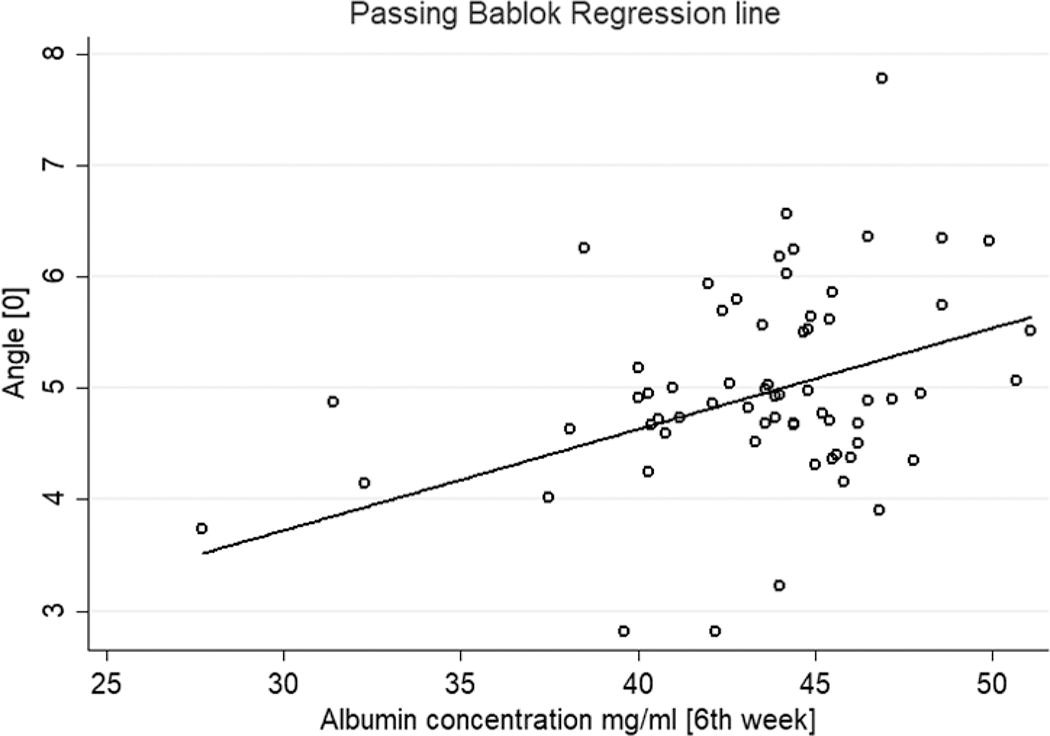
Association between PA and albumin concentration after EEN.EEN, exclusive enteral nutrition.
One year follow-up
There were 37 children who completed 52 weeks of follow-up (Table 4).
At week 52, the highest mean values of FFM (P < .001) and LTI (P < .001) were observed (Tbl.4). FFM values between 5th and 84th centile were present in 23 (61%) of CD patients, in relation to the reference flow charts. The percentage of FM between 5th and 84th centile was constant through the follow-up and occurred in 24 (63%) children, only one child (3%) presented with FM beneath the 5th centile.
PA values reached the highest level in the entire study and were statistically different from values after EEN completion (5.41° vs. 5.01°, P < .001), positively correlated with LTM (Spearman’s rho = 0.657, P < .001), FFMI (Spearman’s rho = 0.766, P < .001) and LTI (Spearman’s’ rho = 0.788, P < .001), concomitantly showing no correlation with FM and FMI.
DISCUSSION
In the present study, the majority of newly diagnosed children and adolescents with CD had a normal BMI (63%), while also exhibiting changes in BC, most with FFM deficiency (41%) and decreased PA values (65%). Similarly, most publications in the IBD population have reported decreased FFM with normal FM. 23 –26 FFM deficiencies may result in decreased mineral bone density, leading to a decrease in peak bone mass and osteoporosis in adulthood.
Reduced LTM correlates with weaker muscle strength and higher susceptibility to infections. 27,28 PA is proportional to the mass of the body cells and depends on the potential of the cell membrane. In a healthy population, its values are in the range of 5–7 degrees. Lower values may suggest higher permeability of membranes, disturbances in their integrity, and depletion in energy storage. 29,30 Nagano et al., found lower PA values in malnourished children compared to the healthy population. 31 In adults, correlations have been found between PA and the severity of chronic diseases (cirrhosis, anorexia, cancer, circulatory failure, neurological diseases) nutritional status, and albumin concentrations. 32 –35 PA may be an indicator of an increased risk of complications after surgery and may be used as a marker of the effectiveness of nutritional interventions. 36 –38 In the present study, the comparable analysis of the CD group with the control group did not reveal significant changes in baseline BC values. PA correlated with FFM and LTM and was positively associated with albumin concentrations while showing no correlation with FM. In a study by Werkstetter et al.,39 pediatric patients with IBD had reduced PA values compared to controls both at diagnosis and after induction of remission induction. 28 Similarly, Więch et al. observed reduced PA in both pediatric patients with CD and UC pediatric patients. 38 At the end of EEN, an increase in LTM (P = .003), FFM (P < .001) and FM (P < .001) was observed. The effect of the EEN on BC was independent of remission. Our results are consistent with other publications. Azcue et al., observed an increase in body weight and LTM after 5–6 weeks of enteral nutrition. 39 Khoshoo et al.demonstrated similar results in children with CD. 40 In most studies, BC normalization was achieved independently of remission; however, Gerasmidis et al. reported LMT normalization only in patients achieving remission. 24 After the end of EEN, lower PA persisted, which is consistent with other publications. 28 PA positively correlated with LTM and FFM, regardless of CD remission achieved. After 1 year of follow-up, the highest median LTM (P < .001) and FFM (P < .001) were observed, which may be due to the fact that most patients remain in remission, and the natural tendency to increase FFM with age. The percentage of FM between the 5th and 84th percentiles did not differ over time. FFM deficiency was still present in 40% CD patients, while FM deficiency was present in only 3%. There is limited data on BC changes over a period of time. Sylwester et al. found FFM deficiencies with concomitantly increase in FM in 2-year time observation in children with CD. 41 Similarly, in a study by Valentini et al., persistent of deficiencies in cell mass (FFM component) was present even in remission. 42 In contrast, Więch et al., reported an increase in both FM and FFM in children with IBD after 1-year follow-up. 25 Lower LTM, FFM may be persistent due to the activity of proinflammatory cytokines (IL-1, TNF-α) and changes in resting energy expenditure. Azcue et al. reported that in children with CD, RRE did not decrease in response to weight deficiency, and the degree of decrease in LTM correlated with RRE disturbances. 39 In the present study, after 1-year of follow-up, PA values reached their highest level and differed from those at the end of the EEN (<0.001). Our study, however, is not free from some limitations. First is the sample size, as the inclusion of a higher number of patients would increase statistical power. Second is the reliability of measurements. The prediction algorithms used for BC measurements estimated by bioelectrical impedance were validated for students and adults 43 but not for children, which may lead to some error. The main interest of our study was to relate PA to other BC measurements and albumin concentration as well as to compare the CD group with healthy. All the measurements were done using the same equipment and the same procedure standardization; therefore, we believe, we were able to achieve accuracy, which was high enough to support the results and our conclusions. It should be noted, however, that clear, effective measurement standards (including patient preparation and measurement taking) should be established and widely recommended. Finally, in our study, 37 out of 43 children completed the 52 weeks of follow-up, which might lead to some selection.
In summary, our study provides some support that PA may be a reliable tool for screening alteration in BC, especially FFM and LTM. Moreover, PA has been observed as associated with albumin levels in CD at diagnosis, which provides some evidence that PA may be considered as a risk indicator of malnutrition and protein deficiency in newly diagnosed CD pediatric patients.
Footnotes
AUTHOR DISCLOSURE STATEMENT
The authors have no conflicts of interest to declare.
Authors’ Contributions
A.W. Conceptualization, Methodology, Investigation, Writing. A.G. Software, Validation. A.G. Methodology, Formal analysis. D.D. Resources, Project administration. K.F. Visualization, Supervision. M.S. Writing—Review & Editing, Visualization, Supervision. P.T. Resources, Data Curation, Formal analysis.
Funding Information
This research was supported by the statutory funds of the Jagiellonian University Medical College, Cracow, Poland: K/DSC/002096.