




Abstract
Biological polyunsaturated fatty acids (PUFAs) are important precursors of secondary messengers that modulate inflammatory responses, cellular growth, and cholesterol metabolism. The optimal n-6/n-3 ratio is extremely important for maintaining normal homeostasis because n-3 and n-6 PUFAs are competitively metabolized. To date, a widely accepted analytical method to determine the biological n-6/n-3 ratio is gas chromatography-mass spectrometry (GC-MS) on dried whole blood samples. However, this technique has several drawbacks, including the intrusive nature of collecting blood samples, high expenses involved, and length of time required to use the GC/MS instrument. To overcome these limitations, we introduced Raman spectroscopy (RS) to distinguish PUFAs present in the epididymal adipose tissue (EAT) isolated from experimental rats that were fed three different high-fat diets (HFDs) with multivariate analysis, including principal component analysis (PCA) and linear discriminant analysis (LDA). The diets comprised HFD, HFD + perilla oil (HFD + PO [n-3 rich oil]), and HFD + corn oil (HFD + CO [n-6 rich oil]). This method allows for quantitative, label-free, noninvasive, and rapid monitoring of biochemical changes in the EAT with high sensitivity. In RS, the Raman bands of the EAT from three different diet groups (HFD, HFD + PO, and HFD + CO) detected and distinguished peaks at 1079 (C–C stretching vibration), 1300 (CH2 deformation), 1439 (CH2 deformation), 1654 (amide I), 1746 (C = O stretching vibration), and 2879 cm−1 (–C–H stretching vibration). The PCA-LDA analysis results showed that PUFAs in the EAT of animals receiving the three different dietary interventions can be determined according to the three groups (HFD, HFD + PO, and HFD + CO). In conclusion, we investigated the possibility of determining PUFA profiles in specimens using RS.
Consumption of polyunsaturated fatty acids (PUFAs) is highly important because humans cannot synthesize them. 1 Therefore, PUFAs are classified as “essential” fatty acids that should be obtained from the diet. 2 Among PUFAs, n-3 PUFAs are present in α-linolenic acid-rich resources, such as perilla, flaxseed, and camelina sativa oil. 3 n-6 PUFAs, which arise from linoleic acid, can be found in soybean, sunflower, sesame, and corn oil (CO). 4 The n-6 and n-3 PUFAs are both essential but competitive as they share identical enzymes for their biological metabolism.
Therefore, the relative increase in consumption of n-6 fatty acids may attenuate the final biological products (i.e., eicosapentaenoic acid and docosahexaenoic acid) originating from n-3 PUFA resources. Owing to their essentiality and competitiveness, the intake of a balanced ratio of PUFAs is crucial to maintaining ideal health. 5
Consumption of balanced n-6/n-3 fatty acids is critical to prevent or mitigate pathological events in the cardiovascular systems. 6 –9 Moreover, inflammatory 6,7,9 and endoplasmic reticulum 8 stress may alter n-6/n-3 fatty acids in the blood, potentially causing diseases such as diabetes, 10 cancer, 11 hypertension, 12 arthritis, 13 non-alcoholic fatty liver, 14 and exercise performance. 15 The competitiveness and remarkable biological effects of n-3 and n-6 PUFAs have led authorities to provide intake guidelines for PUFAs. 9 The authorities of Korea and the United States suggest consuming 10–13 and 11–17 g/day of n-3 PUFAs as linoleic acid and 1.2–1.6 and 1.1–1.6 g/day of n-6 PUFAs as α-linolenic acid, respectively.
Precise and rapid analytical methods are required to explore balanced n-6/n-3 fatty acids from individual n-6 and n-3 PUFA contents in total biological fatty acids. Currently, the n-6/n-3 ratio is generally determined using a gas chromatography-mass spectrometry (GC-MS) system in lipids from dried whole blood samples. 6,7,9 After collection, the whole blood samples are treated with boron trifluoride–methanol to generate fatty acid methyl esters. This process of determining the n-6/n-3 ratio is not only invasive (i.e., blood collection) but also tedious and requires trained medical staff. Therefore, alternative noninvasive methods are necessary to assess the n-6/n-3 ratio effectively.
To overcome the limitations of using a GC-MS system for PUFA analysis, we may consider introducing an alternative analytical method called Raman spectroscopy (RS). Natural PUFAs contain acids of ≥18 and even-numbered carbons in the fatty acids. PUFAs are a combination of saturated C–C bonds and unsaturated C = C bonds with diversity depending on the total length and inversion. Hence, the distinguishable sensitivity for fatty acid saturation/unsaturation by RS will be the rate-limiting factor in determining the n-6/n-3 ratio in biological samples.
Olsen et al. 16 distinguished various types of fatty acids from the collected, homogenized, and minced back sides of the white adipose tissue (WAT) in pork. The RS technique applied by Olsen et al. is very promising, with relatively fewer procedures and significantly less time compared with a GC-MS system; however, numerous preparative procedures, including melting and homogenization of WAT, are still mandatory. 16
In this exploratory study, we aimed to distinguish the type of PUFAs in the epididymal adipose tissue (EAT) with fewer preparatory procedures than those applied by Olsen et al. before performing RS studies of the samples. 16 Therefore, we analyzed fatty acid profiles from snap-frozen EAT in dietary-intervened Sprague–Dawley rats from our peer-reviewed publication. 7 In our previous study, we demonstrated that partial replacement of saturated fatty acids with either perilla oil (PO) or CO improved insulin sensitivity and decreased lipopolysaccharide-inducible inflammation in the liver and EAT. 7 In this study, after 12 weeks of dietary intervention with three different diets containing three different fatty acids, the ratio of n-6/n-3 PUFAs in the whole blood changed significantly. 7
All of the animal experimental procedures were carefully reviewed and approved by the Dankook University Institutional Animal Care and Use Committee (IACUC No. DKU-19-031). In brief, 48 five-week-old male Sprague–Dawley rats (DooYeal Biotech, Seoul, Korea) were housed and maintained in a light, temperature, and humidity-controlled animal room. 7 The experimental rats were divided into three groups and fed three different diets for 12 weeks: (1) high-fat diet (HFD), (2) HFD + perilla oil (HFD + PO; CJ Cheil Jedang Co., Seoul, Korea), and (3) HFD + corn oil (HFD + CO; CJ Cheil Jedang Co.).
The dietary n-6/n-3 ratio was 0.95 and 62.24 in the HFD + PO and HFD + CO groups, respectively, whereas it was not countable in the HFD group due to the extremely low n-3 content. In addition, the hematological n-6/n-3 ratio was 6.15 ± 0.37, 3.22 ± 0.47, and 16.25 ± 0.66 in the HFD, HFD + PO, and HFD + CO groups, respectively. 7
For RS analysis, EATs from the three different diet groups were placed on glass substrates. Raman spectra were acquired using an XperRam F1.4 (Nanobase Inc., Seoul, Korea) equipped with a 785-nm diode laser source. All Raman spectroscopic measurements were recorded with an exposure time of 10 sec in the range of 500–3000 cm−1. The Raman spectrum of each sample was calculated as the average of 10 measurements at different arbitrary sites on the EAT. Baseline correction was also performed using the rubber band method, and all the baseline-corrected Raman spectra were normalized using the vector normalization method. 17
Principal component analysis (PCA) and linear discriminant analysis (LDA) were used to analyze the multivariate spectral data. PCA and LDA have been widely applied to determine the linear combination of original variables for the best narration of data. However, PCA finds linear combinations of original variables, explaining the variance of data without considering classes, whereas LDA focuses on finding linear combinations of original variables, maximizing the separability between the experimental groups.
In this study, we aimed to distinguish the type of PUFAs (n-3 and n-6) in the EAT after dietary intervention in Sprague–Dawley rats using RS with multivariate statistical analysis. Figure 1A shows the normalized average Raman spectra of EATs from HFD, HFD + PO, and HFD + CO groups. The Raman bands of EATs were characterized by vibrational bands typical of lipids. 18,19 EAT exhibited distinguishable peaks at 1079, 1300, 1439, 1654, 1746, and 2879 cm−1. The noticeable peak at 1079 cm−1 was related to the C–C stretching vibration.
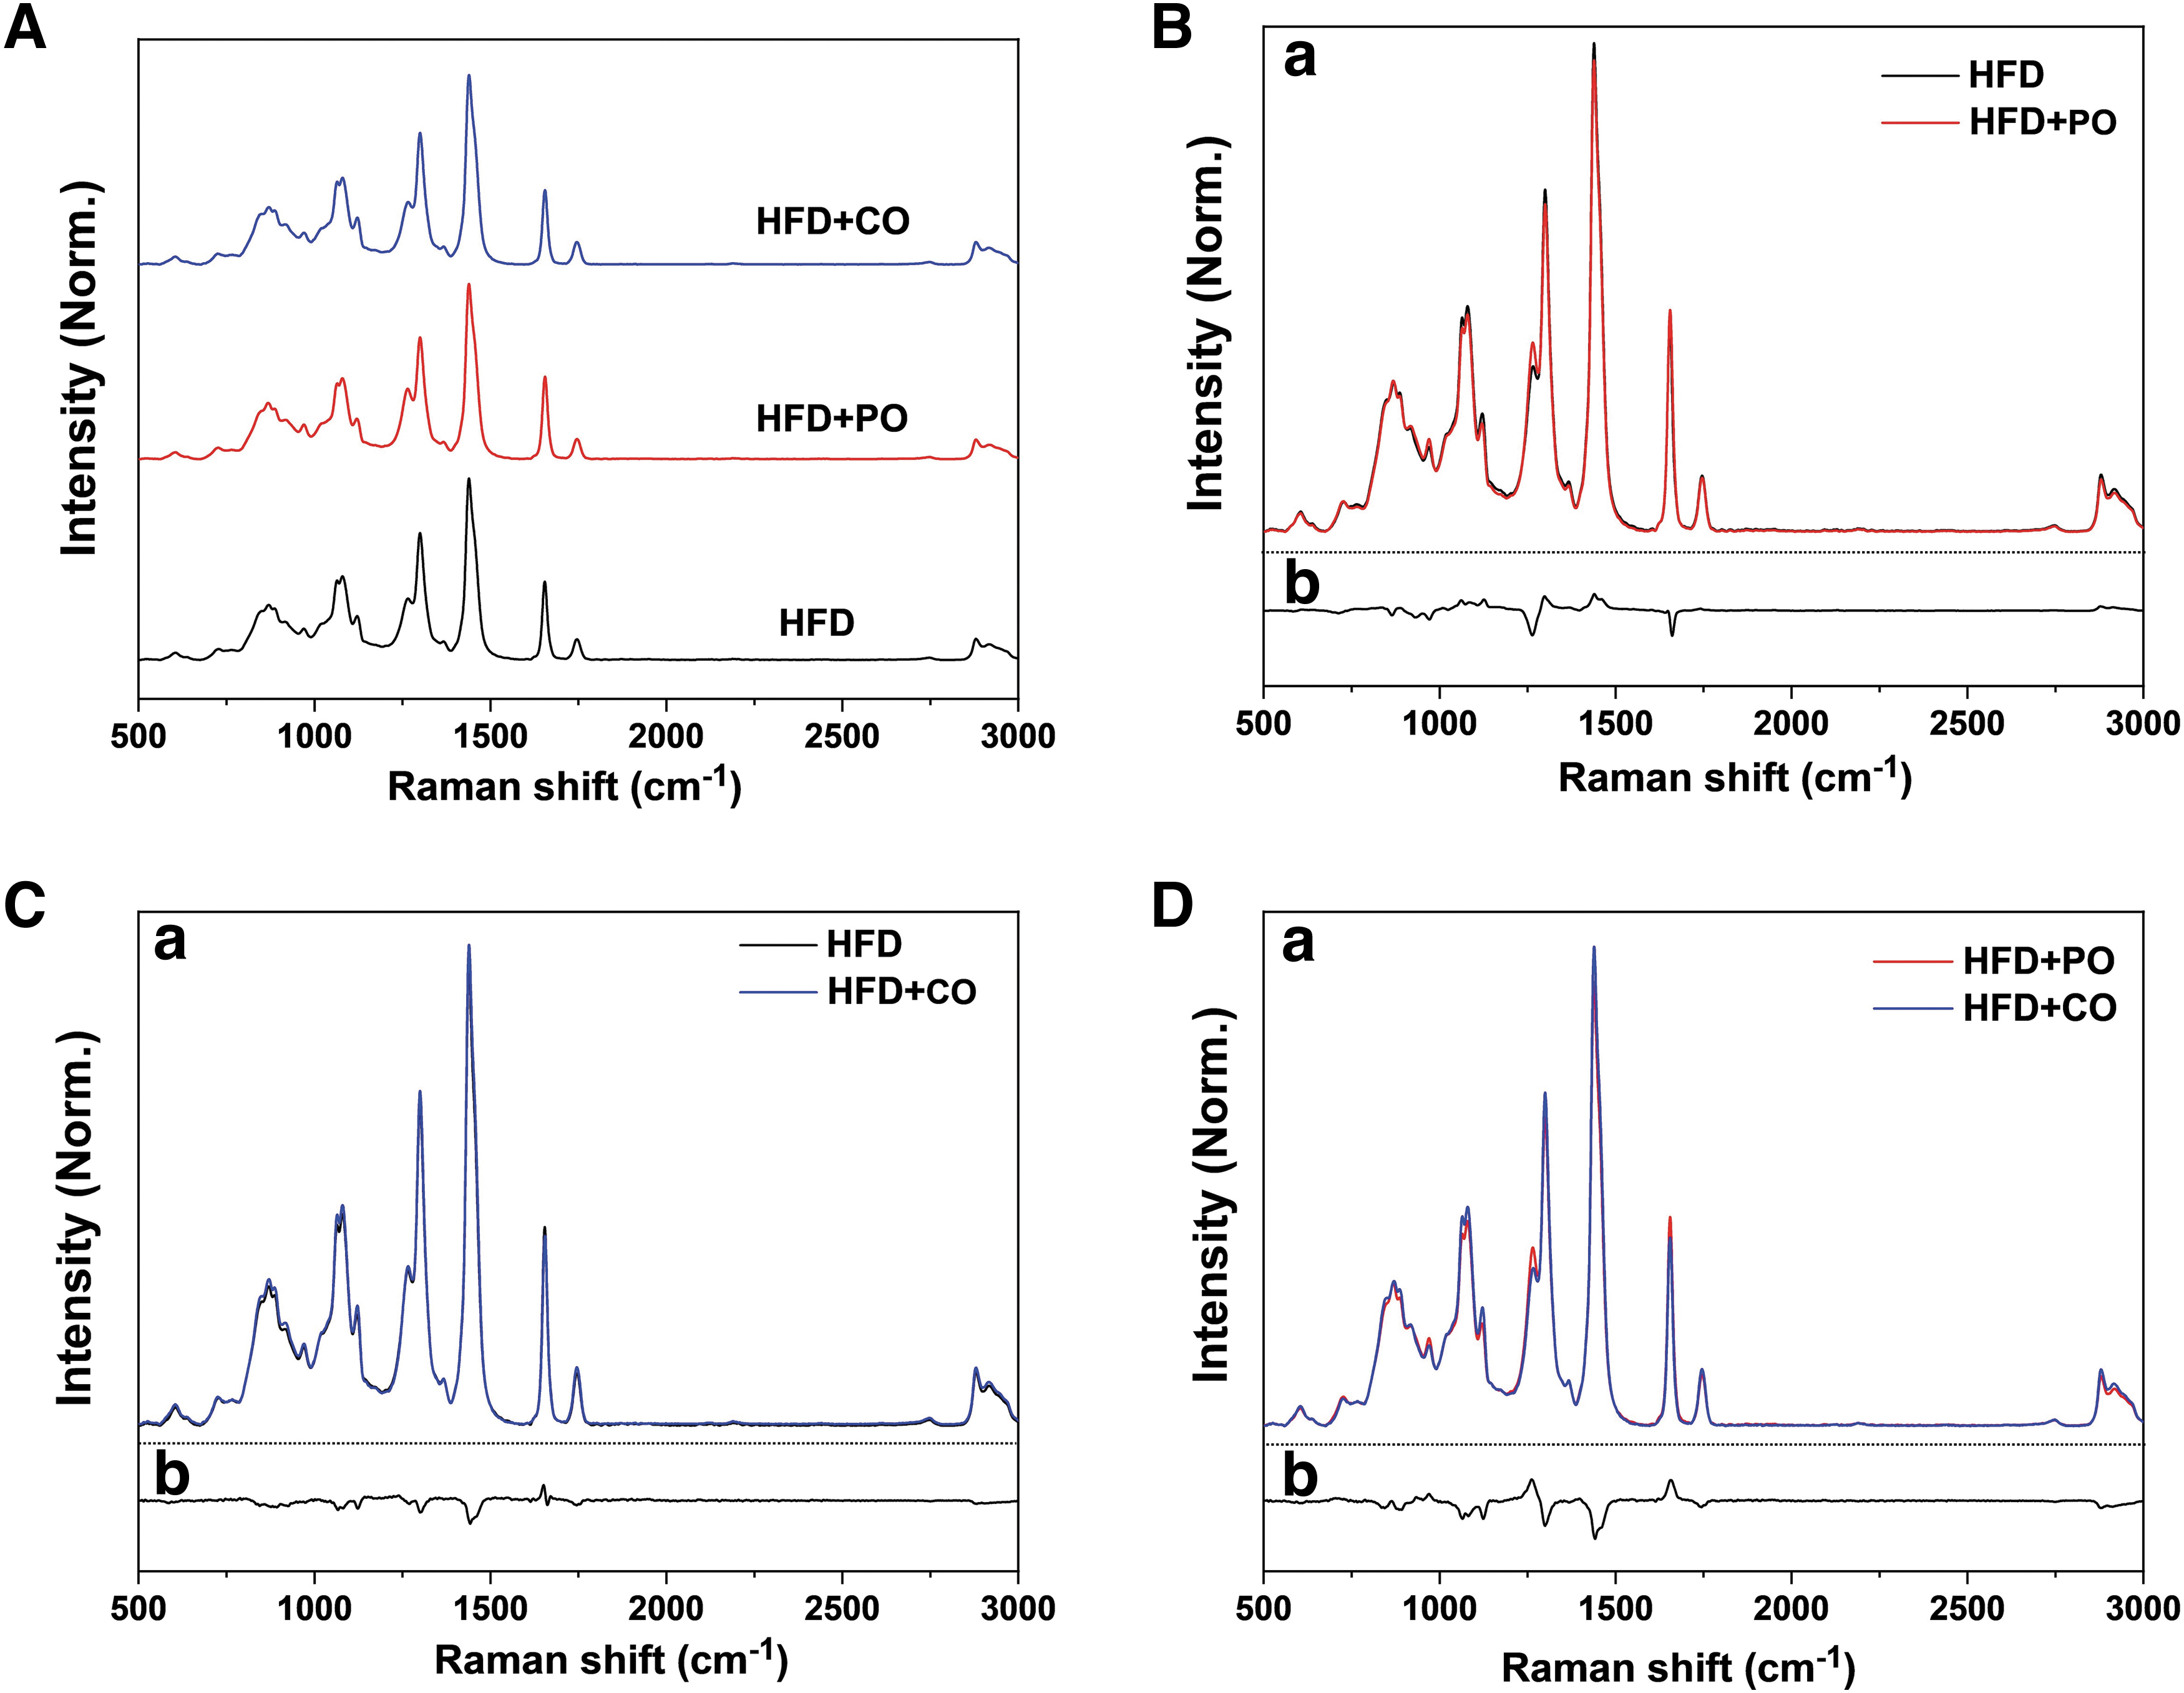
Dietary fatty acid-dependent Raman spectra of the EAT from HFD, HFD + PO, or HFD + CO-fed rats.
The two strong bands at 1300 and 1439 cm−1 were intertwined with –CH2 deformation. The peaks at 1654 and 1746 cm−1 were related to the amide I (α-helix) and C = O stretching vibration, respectively. The minimal peak at 2879 cm−1 represented the –CH stretching vibration. To scrutinize the differences in the spectral profiles more clearly, the differences in the spectra were extracted by subtracting (1) HFD + PO from HFD (Fig. 1B), (2) HFD + CO (Fig. 1C), and (3) HFD + CO from HFD + PO (Fig. 1D).
To identify the distribution of n-3 and n-6 PUFAs in experimental EAT, multivariate statistical techniques, including PCA and LDA, were applied after acquiring Raman spectral data. A score plot of PC1 versus PC2 was obtained from the PCA for the HFD, HFD + PO, and HFD + CO groups (Fig. 2A). From the acquired spectral data, PCA extracts two principal components (PCs) to maximally explain the variance of the data. The two PCs obtained accounted for >92% of the total variance, accounting for 80.4% and 11.8% of PC1 and PC2, respectively. The two PCs were separated into three distinct groups (HFD, HFD + PO, and HFD + CO) for the dietary intervention.
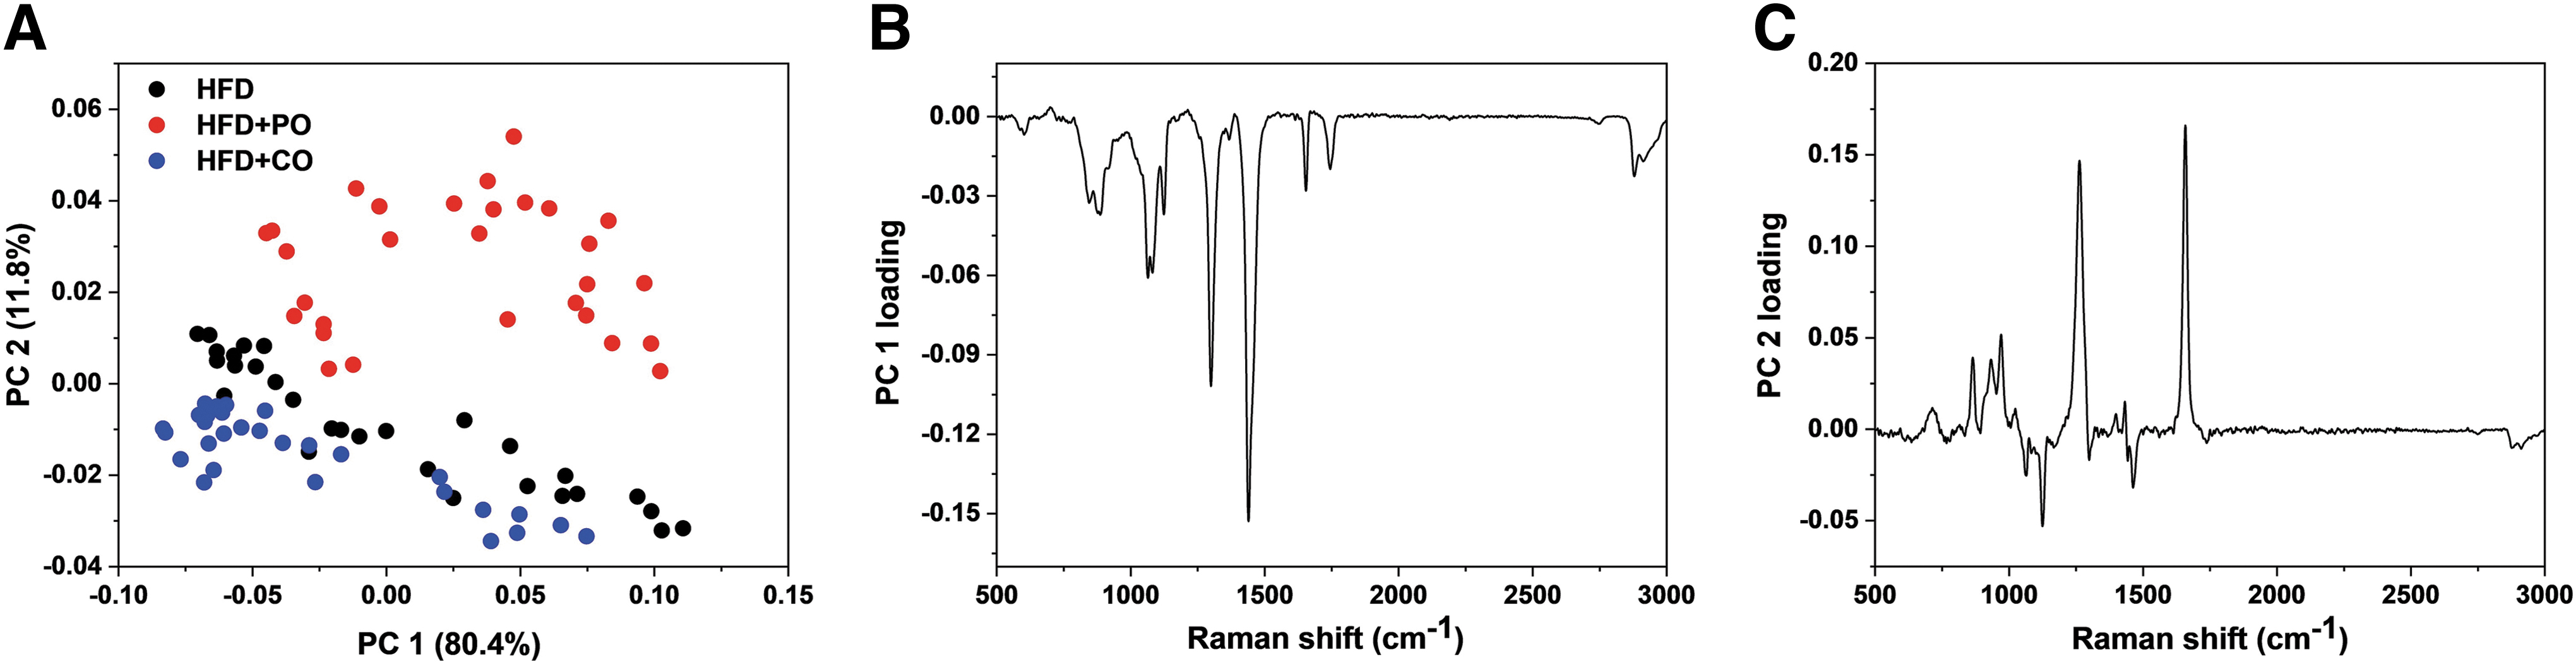
PCA of Raman spectra for the EAT from HFD, HFD + PO, or HFD + CO-fed rats.
To further understand the relationship between the original variables and PCs, PCA loadings were calculated. The types of PUFAs in the EAT were distinguishable using a specific Raman shift in the PCA loadings for PC1 (Fig. 2B) and PC2 (Fig. 2C). The loading of PC1 was dominated at 1081, 1299, 1438, and 1654 cm−1, whereas the loading of PC2 corresponded to 1262 and 1658 cm−1. In addition, LDA was executed to separate the three groups more precisely, and the two LDA features maximized the dispersion between the groups (Fig. 3). The LDA results indicate that RS may be an effective analytical method for classifying PUFA profiles in EAT from the HFD, HFD + PO, and HFD + CO groups.
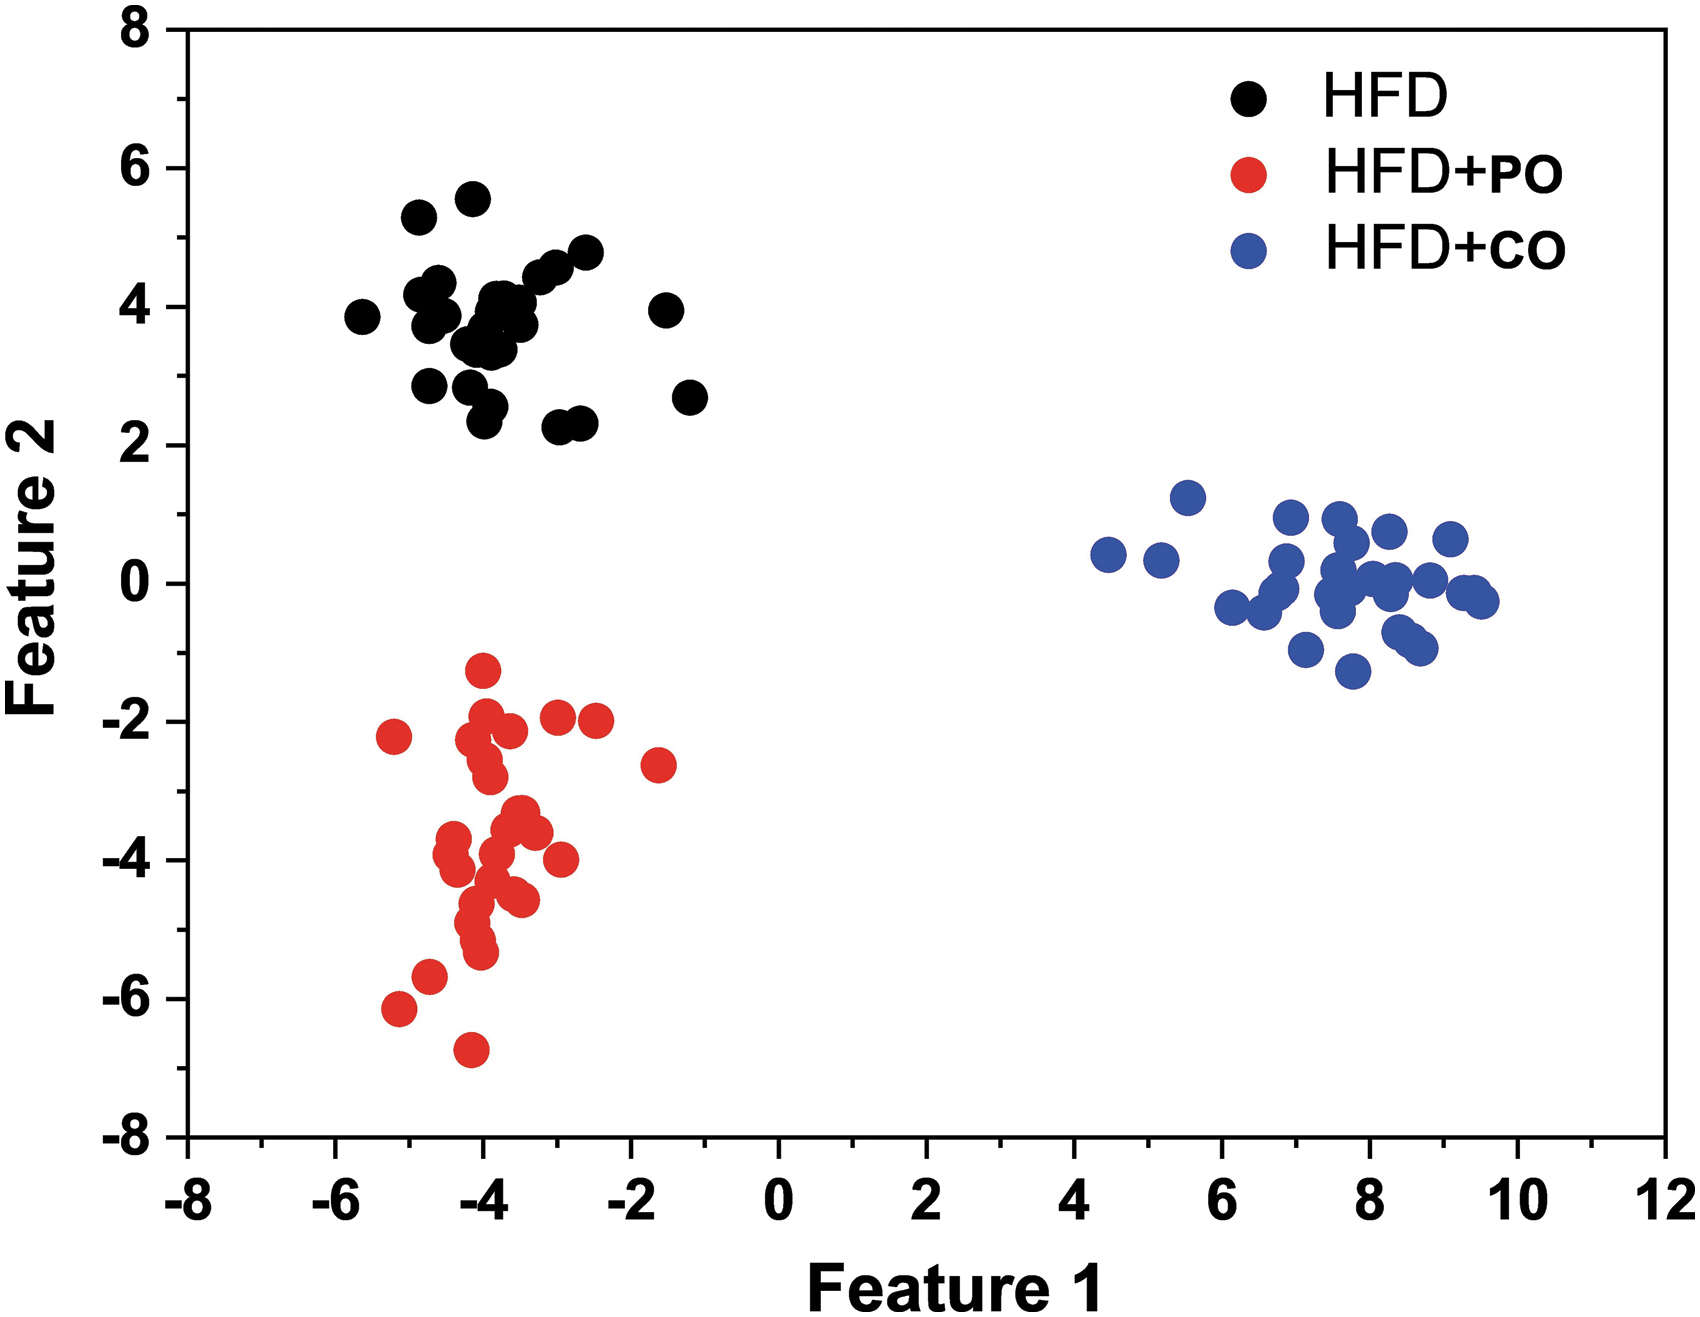
The scatter plot of LDA for the EAT from HFD, HFD + PO, or HFD + CO-fed rats. n = 16 for each group. LDA, linear discriminant analysis.
In this study, we assessed the possibility of determining n-6/n-3 status clinically with noninvasive methods, such as RS. Anatomically, the EAT is located on the posterior surface of the epididymis; therefore, the EAT is targeted as a potential transplant site due to the ease of medical accessibility. 20 Therefore, the EAT may be a useful tissue for determining the n-6/n-3 ratio in humans. Moreover, various fatty acids are distinguishable without invasion using RS in the subcutaneous 18 or the perivascular adipose tissue. 19
Although, in this study, we did not determine the n-6/n-3 ratio from live experimental rodents, RS was a sufficient analytical mean to effectively judge n-3 and n-6 PUFA distribution in the EAT. RS detected distinctive peaks, accounting for the majority of components by PCA and LDA, and separated PUFAs in the EAT. In conclusion, in this study, we provide insights into the determination of PUFA profiles in the EAT using RS in a noninvasive manner.
Footnotes
AUTHORs' CONTRIBUTIONS
G.B.J. contributed to conceptualization, methodology, software, validation, formal analysis, investigation, data curation, writing—original draft preparation, writing—review and editing, and visualization. D.K. was involved in methodology, software, validation, formal analysis, data curation, writing—original draft preparation, and writing—review and editing. E.-C.S. was in charge of conceptualization, methodology, investigation, data curation, writing—original draft preparation, writing—review and editing, supervision, project administration, and funding acquisition. J.-H.H. took charge of conceptualization, validation, investigation, data curation, writing—original draft preparation, writing—review and editing, visualization, supervision, project administration, and funding acquisition. All authors have read and agreed to the published version of the article.
AUTHOR DISCLOSURE STATEMENT
The authors declare no conflict of interests.
FUNDING INFORMATION
No funding was received for this article.