




Abstract
The composition and profile of amino acids in Rubus chingii (R. chingii) Hu serve as critical indicators of its nutritional quality. A comprehensive understanding of the amino acid metabolism within R. chingii is instrumental in the formulation and innovation of functional foods derived from this species. Utilizing advanced techniques such as wide-ranging untargeted metabolomics, transcriptome analysis, interaction network mapping, heat map analysis, and quantitative real-time PCR, we conducted a comprehensive assessment of the quality attributes across four distinct developmental stages of R. chingii. Our meticulous analysis uncovered a rich tapestry of 76 distinct amino acids and their derivatives within the developmental stages of R. chingii. The spectrum of essential amino acids was not only broad but also displayed a high degree of variety. Notably, leucine, lysine, and phenylalanine stood out as the most abundant amino acids, underscoring their significant presence throughout the growth cycle of R. chingii. The proportion of essential amino acids relative to the total amino acid content in R. chingii exhibited a notable trajectory of change throughout its developmental stages. It began with 30.92% in the immature green phase, advanced to 31.04% during the transition from green to yellow, peaked at 33.62% in the yellow to red stage, and then moderated to 30.43% in the full red phase. This pattern suggests a strategic modulation of amino acid composition, aligning with the evolving nutritional requirements and metabolic shifts as the fruit matures. Concurrent analysis of interaction networks and heat maps, alongside comprehensive profiling of amino acid metabolism and transcriptomic examination, was conducted to elucidate the intricate dynamics of cellular processes. The results showed that seven differentially expressed genes (DEGs) played important roles in amino acid metabolism, including PFK, BCAT1, TSB, ASA, ACO, TOM2AH3, and BCAT2. The expression patterns of seven DEGs conformed closely to the findings revealed by the preceding RNA-seq analysis. In this investigation, we elucidated the regulatory mechanisms underlying amino acid metabolism across the four distinct developmental stages of R. chingii through comprehensive amino acid profiling and transcriptomic analysis. These insights lay the groundwork for the development of novel functional food applications utilizing R. chingii.
INTRODUCTION
Rubus chingii Hu (R. chingii), also known as Chinese raspberry, is a robust and resilient perennial within the Rosaceae family, renowned for its robustness and enduring vitality, whose fruit is not only a nutritious food source but also holds significant medicinal benefits. In traditional Chinese medicine, R. chingii has been a staple for centuries, prized for its health-promoting properties. 1 This plant is primarily cultivated in the eastern regions of China, with high concentrations in provinces such as Zhejiang, Jiangxi, Anhui, Jiangsu, and Fujian. 2 It is cherished for its sweet and slightly tart flavor, and its composition of varied bioactive compounds, including polysaccharides, amino acids, flavonoids, terpenoids, sterols, coumarins, alkaloids, phenolic acids, and more. 3 Pharmacological studies have revealed that R. chingii offers an array of modern health benefits, including antitumor properties, antiaging effects, regulation of reproductive health, enhancement of cellular immunity, and assistance with weight management. As a valuable resource with both medicinal and culinary uses, R. chingii is also highly sought after for consumption purposes. Its amino acid, vitamin C, vitamin E, and polysaccharide content make it easily digestible, nutrient dense, and promising for the food industry. 4,5
Amino acids are a vital component of R. chingii and are crucial for their regulatory role within the human body. Proteins, which are active macromolecules, are involved in a variety of biological processes, and amino acids serve as their building blocks and the substrates for protein synthesis. 6 Leucine, aspartic acid, and glutamic acid are the primary amino acids responsible for the flavor of R. chingii, whereas glutamic acid and aspartic acid also contribute to its sweet, sour, and umami tastes. 7 Indispensable amino acids, which the human body lacks the ability to produce, are termed as essential amino acids and can only be acquired through dietary intake. 8 These essential amino acids are necessary for maintaining the body’s stability and facilitating complex enzymatic responses. 9 The eight indispensable amino acids include leucine, isoleucine, valine, lysine, threonine, methionine, phenylalanine, and tryptophan. 10 The majority of phenylalanine within the body is transformed into tyrosine by the action of the enzyme phenylalanine hydroxylase. This conversion, along with the synthesis of tyrosine, is instrumental in the production of critical neurotransmitters and hormones. These biochemical compounds subsequently engage in regulating glucose and fat metabolism within the body. In addition, phenylalanine serves as an intermediate in the production of anticancer drugs, which can alleviate symptoms of Parkinson’s disease, lower blood pressure, regulate gastrointestinal function, alleviate pain, and eliminate functional fatigue of the kidneys and bladder. 11 A deficiency in lysine, threonine, and isoleucine can markedly impede the assimilation and efficacy of other amino acids, potentially culminating in grave maladies. 12,13 Tryptophan can help improve pellagra caused by a deficiency of niacin, as well as regulate nerves, which can be used to improve the symptoms of sleep instability and difficulty falling asleep caused by neurasthenia and autonomic nervous system disorders. 14 The functions of lysine and threonine help enhance people’s absorption of proteins, thereby promoting human development and ensuring adequate nutrient absorption. 15 Isoleucine collaborates with leucine and valine to facilitate muscle repair, regulate blood sugar levels, and supply energy to various body tissues.
The nutritional profile and flavor characteristics of R. chingii are influenced by its diverse amino acid content. However, there is a paucity of research regarding the quality, quantity, and metabolic pathways of amino acids in R. chingii. Advances in analytical techniques, such as untargeted metabolomic and transcriptomic analyses, have significantly contributed to our understanding of food composition and function. We employed these comprehensive methods to investigate the amino acid metabolism in R. chingii throughout its various growth stages. Subsequent to this, we utilized quantitative real-time polymerase chain reaction (qRT-PCR) to meticulously examine the expression levels of key genes instrumental in amino acid biosynthesis. Through the analysis of the amino acid biosynthesis pathway in R. chingii, we have unraveled the regulatory mechanisms governing its fruit’s amino acid biosynthesis. This study lays the groundwork for the innovation of food products incorporating R. chingii.
MATERIALS AND METHODS
Plants and sample preparation
The R. chingii specimens were cultivated on the grounds of Zhejiang Pharmaceutical University in Ningbo, China (29°87’N, 121°55’E), displaying consistent growth patterns and demonstrating resistance to pests and diseases. The fruits of R. chingii were meticulously harvested at four discrete stages of maturity, each representing a unique phase in their ripening process: immature green (GG, April 26th), transitioning from green to yellow (GY, May 16th), changing from yellow to red (YR, May 23rd), and fully ripened red (RR, June 12th). Each sampling session included a collection of at least 10 fruits from 5 to 6 R. chingii trees, which were then combined in equal portions. To ensure accuracy, a minimum of six replicate samples were employed to ensure the robustness and reliability of the data. (consisting of ≥60 fruits in total) were prepared for each R. chingii maturity stage. Following the collection of the samples, they were rapidly chilled in liquid nitrogen to preserve their integrity and subsequently stored at −80°C until they were subjected to untargeted metabolomic and transcriptomic sequencing analyses.
Sample extraction
The samples were processed using a vacuum freeze-drying technique in a freeze dryer. An accurate measure of the sample was meticulously weighed and transferred into a 2 mL centrifuge tube. Subsequently, 600 µL of methanol, containing 4 parts per million (ppm) of 2-amino-3-(2-chloro-phenyl)-propionic acid (which was precisely maintained at −20°C), was incorporated into the container. The resulting solution was then vigorously vortexed for a duration of 30 sec to ensure thorough mixing. Subsequently, 100 mg of glass beads was carefully introduced into the sample, after which the mixture was secured within a tissue grinder. The grinder was then set to operate at a frequency of 60 Hz, and the sample was processed for a duration of 90 sec to achieve the desired homogeneity. Following this, the mixture underwent ultrasound treatment for 15 min at room temperature. Following a 10-min centrifugation at 1200 × g and 4°C, 150 µL of the cleared supernatant was carefully pipetted and passed through a 0.22 µm filter. This filtered sample was then transferred into a dedicated detection bottle, prepared for subsequent liquid chromatography–mass spectrometry (LC-MS) analysis. The samples were kept at −80°C until they were processed further. To ensure quality control, QC samples were created by combining small portions of all individual samples to generate a composite sample.
UPLC-MS/MS analysis
The LC was carried out utilizing the advanced Vanquish UHPLC System (Thermo Fisher Scientific, USA). The separation process was executed on an ACQUITY Ultra Performance Liquid Chromatography (UPLC)® HSS T3 column (150 × 2.1 mm, 1.8 µm) from Waters, Milford, MA, USA, with the column temperature carefully controlled at 40°C to ensure optimal chromatographic performance. The flow rate was set to 0.25 mL/min, and the injection volume was 2 μL. For LC-ESI (+)-MS analysis, the mobile phases were carefully formulated using (C) 0.1% formic acid in acetonitrile (volume/volume) and (D) 0.1% formic acid in water (volume/volume). The separation process was executed using a meticulously designed gradient, which was as follows: 0–1 min, 2% C; 1–9 min, 2%–50% C; 9–12 min, 50%–98% C; 12–13.5 min, 98% C; 13.5–14 min, 98%–2% C; and 14–20 min, 2% C. For LC-ESI (-)-MS analysis, the analytes were separated using (A) acetonitrile and (B) ammonium formate (5 mM) as the mobile phases. The separation gradient was as follows: 0–1 min, 2%A; 1–9 min, 2%–50%A; 9–12 min, 50%–98%A; 12–13.5 min, 98%A; 13.5–14 min, 98%–2%A; and 14–17 min, 2%A. Metabolite detection using MS was conducted on the state-of-the-art Orbitrap Exploris 120 instrument (Thermo Fisher Scientific, USA), equipped with an electrospray Ionization (ESI) source. Simultaneous MS1 and MS/MS (Full MS-ddMS2 mode, data-dependent MS/MS) acquisition was used. The instrumental parameters were optimized as follows: sheath gas pressure set at 30 arb, auxiliary gas flow at 10 arb, spray voltage at 3.50 kV for positive ESI and −2.50 kV for negative ESI, capillary temperature maintained at 325°C, MS1 mass range from m/z 100 to 1000, MS1 resolving power of 60,000 full width at half maxima (FWHM), four data-dependent scans per cycle, MS/MS resolving power of 15,000 FWHM, normalized collision energy at 30%, and dynamic exclusion with an automatic time setting. To guarantee precision and reliability, six biological replicates were utilized at each time point throughout the untargeted UPLC-MS/MS analysis.
Transcriptome sequencing
To isolate the total RNA from R. chingii, we employed the TaKaRa Mini BEST Plant RNA Extraction Kit, a specialized kit from TaKaRa in Beijing, China. The extracted RNA samples were then assessed for concentration and purity using a NanoDrop 2000 spectrophotometer, which is a product of Thermo Scientific based in PA, USA. This step was crucial to verify the quality of the RNA, ensuring the reliability of the subsequent transcriptome sequencing library construction. Subsequently, the Illumina RNA-Seq technique was carried out by PANOMIX Biomedical Tech Co., LTD, located in Suzhou, China. They were responsible for constructing the transcriptome libraries and performing the sequencing. In total, 12 libraries were created, each corresponding to a biological replicate. Subsequently, these libraries were sequenced and meticulously analyzed using the NocaSeq 6000 sequencer, which is an advanced Illumina instrument located in San Diego, CA, USA.
Functional annotation and differentially expressed gene analysis
The processed sequences were matched against several databases, including Swissprot, NR, GO, COG, eggNOG, KEGG, and Pathway, for comparison and analysis. BLAST software was utilized for this comparison. Subsequently, the gene sequences were meticulously aligned within the Pfam database using HMMER software, ensuring accurate annotation of their respective functions. The expression levels of genes were quantitatively represented in units of fragments per kilobase of transcripts per million mapped fragments (FPKM), derived from the counts of the mapped unigenes. To identify differentially expressed genes (DEGs), the DESeq R software package was employed, setting the threshold for fold change at greater than 2 and the P-value at less than 0.05, thereby ensuring the identification of genes with statistically significant expression differences.
Principal component analysis
The expression levels of DEGs within the transcriptome were meticulously analyzed using the state-of-the-art data processing platform provided by GENE DENOVO, ensuring accurate quantification and comprehensive understanding of gene expression dynamics, specifically designed for Principal Component Analysis (PCA). The platform, accessible at http://www.biodeep.cn/ employs advanced algorithms to facilitate the exploration of complex datasets and reveal patterns and trends in gene expression. The analysis was conducted with the default parameter settings, ensuring a robust and reliable exploration of transcriptomic data.
Gene expression trend analysis
Throughout the diverse developmental stages of R. chingii fruits, a comprehensive analysis identified a subset of DEGs that exhibited significant alterations in expression levels. To evaluate the dynamic patterns of gene expression, the FPKM metric was employed, providing a quantitative assessment of the transcript abundance and enabling the characterization of gene expression trends over the course of fruit development. These expression levels were input into the STEM software for comprehensive analysis. Preprocessing of data involved normalization using the log2 transformation of FPKM values. Clustering was conducted using the k-means algorithm, with a minimum threshold of 30 genes for cluster formation. In addition, a P-value test was applied to filter significant expression differences.
Interaction network analysis
The interaction network was meticulously constructed using Pearson’s correlation coefficients, which were calculated within the robust R environment (https://www.r-project.org/). Only correlations with a coefficient of R ≥ 0.8 or R ≤ −0.8, indicating a strong statistical significance, were selected for inclusion in the analysis. Genes that exhibited strong interconnections within this network were designated as hub genes, indicating pivotal roles in the regulatory network based on their co-expression patterns. The relationships between amino acids and DEGs were visualized by https://cloud.metware.cn/. Dynamic network thermography (heat network) was utilized to analyze the correlation between metabolome (amino acids) and transcriptome (DEGs) based on Omic-share data processing platform (https://www.omicshare.com/).
Quantitative real-time PCR
To delve into the functional significance of DEGs within the context of amino acid metabolism, a meticulously chosen subset of these genes was selected for qRT-PCR analysis, focusing on the most promising candidates identified through initial computational screens. To ensure the integrity and quality of RNA samples, total RNA extraction was performed using Trizol reagent, adhering strictly to the manufacturer’s detailed protocol. This methodological approach was chosen for its reliability in yielding high-quality RNA. The quantity of RNA was determined using a NanoDrop ND-2000 spectrophotometer. cDNA synthesis was initiated by converting the extracted RNA into first-strand cDNA using oligo-dT primers and Superscript II reverse transcriptase, also obtained from Invitrogen. The qRT-PCR reactions were then set up on a BioRad CFX96 system, utilizing SYBR Green master mix (SYBR Premix Ex Tag TMII; TaKaRa Bio) for amplification, following the manufacturer’s guidelines provided by TaKaRa Biotechnology. The thermal cycling protocol was initiated with a denaturation phase at 95°C for a duration of 5 min. This was succeeded by 40 amplification cycles, each consisting of a 30-second incubation at 95°C and a 1-min annealing period at 60°C. To ensure the reliability of results, each sample was meticulously assayed in triplicate. The expression levels of mRNA were normalized to the housekeeping gene Actin, serving as an internal standard for accurate quantification. 16
RESULTS AND DISCUSSSION
Amino acid metabolism profiles of R. chingii at different developmental stages
Proteins are the essential organic macromolecules that form the foundation of life, encompassing nearly all biological activities. 17 They are also a diverse category of nutrients that have garnered considerable interest. 18 The intrinsic nutritional value of proteins within plant sources is intricately linked to the diversity and abundance of the amino acids they harbor. Those plants that offer a complete spectrum of essential amino acids are particularly prized for their superior nutritional profile. 19 The detection results of amino acids and their derivatives in different developmental stages of R. chingii fruits using LC-MS/MS showed 76 amino acids and their derivatives (Supplementary Table S1) were identified in R. chingii fruits, including 7 essential amino acids. This included the presence of 7 essential amino acids. The PCA has revealed that the initial two principal components (PC1 and PC2) collectively explain 60.4% of the variability observed within the sample dataset, with PC1 contributing 39.6% and PC2 contributing 20.8% (Fig. 1A). The PCA and intragroup correlation analysis highlighted the considerable variation among the different samples, while also showcasing the high degree of similarity within the biological replicates (Fig. 1B). A similar intragroup correlation analysis for R. chingii at four distinct developmental stages demonstrated marked differences in amino acid profiles. These findings, coupled with the strong correlations observed in the biological replicate samples, adequately fulfill the prerequisites for thorough data analysis
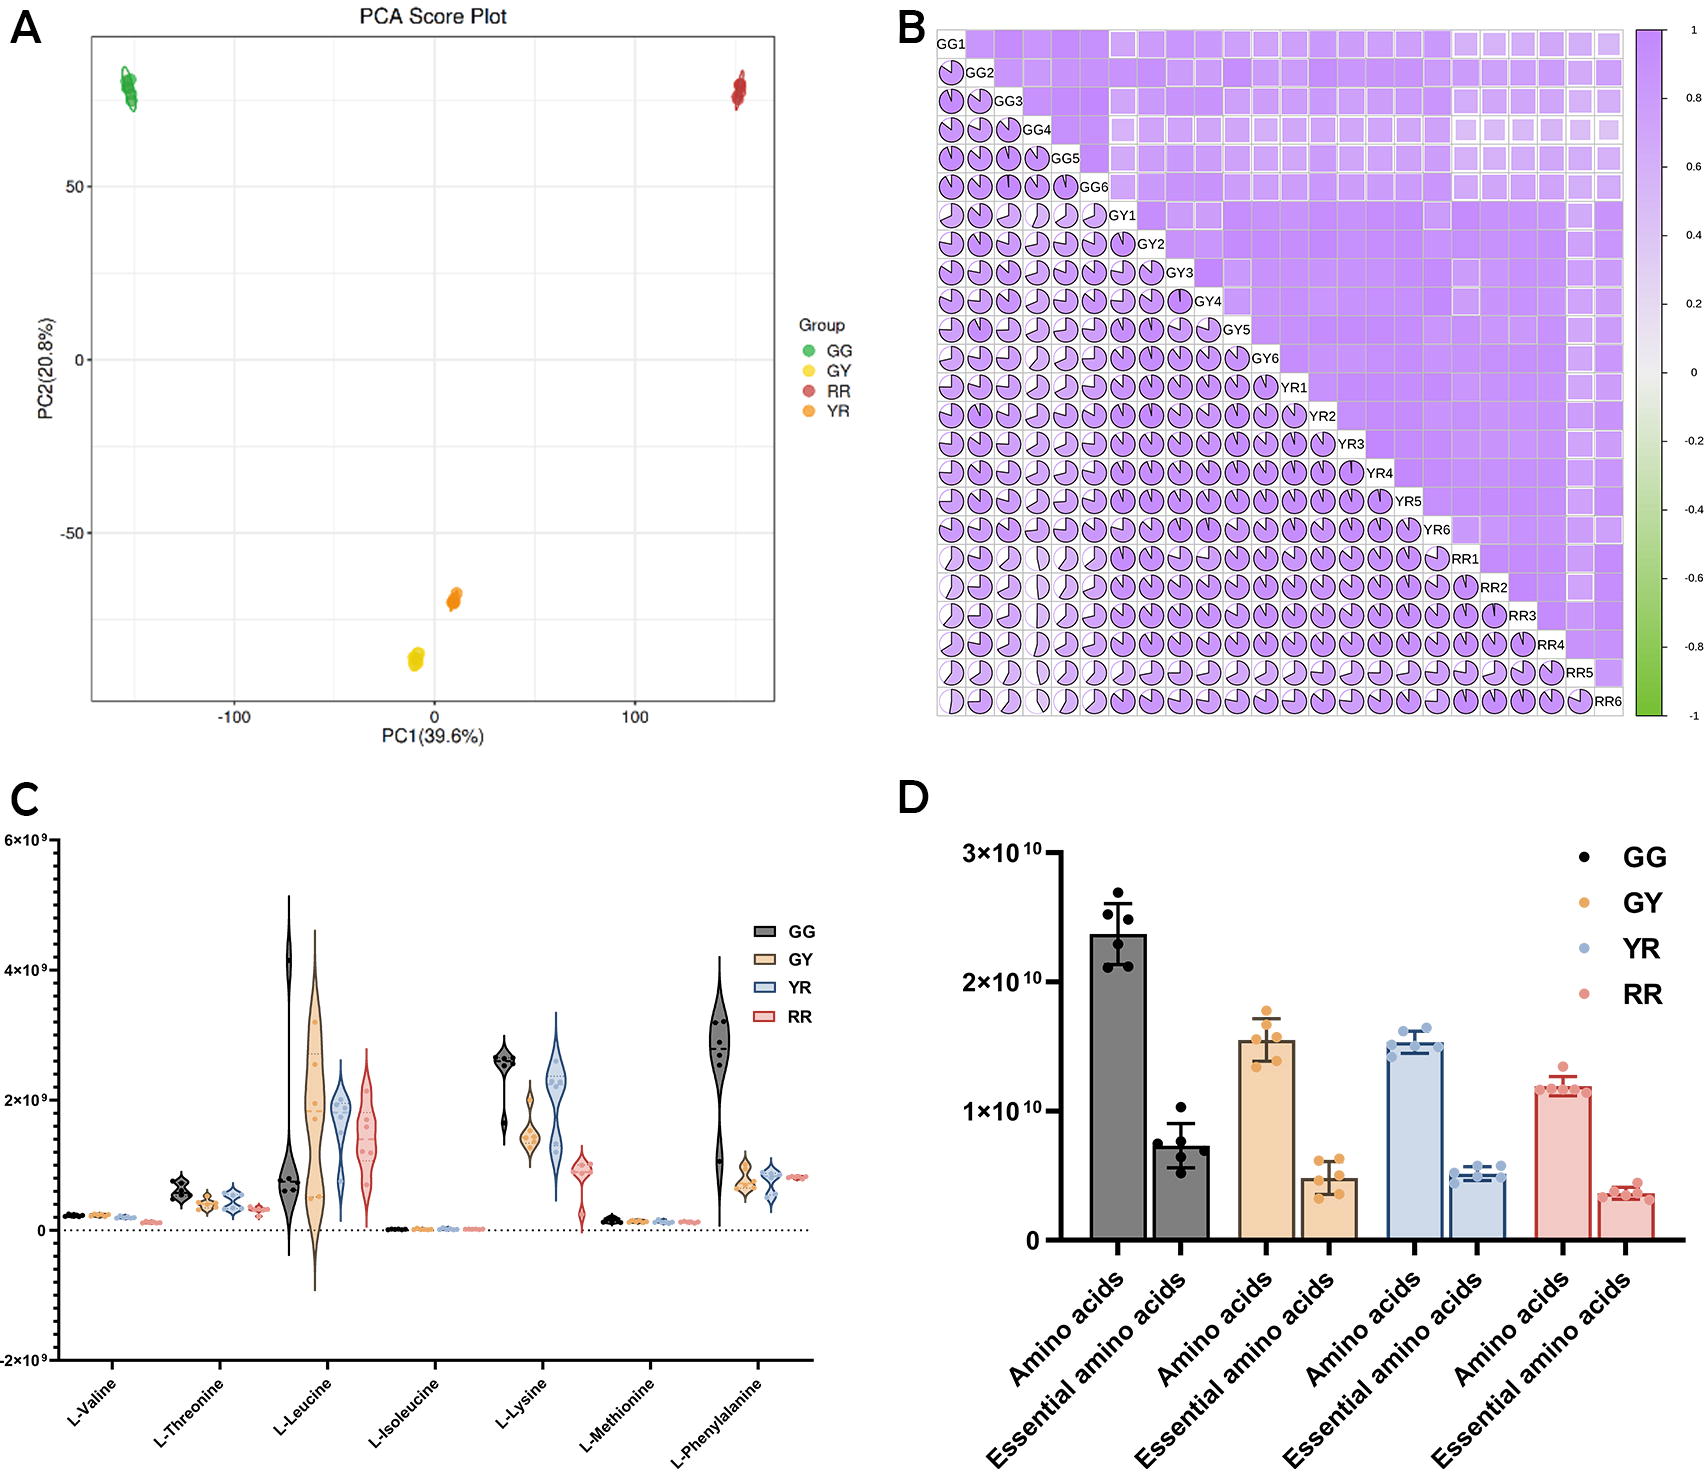
Amino acid metabolism profile of R. chingii fruit.
Furthermore, the amino acid metabolism profiling revealed variations in amino acid content during the ripening process of R. chingii. A violin plot illustrating essential amino acid content depicted consistently high levels of leucine, lysine, and phenylalanine across all developmental stages, whereas valine, isoleucine, threonine, and methionine were found at lower concentrations (Fig. 1C). Notably, leucine exhibited the highest content across different stages of R. chingii’s development. In the mature stage (RR), leucine prevailed, followed by lysine and phenylalanine. In the immature stage (GG), phenylalanine was most abundant, followed by lysine and leucine. During the transition to maturity (GY), leucine again topped the list, with lysine and phenylalanine trailing behind. Finally, in the young ripe stage (YR), lysine took the lead, closely followed by leucine and phenylalanine.
Essential amino acids have long been a focus of interest in the realm of food nutrition. Upon analysis, the data indicate that the proportion of essential to total amino acids exhibited a relatively stable pattern throughout the diverse stages of growth in R. chingii, ranging from 30.43% to 33.62%. The ratio of essential amino acids to the total amino acid content in R. chingii demonstrates a consistent pattern across its growth stages and exhibited a progressive trajectory, ascending from 30.92% during the GG stage to 31.04% in the GY stage, advancing further to 33.62% in the YR stage, and subsequently declining to 30.43% in the RR stage. The findings corroborate that R. chingii is an amino acid-rich organism, containing all seven essential amino acids necessary for human nutrition. Among these, leucine, lysine, and phenylalanine were identified as the most abundant amino acids within the species. Amino acids are not only indispensable for the human diet, serving as building blocks of proteins, but they also play a pivotal role in conferring flavor to culinary creations. 20,21 There are great differences in the type, content, and proportion of amino acids in different plant foods. 22 Therefore, investigating the amino acid profile in various foods serves as a crucial reference for optimizing dietary intake of essential amino acids and a spectrum of other essential nutrients.
Overview of transcriptome sequencing
High-throughput RNA sequencing (RNA-seq) can well describe the biosynthetic pathway of secondary metabolites by combining all information of the transcriptome at the level of a single transcript. 23,24 To uphold the integrity of our data, we meticulously pre-processed the raw data before conducting bioinformatics analyses. The Q30 content of the 12 cDNA libraries exceeded 92%, with an average GC content of approximately 48%. For comprehensive details, please refer to Supplementary Table S2. Analysis of the transcriptome assembly yielded confidence in the reliability of the RNA-Seq data for subsequent research, with the identification of 31,994 annotated unigenes. In detail, 21,766 (68.03%), 29086 (90.91%), 15,587 (48.71%), 27,219 (85.07%), 10,061 (31.44%), and 6,651 (20.78%) unigenes were annotated to the Swissprot, NR, GO, eggNOG, KEGG, and Pathway databases, respectively. The PCA of the transcriptome gene expression levels for R. chingii revealed that the first and second principal components accounted for 67% and 21% of variance among the samples, respectively (Fig. 2A). The PCA elucidated pronounced variations in the gene expression profiles of R. chingii across four distinct developmental stages, indicating significant differences in the transcriptional landscapes. The Pearson correlation coefficient was employed to quantify the degree of correlation in gene expression levels across samples, with a value closer to 1 indicating a higher degree of similarity in expression patterns among the samples. (Fig. 2B). The results showed that the gene expression characteristics of R. chingii at different developmental stages were not consistent, which was similar to their actual developmental characteristics. The correlation coefficients between the gene expression levels of biological replicates for all samples were concordant, signifying a high degree of consistency and reliability within the replicate measurements. This concordance suggests that the data are robust and suitable for subsequent analysis to identify DEGs.
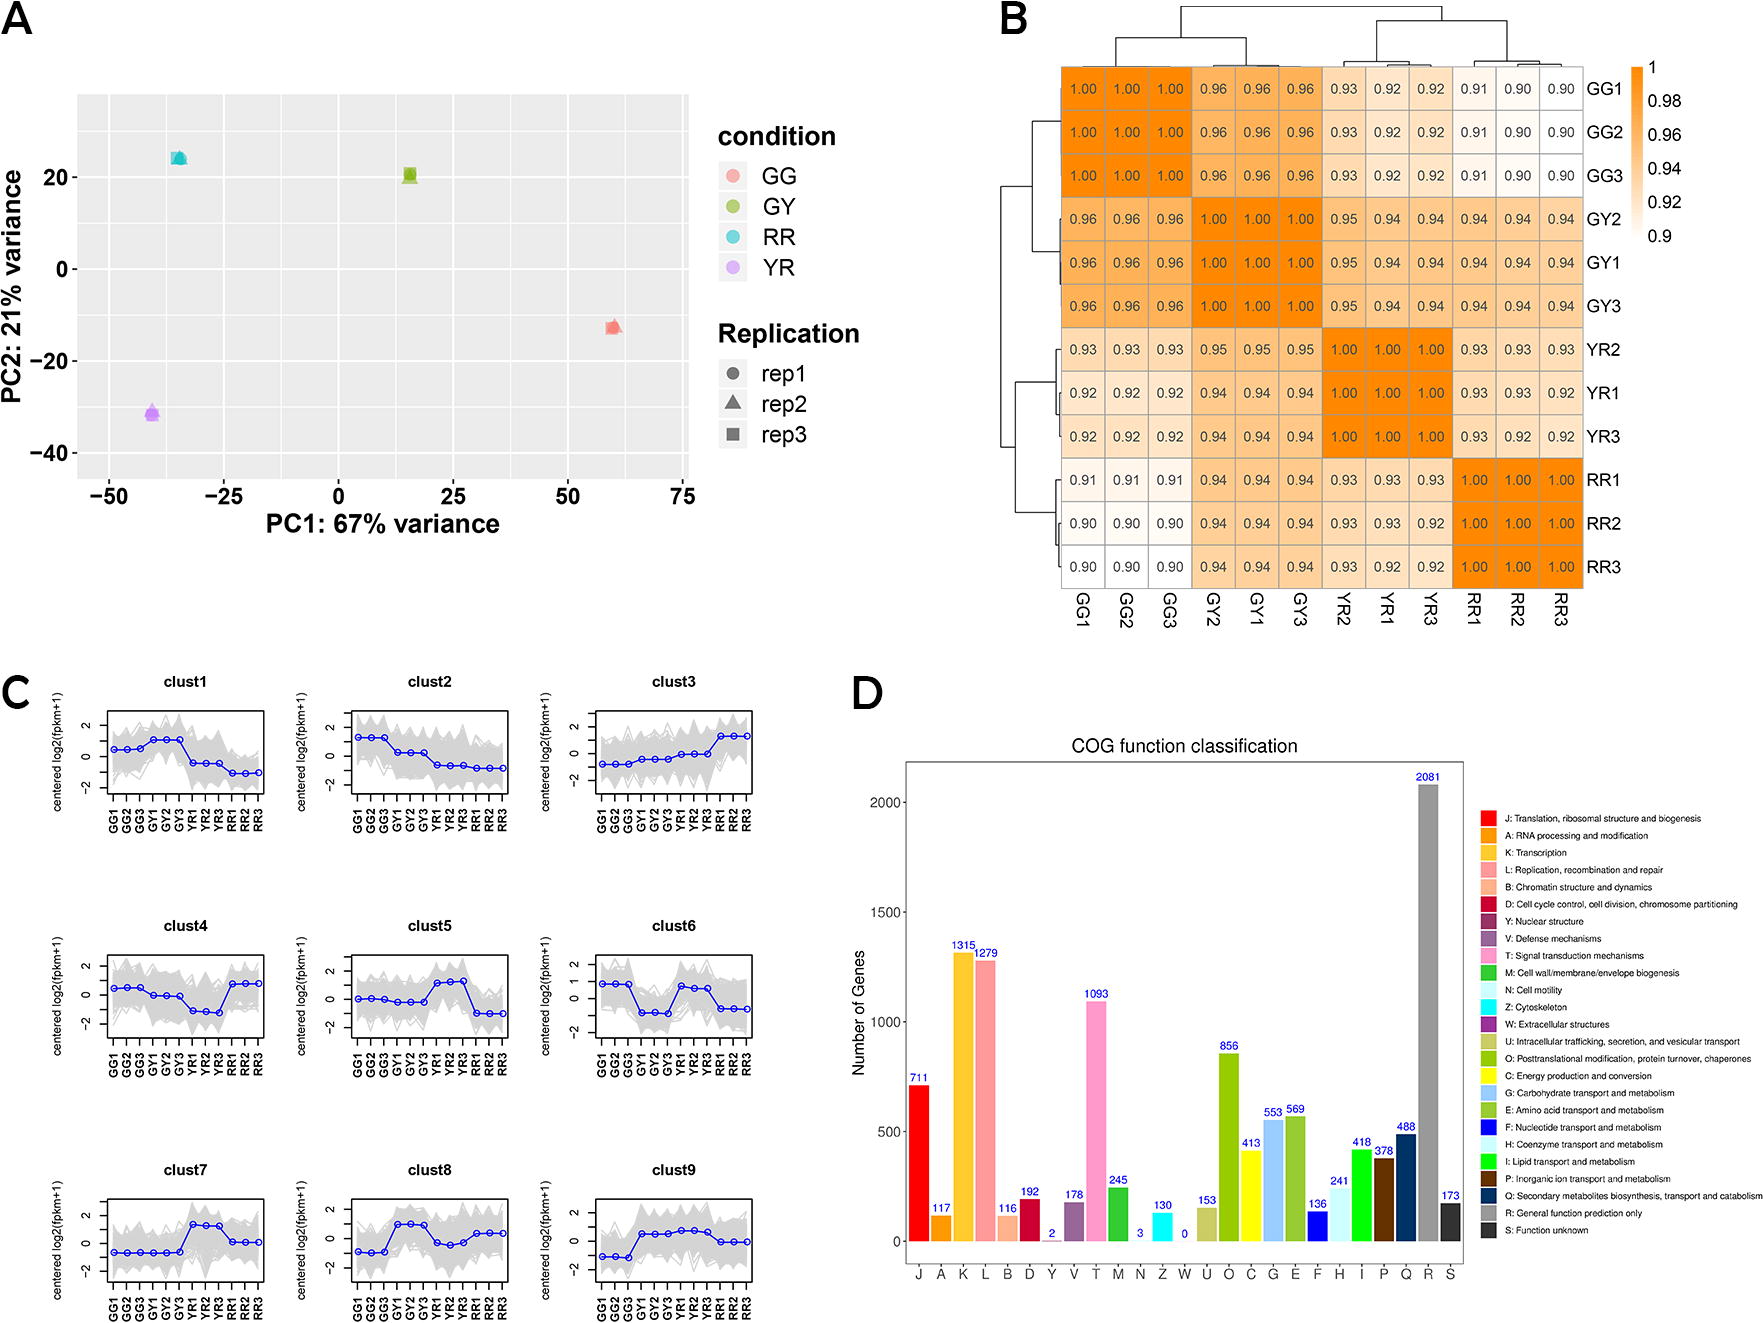
Transcriptome sequencing and functional analysis of DEGs in R. chingii.
DEG analysis in the developmental stages of R. chingii
To elucidate the DEGs throughout the fruit development process in R. chingii, a comprehensive analysis was conducted. Utilizing the k-means clustering algorithm, all 31,994 genes were categorized into nine distinct clusters. This classification revealed a substantial number of genes that exhibited differential expression patterns among the various samples, underscoring the complexity of the transcriptional dynamics underlying fruit development in R. chingii. (Fig. 2C). Based on pairwise comparisons with a threshold of |log2(fold change)| ≥ 1 and an FDR value <0.05, 5011 (1942 upregulated and 3069 downregulated), 8190 (3824 upregulated and 4366 downregulated), 9078 (3661 upregulated and 5417 downregulated), 4741 (2705 upregulated and 2036 downregulated), 6311 (2621 upregulated and 3690 downregulated), and 4037 (1249 upregulated and 2788 downregulated) DEGs were identified in GY versus GG, YR versus GG, RR versus GG, YR versus GY, RR versus GY, and RR versus YR, respectively.
According to the cluster of orthologous groups of proteins (COG), in the developmental stages of R. chingii, the DEGs were categorized into 26 distinct classes. Notably, the T category, which pertains to signal transduction mechanisms, contained the largest number of genes, with a total of 1093 DEGs identified within this class (Fig. 2D). In addition, functional categorization revealed enrichment of 553 genes in the G category (carbohydrate transport and metabolism), 418 genes in the I category (lipid transport and metabolism), and 488 genes in the Q category (secondary metabolite biosynthesis, transport, and catabolism). Furthermore, a significant number of genes, 569, were found to be enriched in the E category (amino acid transport and metabolism) (Fig. 2D). Upon performing Gene Ontology (GO) enrichment analysis on the DEGs, our investigation revealed a considerable subset of genes that play a pivotal role in an extensive spectrum of biological processes, cellular components, and molecular functions, as illustrated in Supplementary Fig. S1. As depicted in Figure 3 A–G, the KEGG terms commonly enriched among the DEGs across the six comparative groups (GY vs GG, YR vs GG, RR vs GG, YR vs GY, RR vs GY, and RR vs YR) include carotenoid biosynthesis (ko00906), photosynthesis (ko00195), and phenylpropanoid biosynthesis (ko00940). The words were marked in red. Analysis through KEGG pathway enrichment and functional classification has revealed that a substantial proportion of DEGs within the fruit of R. chingii is intricately engaged in amino acid synthesis and protein processing. These genes are intrinsic factors critical for the biosynthesis of amino acids. In details, 16, 21, 14, and 24 DEGs involved in beta-alanine metabolism (ko00410), tyrosine metabolism (ko00350), phenylalanine metabolism (ko00360), and cyanoamino acid metabolism (ko00460) in GY versus GG, respectively. Twenty-six, 29, 19, and 51 DEGs involved in arginine and proline metabolism (ko00330), tyrosine metabolism (ko00350), phenylalanine metabolism (ko00360), and cysteine and methionine metabolism (ko00270) in YR versus GG, respectively. Eighteen, 53, and 34 DEGs involved in phenylalanine metabolism (ko00360), cysteine and methionine metabolism (ko00270), and tyrosine metabolism (ko00350) in RR versus GG, respectively. Nineteen, 26, and 15 DEGs involved in cyanoamino acid metabolism (ko00460), cysteine and methionine metabolism (ko00270), and alanine, aspartate and glutamate metabolism (ko00250) in YR versus GY, respectively. Twenty-six, 36, 22, and 38 DEGs involved in cyanoamino acid metabolism (ko00460), cystenine and methionine metabolism (ko00270), tyrosine metabolism (ko00350), and glutathione metabolism (ko00480) in RR versus GY, respectively. Eighteen, 16, 18, 29, and 44 involved in cyanoamino acid metabolism (ko00460); phenylalanine, tyrosine, and tryptophan biosynthesis (ko00400); tyrosine metabolism (ko00350); cysteine and methionine metabolism (ko00270); and glutathione metabolism (ko00480) in RR versus YR, respectively. The pathways involved in amino acid metabolism were marked in blue. Overall, the ripening process of R. chingii involves a considerable number of genes dedicated to amino acid synthesis and transport. Investigating the functional gene expression derived from the R. chingii transcriptome could potentially unlock insights into the intricate mechanisms underpinning amino acid biosynthesis.
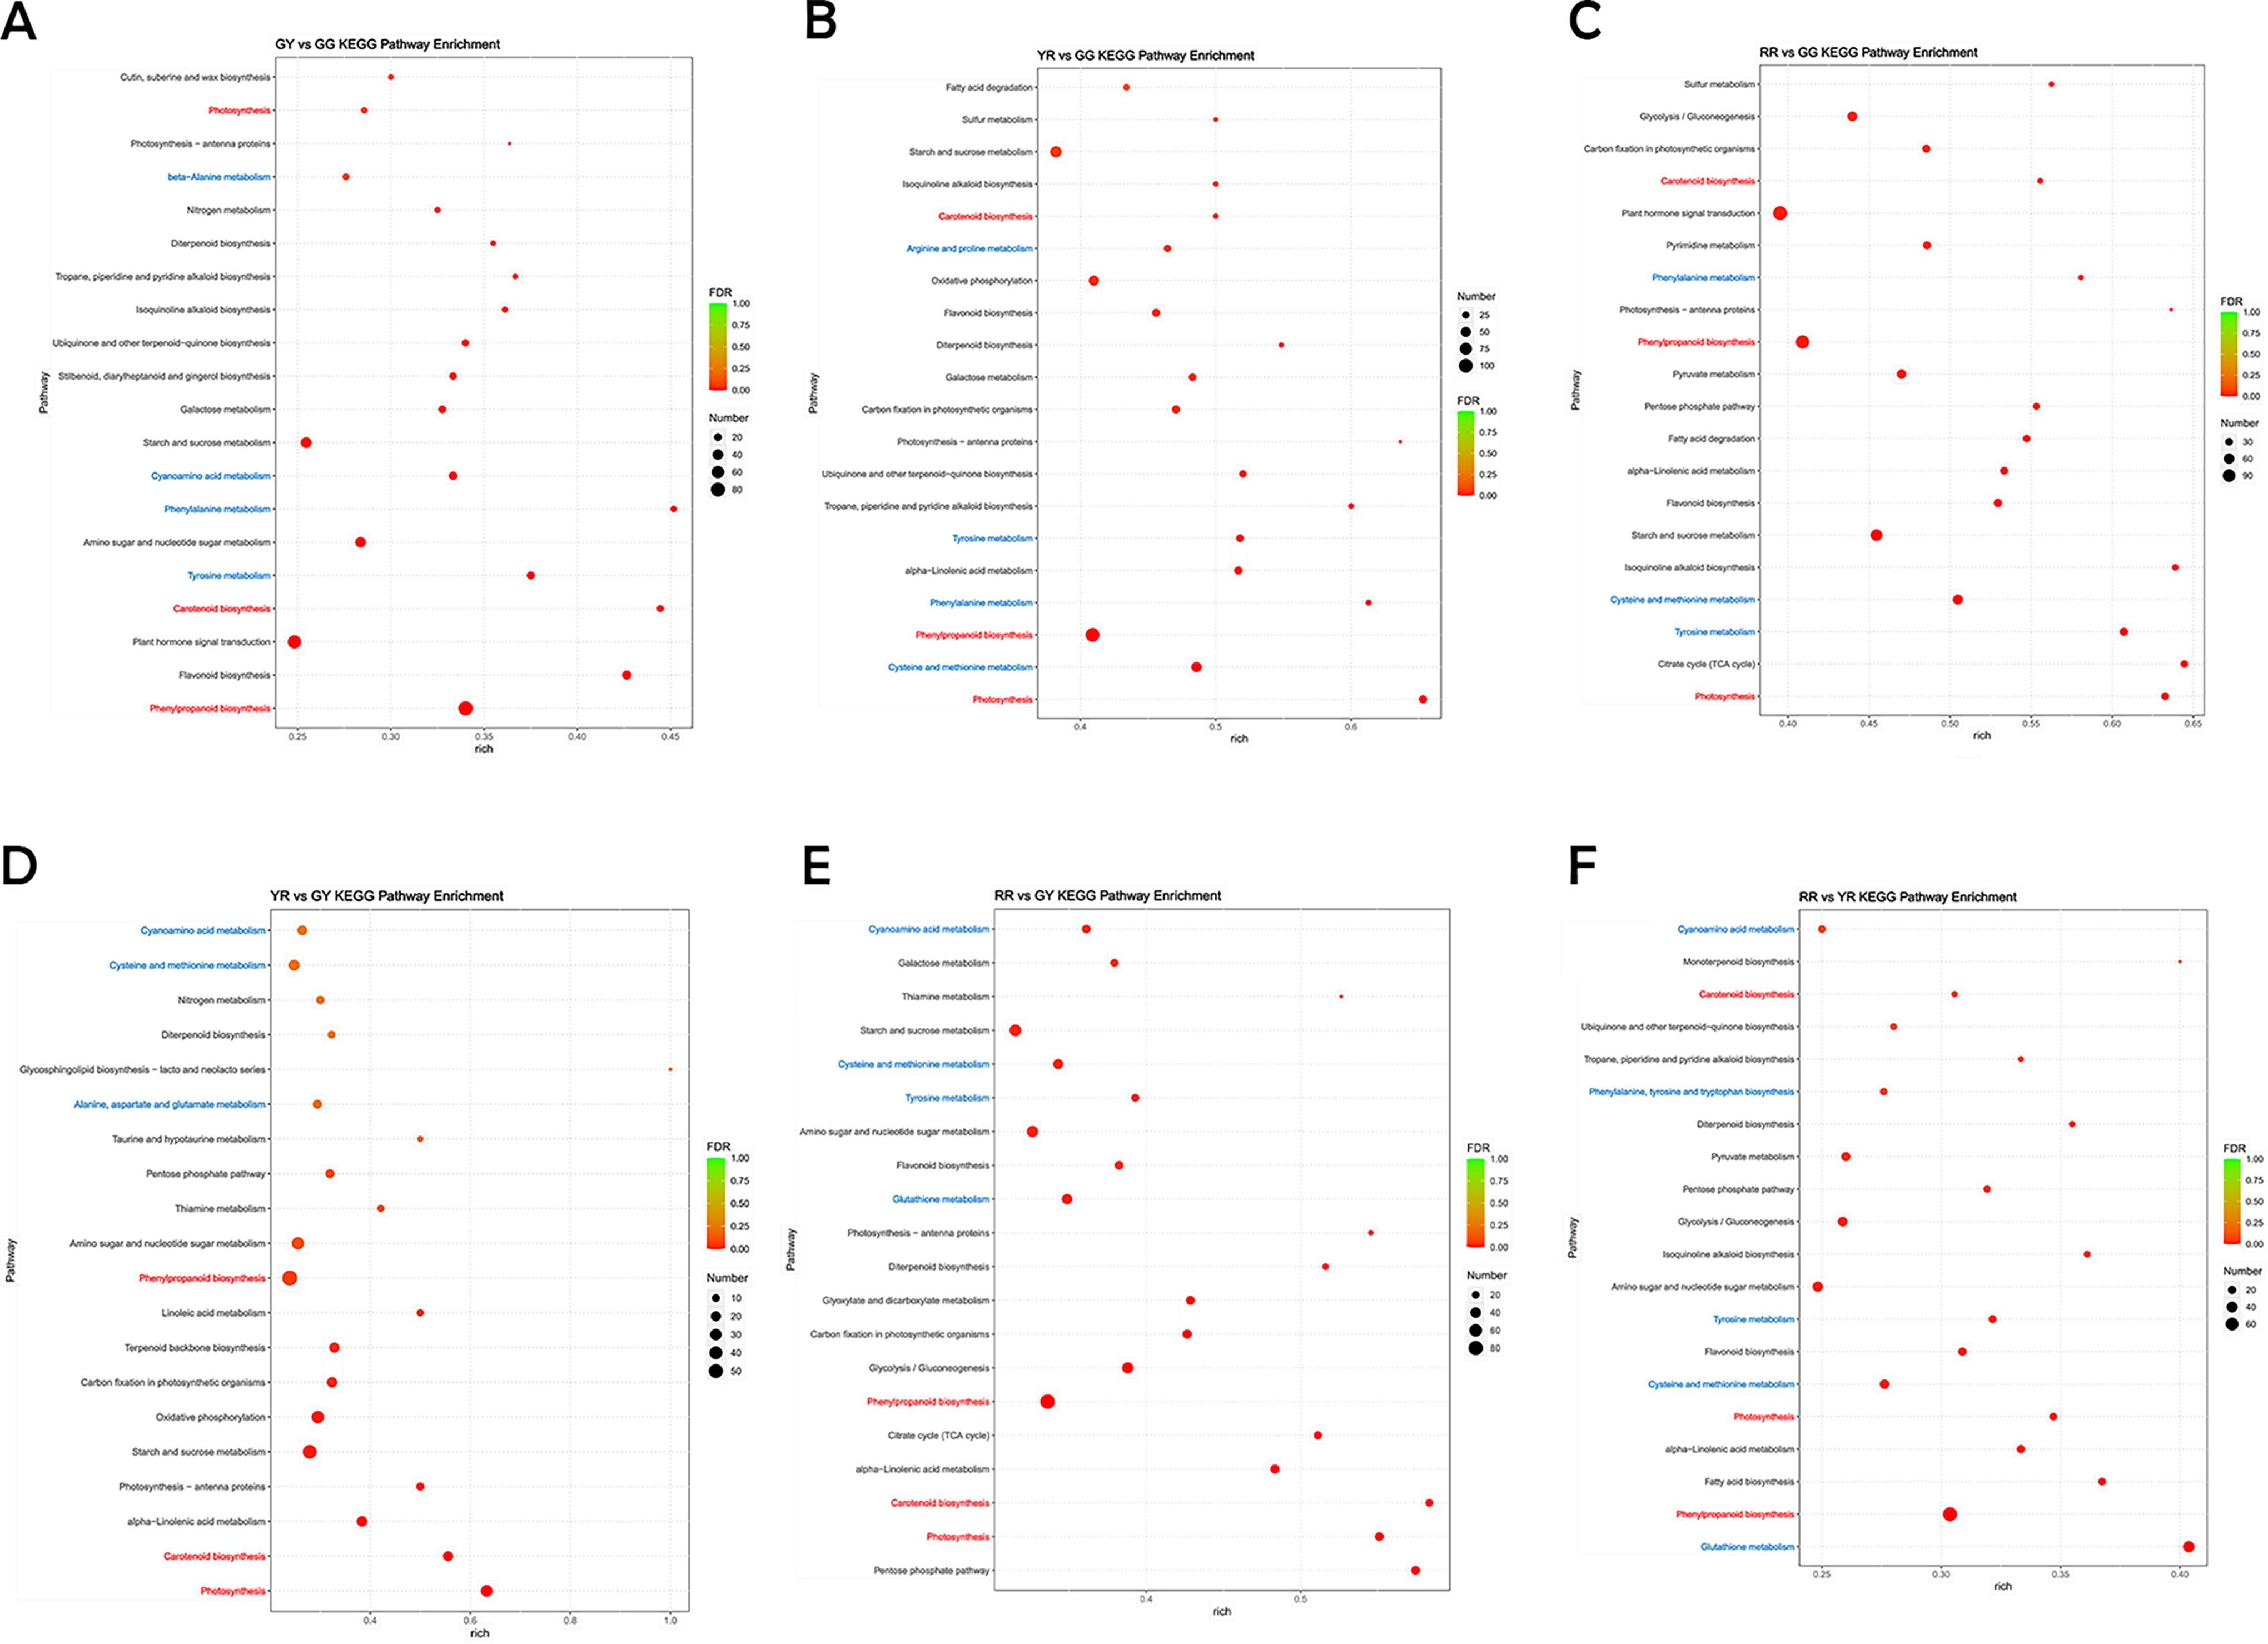
KEGG functional classification and quantitative distribution of DEGs across six compared groups (GY vs GG, YR vs GG, RR vs GG, YR vs GY, RR vs GY, and RR vs YR)
Expression patterns of DEGs related to amino acid metabolism in R. chingii
We have meticulously mapped the amino acid metabolism pathway and identified a cohort of 25 DEGs that are pivotal to amino acid metabolism. Our analysis aims to explore the correlation between the amino acid content across four distinct developmental stages of R. chingii and these pertinent DEGs. (Fig. 4). The heat map depicting the levels of gene expression revealed diverse patterns of expression among amino acid synthesis-related genes across the various developmental stages of R. chingii. For example, isocitrate dehydrogenase (IDH), arogenate dehydratase (ADT), shikimate kinase (SK), methyl tetrahydropteroyl triglutamatehomocysteine (METE), homocysteine S-methyltransferase (HMT), arginase (ARGAH), serine hydroxyl methyltransferase (SHM), and asparagine synthetase (AS) DEGs showed high expression levels in GG, and Adenosine Triphosphate (ATP)-dependent 6-phosphofructokinase (PFK), pheophytinase (PPH), anthranilate synthase beta subunit (ASB), shikimate dehydrogenase (EMB), proline dehydrogenase (POX), tetraspanin-19 (TOM2AH3), succinate dehydrogenase (SDH) DEGs showed high expression levels in GY, while 1-aminocyclopropane-1-carboxylate oxidase (ACO), tryptophan synthase beta chain 2 (TSB), and anthranilate synthase alpha subunit 1 (ASA) showed high expression levels in RR (Fig. 4A). The discrepancies in gene expression levels had a direct impact on the concentrations of various amino acids. The heat map revealed that a majority of amino acids, including essential ones such as valine, lysine, phenylalanine, threonine, and methionine, exhibited elevated expression levels in GG, and most amino acids, including essential amino acids (valine, lysine, phenylalanine, threonine, and methionine), had low expression levels in RR. The diverse array of amino acid metabolism profiles exemplifies the depth and complexity inherent in amino acid processing. The pathway of amino acid metabolism vividly illustrates the intricate correlations between gene expression and the production of amino acid metabolites, thereby establishing a solid foundation for exploring the intricacies of amino acid metabolism in R. chingii.
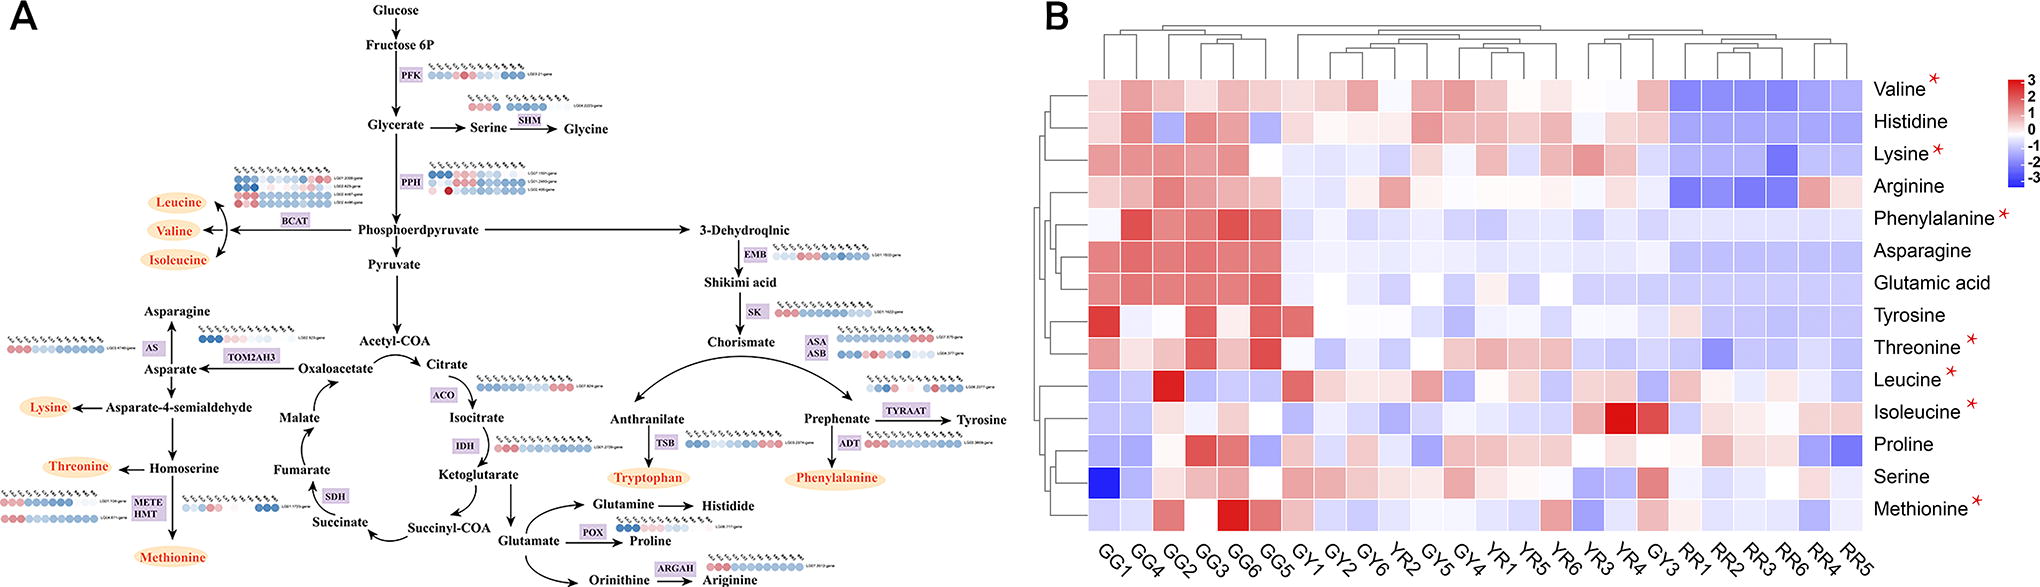
Amino acid synthesis pathway in the different developmental stages of R. chingii.
Correlation analysis has uncovered a notable positive correlation between the expression levels of 25 DEGs and the concentrations of seven essential amino acids. Notably, valine was found to be significantly positively correlated with PPH2, while threonine, phenylalanine, and lysine exhibited a significant positive correlation with PPH3 (Fig. 5A). Pyruvate kinase (PFK) stands as a pivotal regulatory gene, occupying a strategic position upstream in the complex web of amino acid metabolism. The expression level of PFK directly impacts the synthesis of various amino acids, albeit with distinct effects on each amino acid’s metabolic pathway. For example, PFK significantly contributes to the production of valine, which exhibits a significant positive correlation with succinate dehydrogenase (SDH) and pyruvate carboxylase (PPH2), while showing a significant negative correlation with amino acid decarboxylase (ASA), transaminase (TSB), acyl-CoA dehydrogenase (ACO), and branched-chain aminotransferase 1 (BCAT1). ASA and TSB are key genes involved in the synthesis of tryptophan, with BCAT1 playing a role in the synthesis of leucine, valine, and isoleucine. ACO; on the other hand, the process primarily concentrates on the synthesis of glutamic acid, proline, and arginine. The observed substrate competition between the synthesis reactions of different amino acids likely contributes to the varying effects of PFK on amino acid metabolism, explaining the complex interplay observed in the regulatory network.
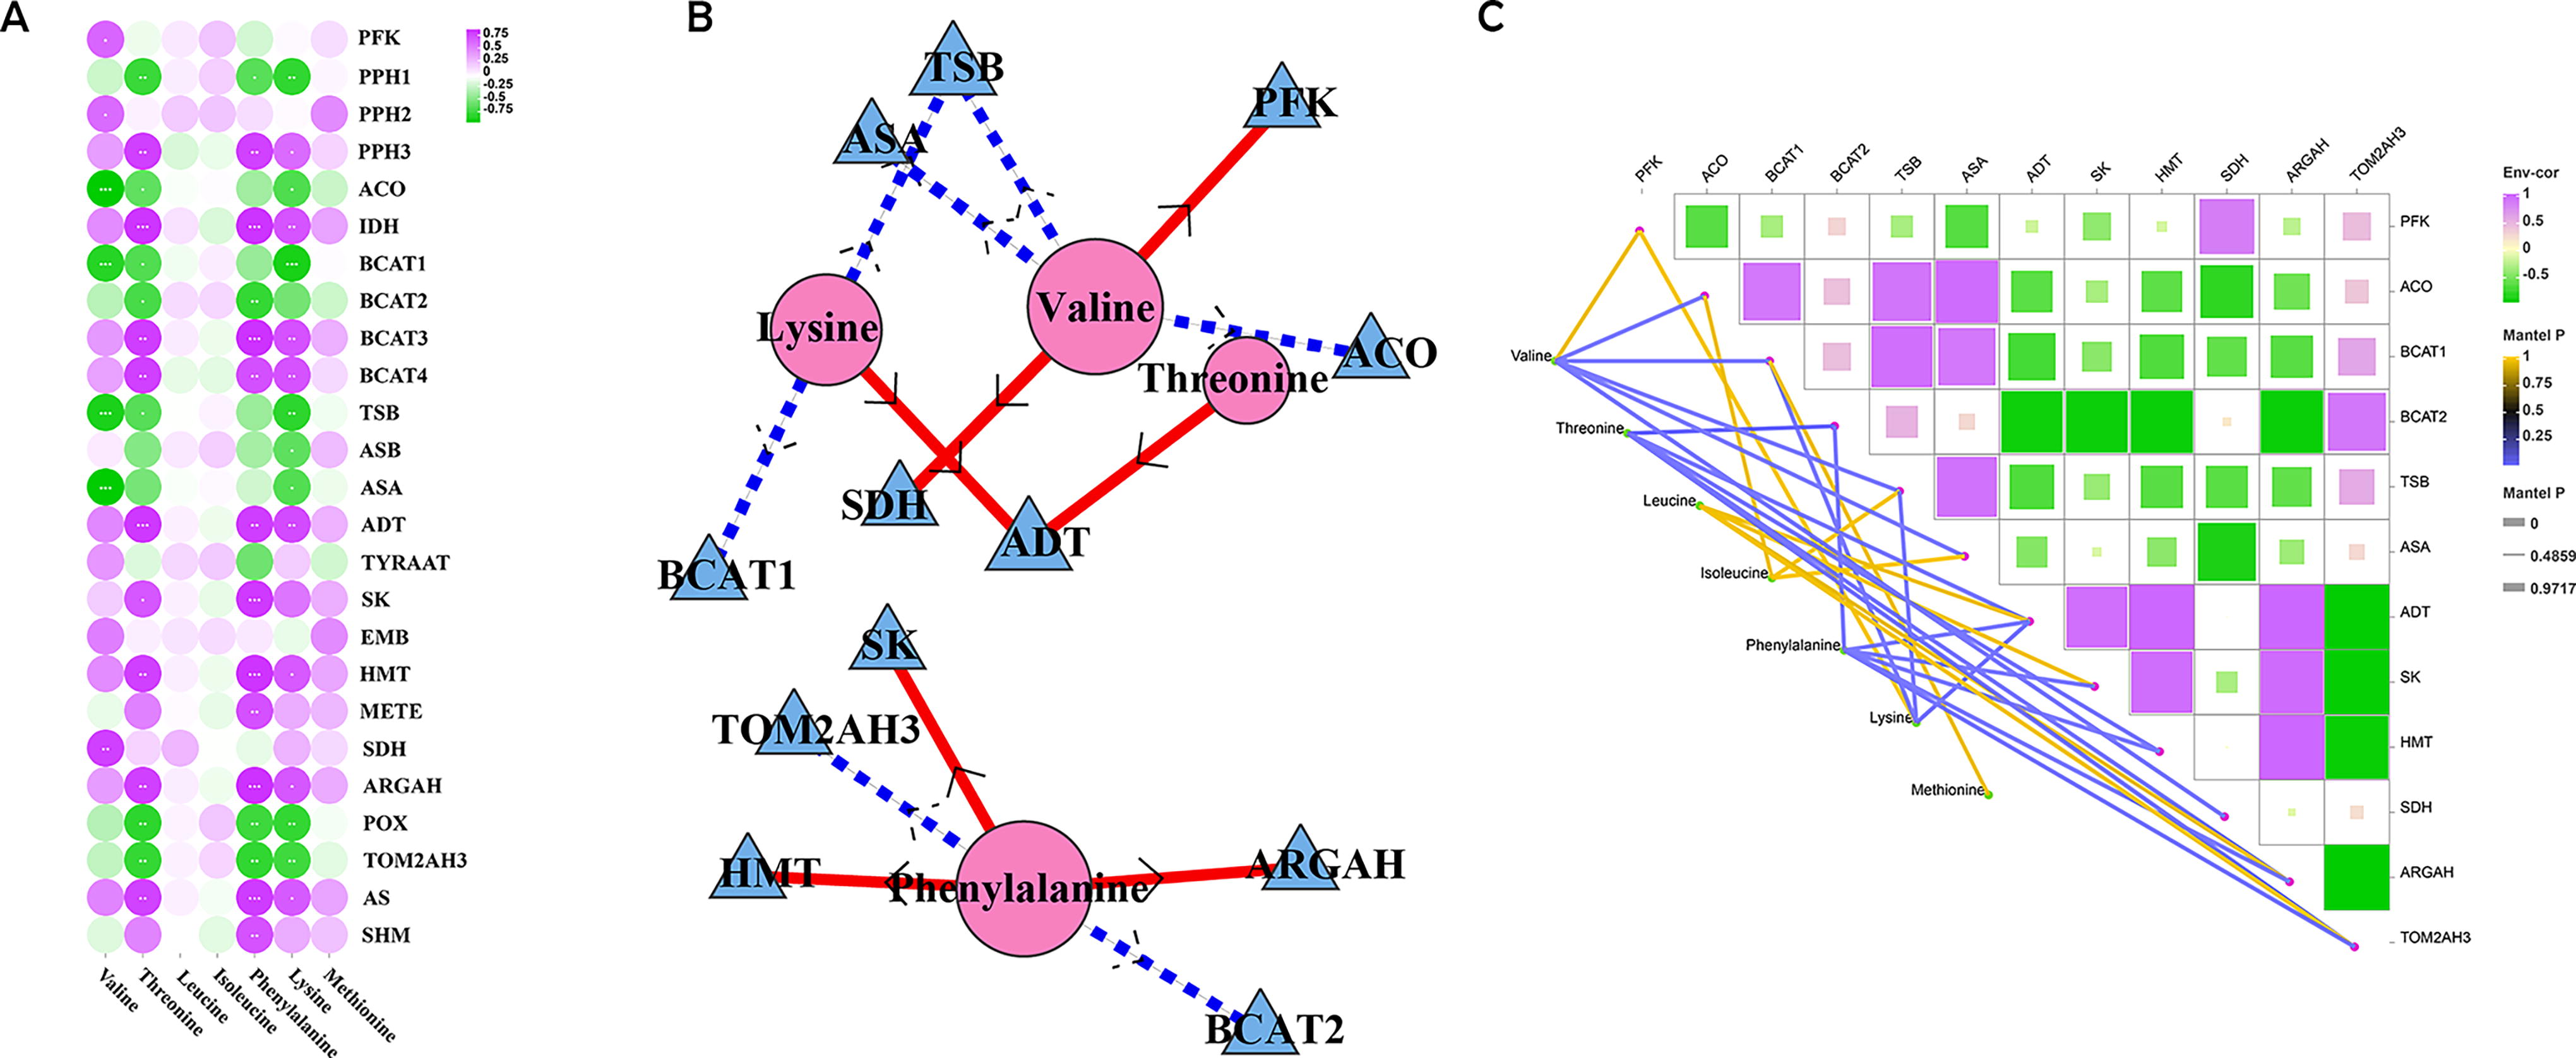
Screening of the main contributing DEGs in amino acid metabolism of R. chingii.
In analyzing the gene expression profiles and the subsequent accumulation of essential amino acids, an intricate web of interaction was established between DEGs and the amino acid profile (Fig. 5B). This interconnected network serves as a comprehensive indicator of the relationship between these genetic markers and amino acid biosynthesis, holding great potential in addressing various biological challenges. The findings revealed a significant positive correlation between valine and the genes PFK and SDH, lysine with ADT, threonine and ADT, and phenylalanine with SK, HMT, and ARGAH, while a significant negative correlation was identified between the levels of valine and the genes ASA, TSB, and ACO, as well as between lysine and BCAT1 and TSB, and phenylalanine and TOM2AH3 and BCAT2. To verify the correctness of this association method, we adopted another method of multigroup association analysis (Fig. 5C). The heat map analysis revealed a positive correlation between PFK expression and valine content. In addition, BCAT1 and TSB exhibited negative correlations with lysine, while ASA, TSB, and ACO demonstrated negative correlations with valine levels; TOM2AH3 and BCAT2 were negatively correlated with phenylalanine (The yellow line signifies a positive correlation, whereas the purple line indicates a negative correlation). The detailed information is in Supplementary Table S3. The results of two association analysis showed that PFK (LG03.21-gene), BCAT1 (LG01.2008-gene), TSB (LG03.2374-gene), ASA (LG07.875-gene), ACO (LG07.824-gene), TOM2AH3 (LG02.523-gene), and BCAT2 (LG02.823-gene) were the key DEGs in amino acid metabolism of R. chingii. qRT-PCR
To verify the results obtained from transcriptome sequencing of the selected amino acid metabolism, qRT-PCR was conducted (PFK, BCAT1, TSB, ASA, ACO, TOM2AH3, and BCAT2). As shown in Fig 6, the line chart in the upper right corner is the result of qRT-PCR, and the violin graph on the left is the result of RNA seq of 7 DEGs. The expression levels of the seven key differentially expressed genes (DEGs) conformed to those determined by RNA-seq analysis. The specific primer sequences used are detailed in Table 1.
The Primers Information in This Study
ACO, 1-aminocyclopropane-1-carboxylate oxidase; ASA, anthranilate synthase alpha subunit 1; BCAT, branched-chain aminotransferase; PCR, polymerase chain reaction; PFK, 6-phosphofructokinase; TOM2AH3, tetraspanin-19; TSB, tryptophan synthase beta chain 2.

Verification of expression profiles of 7 important DEGs (PFK, BCAT1, TSB, ASA, ACO, TOM2AH3, and BCAT2) by qRT-PCR. ACO, 1-aminocyclopropane-1-carboxylate oxidase; ASA, anthranilate synthase alpha subunit 1; BCAT, branched-chain aminotransferase; DEGs, differentially expressed genes; PFK, 6-phosphofructokinase; qRT-PCR, quantitative real-time polymerase chain reaction; TOM2AH3, tetraspanin-19; TSB, tryptophan synthase beta chain 2.
CONCLUSIONS
R. chingii is an important traditional medicinal and edible berry. During its growth and development, its nutritional composition and taste will also vary. In this study, we conducted a comprehensive analysis of the amino acid metabolism in R. chingii by integrating amino acid profiling with transcriptomic data. Our findings confirm that R. chingii is a rich and diverse source of amino acids. A total of 76 amino acids and their derivatives were identified across the four distinct developmental stages of R. chingii, encompassing all 7 essential amino acids, with leucine, lysine, and phenylalanine being the most predominant. Notably, the ratio of essential to total amino acids exhibited notable fluctuations across the various developmental stages of R. chingii. This ratio increased marginally from 30.92% in the GG stage to 31.04% in the GY stage, rose to 33.62% in the YR stage, and then slightly decreased to 30.43% in the RR stage. Furthermore, transcriptome function enrichment analysis revealed that 569 genes were annotated in the amino acid transcript and metabolism category. Through alignment with amino acid metabolism pathways, we identified 25 DEGs that are directly involved in amino acid metabolism. By combining interaction network and heat map analyses with amino acid metabolism profiling and transcriptome data, we were able to pinpoint the key contributors to amino acid metabolism in R. chingii, shedding light on the underlying mechanisms of its nutritional excellence. Our findings revealed that seven key DEGs, namely PFK, BCAT1, TSB, ASA, ACO, TOM2AH3, and BCAT2, play critical roles in amino acid metabolism. The expression levels of these DEGs were found to be highly correlated with the outcomes of the RNA-seq analysis, validating the accuracy of our molecular profiling techniques. This study elucidated the amino acid metabolism dynamics throughout the developmental stages of R. chingii by integrating untargeted metabolomic and transcriptomic assessments. These insights not only enhance our understanding of the organism’s metabolic pathways but also provide a significant reference for the advancement and scholarly investigation of R. chingii functional foods.
Footnotes
DATA AVAILABILITY STATEMENT
The data are freely available from the authors.
AUTHORS’ CONTRIBUTIONS
Y.Y.L., Y.J.H., and H.J.C.: analysis of data and writing—original raft preparation. S.J.C., X.W.Q., and H.S.R.: technical assistance, data collection, analysis, and interpretation. P.P., Y.Y.L., and H.J.C. were involved in the oversight and writing processes, as well as the review and editing of the text. The final article was accepted by all the authors involved.
AUTHOR DISCLOSURE STATEMENT
The authors declare no conflict of interests.
FUNDING INFORMATION
This work was supported by
SUPPLEMENTARY MATERIAL
Supplementary Figure S1
Supplementary Table S1
Supplementary Table S2
Supplementary Table S3
Supplementary Table S4
References
Supplementary Material
Please find the following supplemental material available below.
For Open Access articles published under a Creative Commons License, all supplemental material carries the same license as the article it is associated with.
For non-Open Access articles published, all supplemental material carries a non-exclusive license, and permission requests for re-use of supplemental material or any part of supplemental material shall be sent directly to the copyright owner as specified in the copyright notice associated with the article.
