




Abstract
Aurantii Fructus (AF) and Aurantii Fructus Immaturus (AFI) are distinct herbs outlined by the Chinese Pharmacopoeia. They are sourced from the same plant but harvested at different times, resulting in differences in efficacy. It is important to avoid mixing them clinically and to distinguish between the two. Furthermore, dissimilar cultivation conditions may cause variability in the quality of herbs, so it is vital to differentiate drugs from dissimilar origins. In this study, two plants, AF and AFI from different provinces, were comparatively analyzed based on High Performance Liquid Chromatography (HPLC) fingerprints and classified using chemometric methods. The results indicate that the two medicines can be clearly distinguished. Also, AF and AFI grown in different locations can be distinguished. Ten chemical markers were screened, and their variations were determined, including eriocitrin, narirutin, naringin, meranzin hydrate, naringenin, hesperidin, nobiletin, tangeretin, neohesperidin, and poncirin. Subsequent network pharmacology correlated the screened chemical components with the biological network of the organism. The material basis of the difference in efficacy of the two homologous herbs was explored from the perspective of changes in chemical composition. This study provides a reference for formulating quality evaluation standards for AF and AFI and lays a foundation for the efficacy-related quality research of the two.
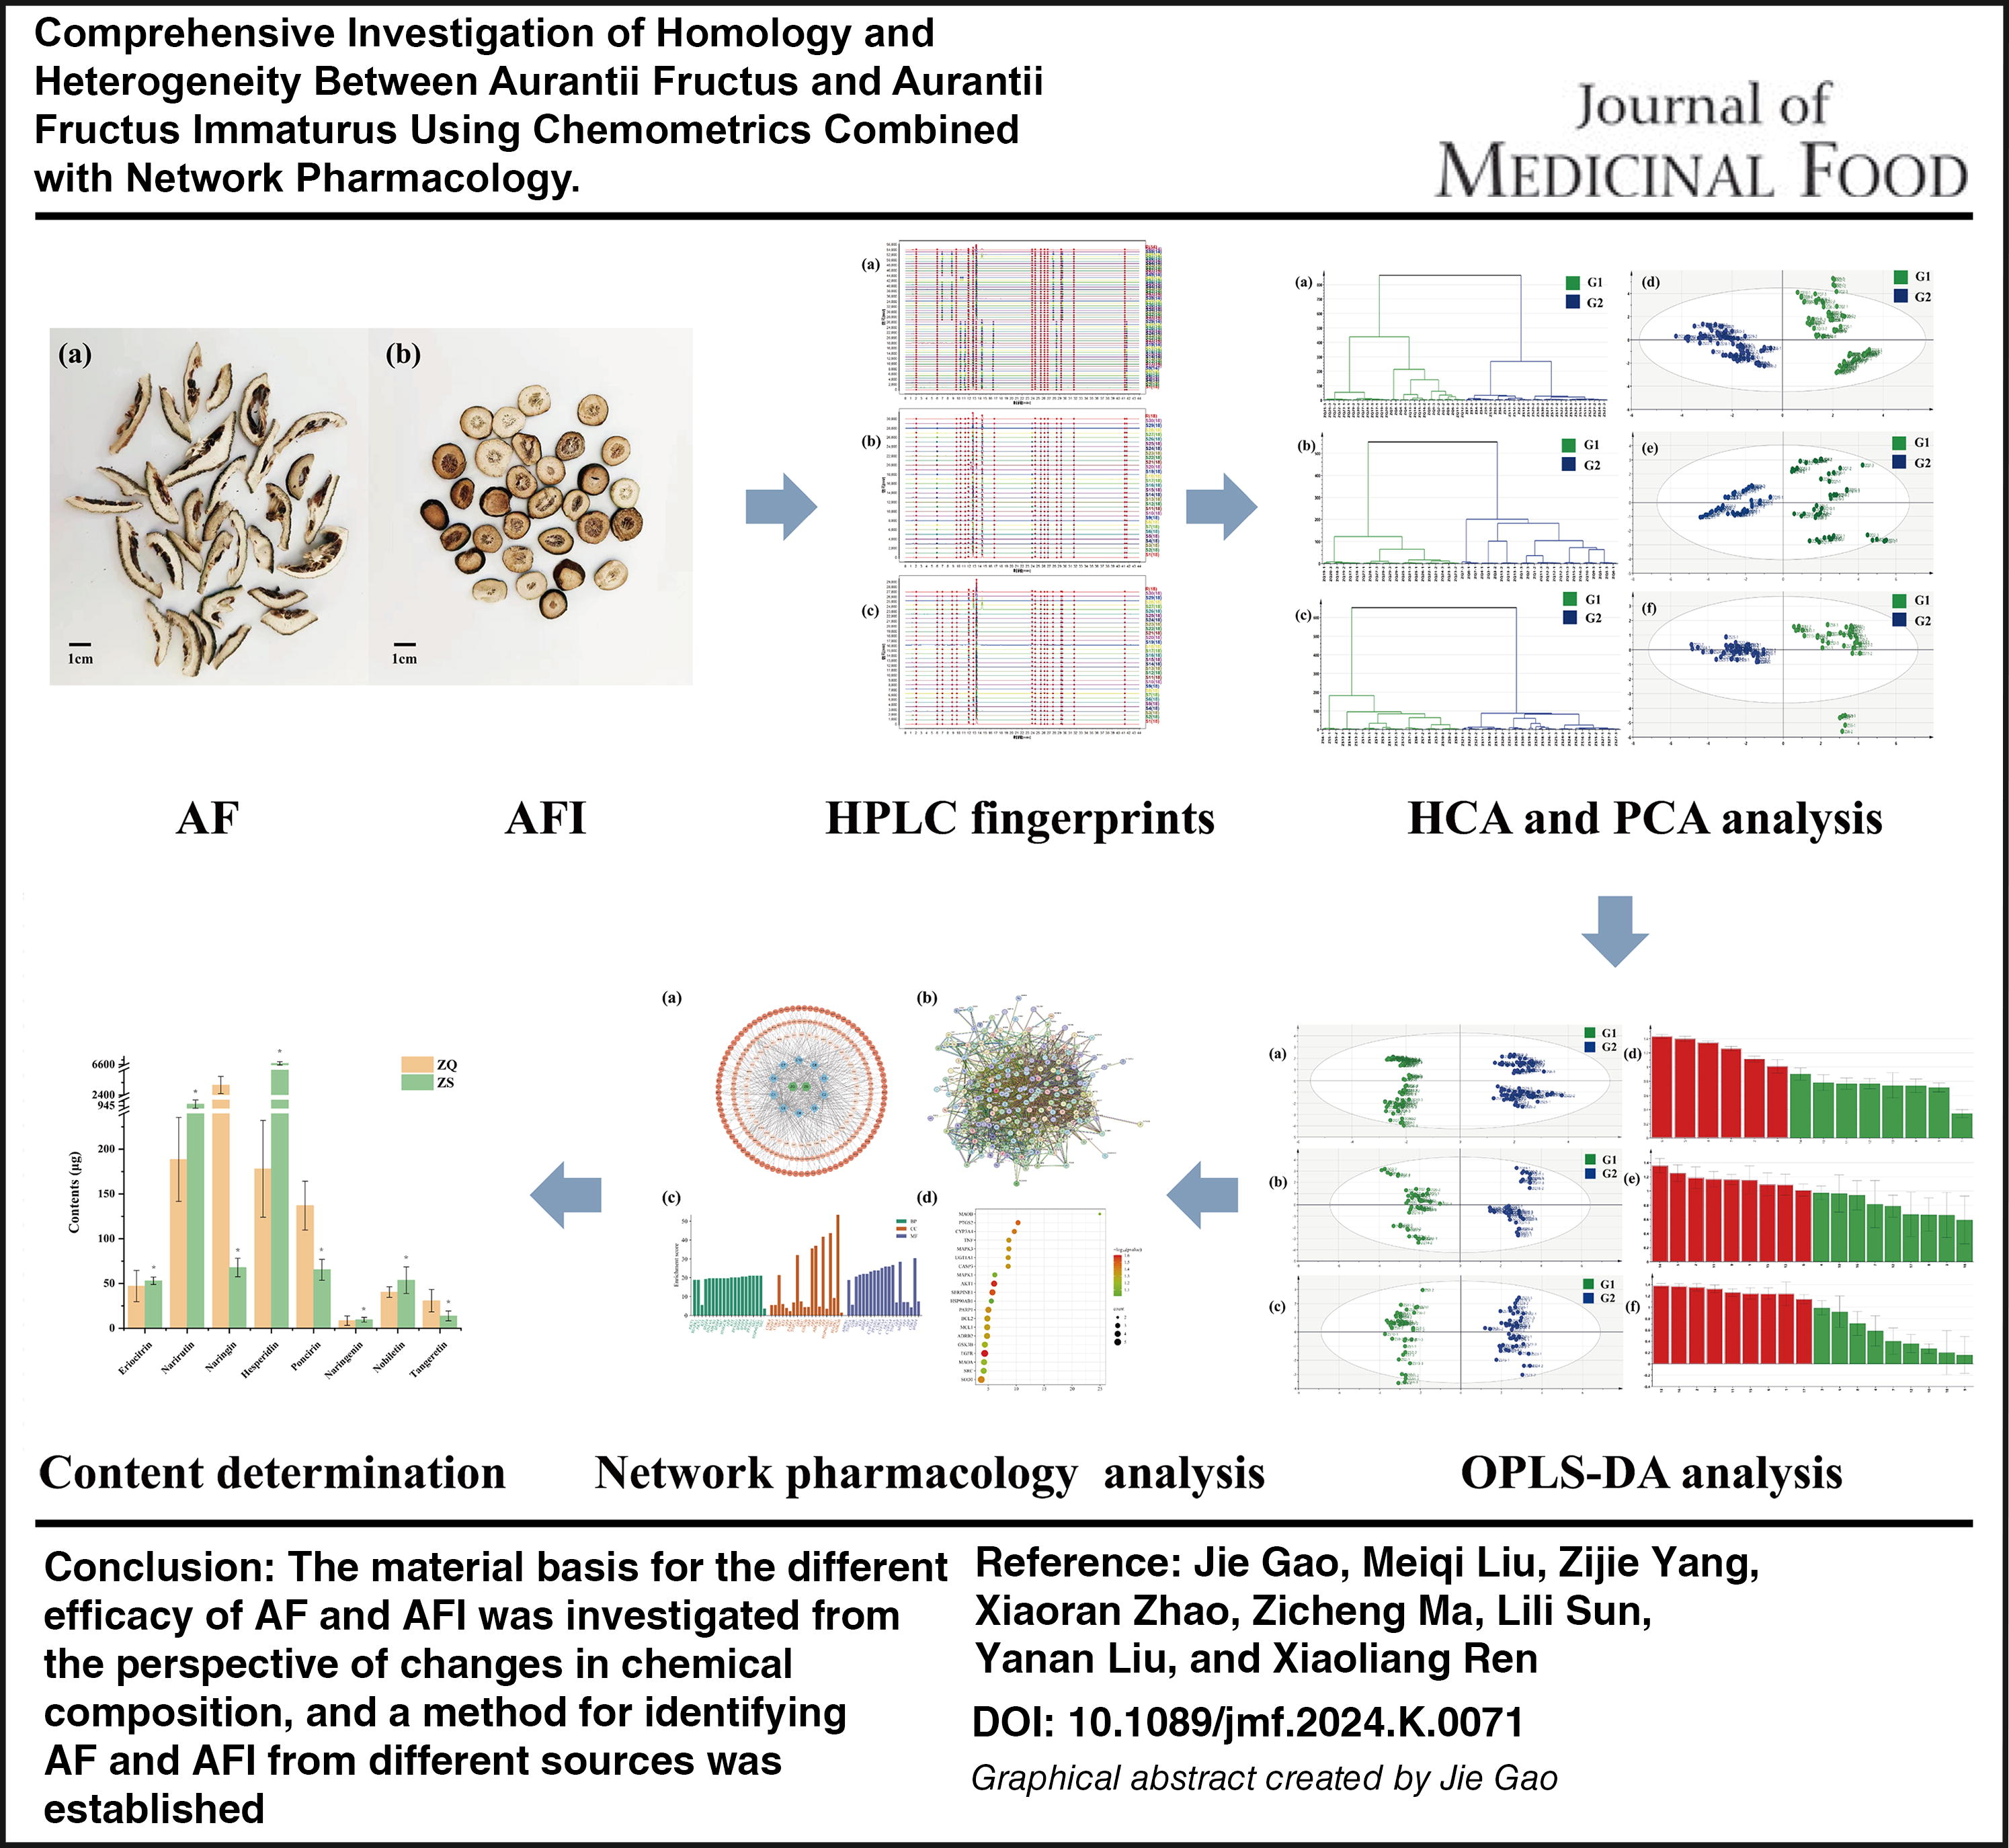
INTRODUCTION
Traditional Chinese medicine (TCM) has been utilized to prevent and treat illnesses for centuries. Recently, due to the manifestation of the medical value of TCM, it has been gradually accepted by a growing number of overseas compatriots. 1 As a crucial component, the quality evaluation of herbs is a prerequisite to ensure the safety and efficacy of the overall treatment. Therefore, quality controls utilized in the preparation of TCM are particularly crucial in clinical applications. However, owing to the large number of active ingredients and complex action pathways of Chinese medicines, the traditional quality control system based on evaluating only one or several active ingredients is no longer suitable. A comprehensive approach is required to explore a new method to evaluate the quality of Chinese medicine, assuring that it aligns with the holistic approach of Chinese medicine and also satisfies the requirements for modernization. 2 –4
HPLC fingerprinting is a comprehensive analytical technique that utilizes modern technology to obtain chromatograms of TCM. It is capable of displaying every chemical component present in the herbs through fingerprinting by interpreting the function of substance groups. As such, it provides a reflection of the quality of the herbs. This method is recognized for its overall, distinct, and indistinct properties, and is frequently used in assessing the quality, genuineness, and differentiation of herb species. 5,6 Chemometrics is a multifactorial analytical approach for handling complicated data. The process facilitates the visualization and analysis of large-scale data using computer networks, combining the disciplines of statistics, mathematics, and other areas to uncover hidden patterns. It comprises mainly the following two categories: unsupervised methods, including hierarchical cluster analysis (HCA) and principal component analysis (PCA), and supervised methods such as partial least-squares discriminant analysis (PLS-DA) and artificial neural networks. 7 –9 Network pharmacology is a growing discipline that uses computer networks to establish links between active ingredients of drugs and the biological networks of an organism. In this way, it offers insights into new therapeutic opportunities for a range of diseases. It is capable of constructing network relationships between components, targets, and pathways to examine potential targets and their possible biological functions. The systematic explanation of the mechanism of Chinese medicines aligns with its holistic approach that considers multicomponent, multitarget, and multipathway treatments. 10 –12
Aurantii Fructus (AF) is the dried immature fruit of Citrus aurantium L. and its cultivars, which has the ability to regulate qi width and alleviate flatulence. Clinically, it is mainly used to alleviate chest and hypochondriac qi stagnation, fullness and pain, retention of food accumulation, phlegm internal stagnation, and prolapse of organs. 13 –15 Aurantii Fructus Immaturus (AFI) refers to the dried young fruit of Citrus aurantium L. and its cultivated varieties or Citrus sinensis Osbeck. It is believed to be effective in breaking down qi and eliminating stagnation, resolving phlegm, and dispersing lumps. In clinical settings, the fruit is primarily used for treating conditions such as internal stagnation and painful swelling, severe diarrhea, obstructed stool, stagnant phlegm, and organ prolapse. 16,17 AFI and AF are obtained from the same plant at different harvesting periods. AFI is obtained between May and June, while AF is obtained in July when the fruit skin is still green. According to literature, AFI was initially documented in Shen Nong Ben Cao Jing. Before the Six Dynasties, only AFI was noted and not AF. 18 It was not until after the Song Dynasty that the differentiation of functions between AFI and AF was clarified. The primary source before the Song Dynasty was Chinese citrus berries. Citrus aurantium only emerged after the Ming and Qing dynasties. 19 AF and AFI are all bitter, spicy, sour, and slightly cold to the spleen and stomach meridian. Both plants predominantly consist of flavonoids, volatile oil, coumarin, and a limited quantity of alkaloids and other constituents, but there are differences in their pharmacological effects. AFI is characterized by its bitter taste, cold nature, and ability to deliver fast and stable action. It is primarily used for the treatment of severe bloating and phlegm expulsion. AF, on the contrary, possesses a bitter and sour flavor, a slightly cold characteristic, and a gentle effect, making it effective for easing chest discomfort and enhancing gastrointestinal function. 20 It should be noted that both properties have their own emphasis and should not replace each other. Due to their common origin and similar chemical composition, distinguishing between AFI and AFI on the basis of color and size alone is a subjective judgment. Accurately identifying them is challenging. Scientists have investigated the chemical components of AF and AFI, but most studies focus on one or a few components, making it difficult to fully explain the differences between the two materials. 21 Therefore, it is essential to develop a novel approach to objectively compare the differences between AF and AFI to ensure clinical drug safety. In addition, the origin of herbs is also a matter of concern, as their pharmacodynamic components and pharmacological effects vary depending on the source and cultivation environment. 22 Jiangxi AF and Jiangxi AFI are considered to be of the highest quality according to TCM theory. However, the provenance of most herbs sold on the market today is uncertain and the quality cannot be guaranteed. As a result, it is crucial to implement a quality assessment scheme to distinguish between AF and AFI from various backgrounds and ensure their clinical effectiveness.
Drawing from background information, this research utilized HPLC fingerprinting, various chemometric methodologies, and network pharmacology to analyze the differences between the homologous herbs AF and AFI, with a specific focus on altering the chemical composition. The results of this study may be used as a foundation for further exploration of the variations in efficacy between them. Simultaneously, identification methods for the two drugs from varying places of origin were established to inquire into the inherent relationship between the “composition–quality” of the herbs. This will be an empirical basis for the development of a modern quality assessment system for AF and AFI.
MATERIALS AND METHODS
Plant materials and chemicals
A total of 30 batches of AF and 30 batches of AFI were collected from three provinces in China (Table 1 and Fig. 1). All plant materials were authenticated by Professor Lin Ma, School of Traditional Chinese Medicine, Tianjin University of Traditional Chinese Medicine, China, according to the Pharmacopoeia of the People’s Republic of China (2020 edition).
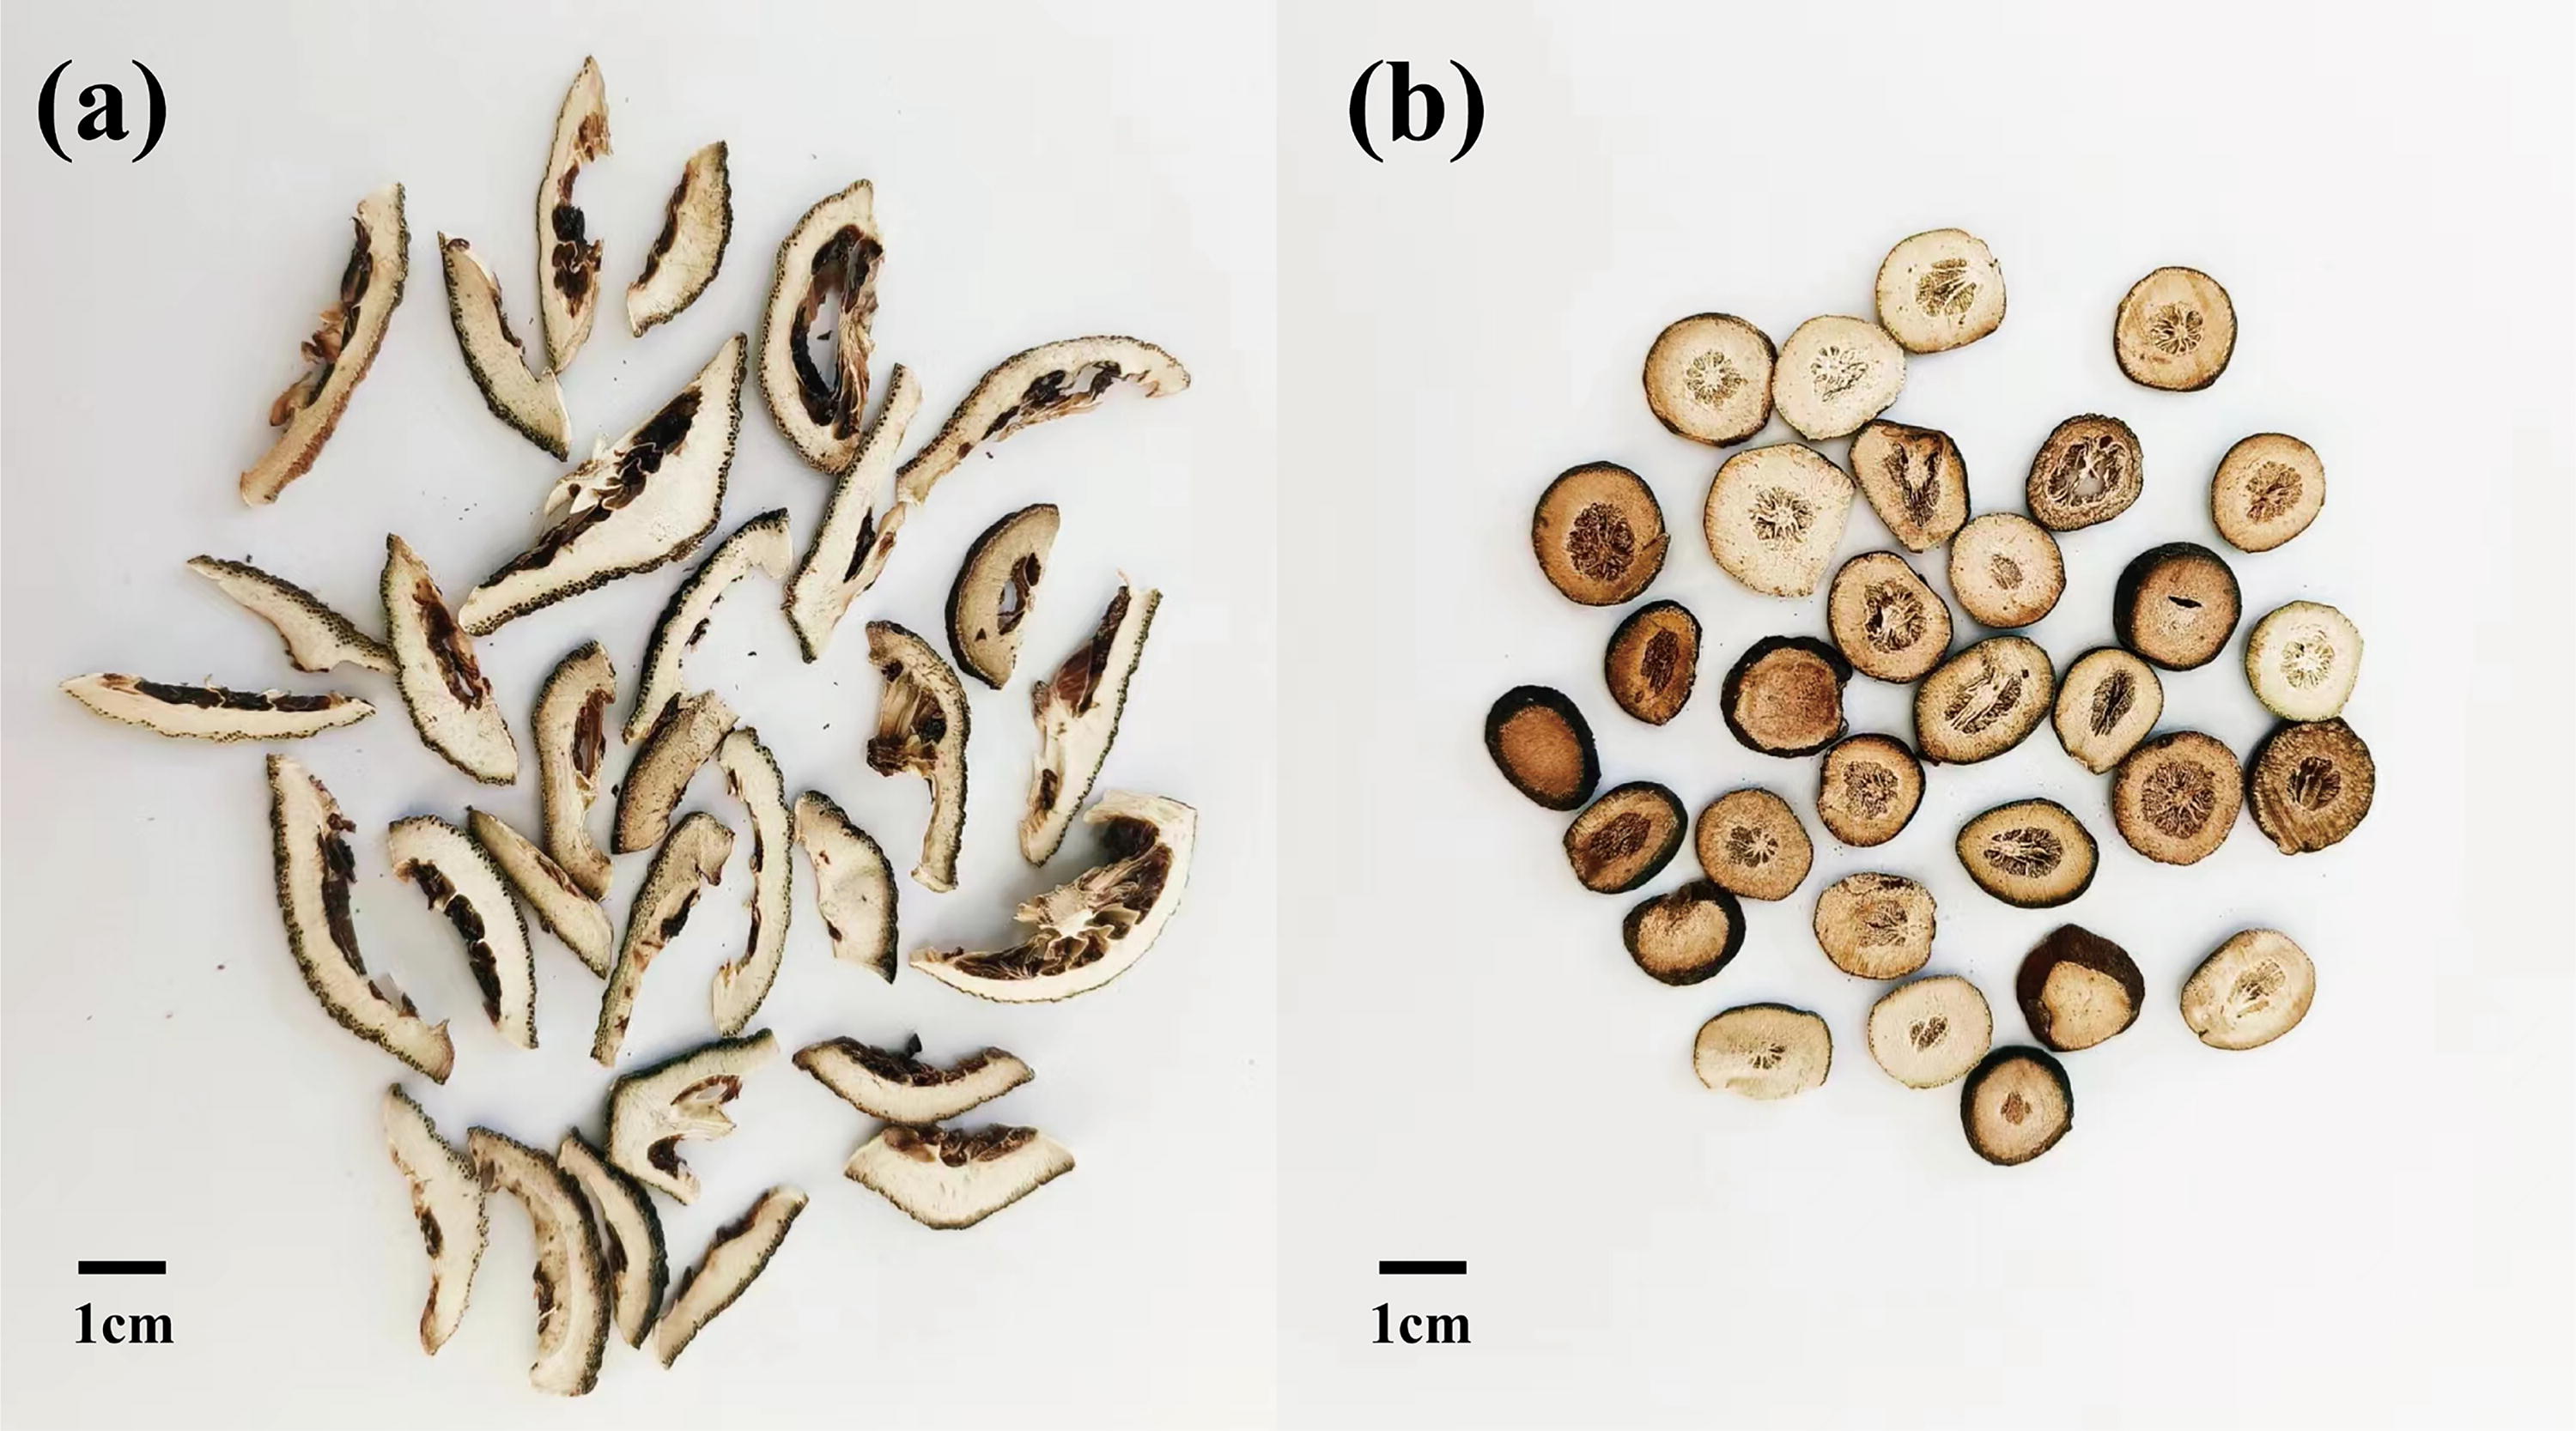
The picture of AF and AFI.
Description of Aurantii Fructus (ZQ) and Aurantii Fructus Immaturus (ZS) Samples
HPLC-grade methanol and acetonitrile were obtained from Sigma-Aldrich (St. Louis, MO, USA); HPLC-grade formic acid was purchased from Tianjin Komeo Chemical Reagent Co. Ltd (Tianjin, China), and distilled water was purchased from Watson Group Ltd (Hong Kong, China). The standard substances, including eriocitrin, narirutin, naringin, hesperidin, neohesperidin, meranzin hydrate, poncirin, naringenin, nobiletin, and tangerine (purity ≥98%), were obtained from Shanghai Yuanye Biotechnology Co. Ltd.
Preparation of sample solutions
All AF and AFI samples were powdered using a disintegrator and passed through a 50-mesh sieve. Subsequently, 50 mg aliquots of the powdered samples were dissolved in 5 mL of 100% methanol solution, sonicated for 30 min (400 W, 40 kHz), and centrifuged at 8000 rpm for 5 min to obtain the supernatant. Each sample was filtered through 0.22-μm nylon membrane. Each sample was processed three times in parallel.
Instrumentation and conditions
MS/MS analysis
The chromatographic column was Acquity UPLC BEH shield RP18 (2.1 × 100 mm, 1.7 μm), operated at 35°C. The mobile phases comprised acetonitrile (solvent A) and water containing 0.2% formic acid (solvent B). The flow rate was maintained at 0.2 mL/min, and the injection volume was 10 μL. The detection wavelength was set at 283 nm. The linear elution gradient was as follows: 0–10 min (10–21% A); 10–20 min (21–22% A), 20–25 min (22–46% A), 25–35 min (46–47% A), and 35–40 min (47–100% A).
The MS analysis was performed using electrospray ionization. The mass range was set at m/z 1000–1000 in positive ion modes. The capillary and cone voltages were set at 3 kV and 40 V, respectively. Source temperature and desolvation temperature were 120°C and 450°C, respectively. The desolvation gas flow was set at 600 L/h.
HPLC analysis
HPLC system (Waters e2695) was used to determine the chemical composition of each sample. The chromatographic column was Symmetry® C18 (4.6 × 150 mm, 5 µm), maintained at 35°C. The mobile phases contained water containing 0.3% formic acid (solvent A) and acetonitrile (solvent C) with a flow rate of 1.0 mL/min. The gradient elution procedure was as follows: 0–10 min (10–21% C), 10–20 min (21–22% C), 20–25 min (22–46% C), 25–35 min (46–47% C), and 35–40 min (47–100% C). The UV detection wavelength was set at 283 nm, and the injection volume was 10 μL.
Data analysis
Chemometric analysis
The liquid chromatography workstation software was used to obtain the chromatographic data such as peak area and retention time in the fingerprints of AF and AFI samples. The Chinese Medicine Chromatographic Fingerprint Similarity Evaluation System (2012 edition) was used for the similarity evaluation. HCA, PCA, and orthogonal partial least-squares discriminant analysis (OPLS-DA) models were established using SIMCA 14.1 software to obtain the chemical markers.
Network pharmacology analysis
The targets were retrieved from the Traditional Chinese Medicine System Pharmacology (TCMSP) and Swiss Target Prediction databases. Subsequently, the results were imported into the UniProt database for gene name standardization. The Cytoscape 3.10.1 software was used to construct the “drug–component–target” network.
The collected targets were subjected to protein–protein interaction (PPI) analysis using the String database and visualized by Cytoscape 3.10.1 software. The twofold median of degree, betweenness and closeness values were used as conditions to screen the core targets. These core targets were analyzed by Gene Ontology (GO) enrichment analysis and Kyoto Encyclopedia of Genes Genomes (KEGG) pathway analysis using the David database.
RESULTS AND DISCUSSION
Qualitative identification of compounds
The chemical constituents of AF and AFI were identified via ultra-high performance liquid chromatography with quadrupole time-of-flight mass spectrometry (UPLC-Q-TOF/MS). A total of 39 compounds in AF and 35 in AFI were detected using the retention times and mass-to-charge ratios of the compounds together with relevant literature information (Tables 2 and 3). The total ion chromatogram was shown in Supplementary Figure S1. The majority of these substances were flavonoids and dihydroflavonoids, with a few alkaloids and coumarins also present. Thirty-four of these constituents were common to both the AF and the AFI. Neoeriocitrin, neohesperidin, meranzin, limonin, and natsudaidain were detected only in AF, and isovitexin was detected only in AFI. These compounds are suggested to be the differential components of the two.
UPLC-Q-TOF/MS-Identified Compounds in Aurantii Fructus
UPLC-Q-TOF/MS-Identified Compounds in Aurantii Fructus Immaturus
Methodological verification of HPLC fingerprints
The precision and reproducibility were determined to evaluate the stability of the HPLC method. Naringin was used as the reference peak, and the relative standard deviation (RSD) values of relative retention time and relative peak area were calculated. Following the sample solution preparation method, six successive injections of the same AF sample solution were performed for HPLC analysis. The RSDs of relative retention time and relative peak area were less than 1.0% and 5.0%, respectively, demonstrating the high precision of the instrument. Six solutions of AF samples were simultaneously prepared according to the procedure described previously. The RSDs of the relative retention time and relative peak area were measured to be below 1.0% and 5.0%, respectively, which proved that the experiments could be repeated. The samples remained stable at room temperature for 24 h.
HPLC fingerprinting and chemometric analysis
HPLC fingerprinting analysis
The fingerprints of AF and AFI samples were established by HPLC (Fig. 2), and the chromatographic data were then imported into similarity software for analysis. The results showed that a total of 14 common peaks were obtained between 30 batches of AF and 30 batches of AFI samples. The similarities ranged from 0.030 to 0.220, indicating significant differences in the overall chemical composition of AF and AFI. A further individual analysis was carried out on 30 batches of AF and AFI. The analysis showed a total of 18 common peaks in 30 batches of AF, with similarity ranging from 0.045 to 0.999. Eighteen common peaks were identified in 30 AFI batches, with similarities between 0.087 and 0.999. These findings suggest individual differences among various batches of the same herb. These differences could be related to the impact of different origins and cultivation environments.
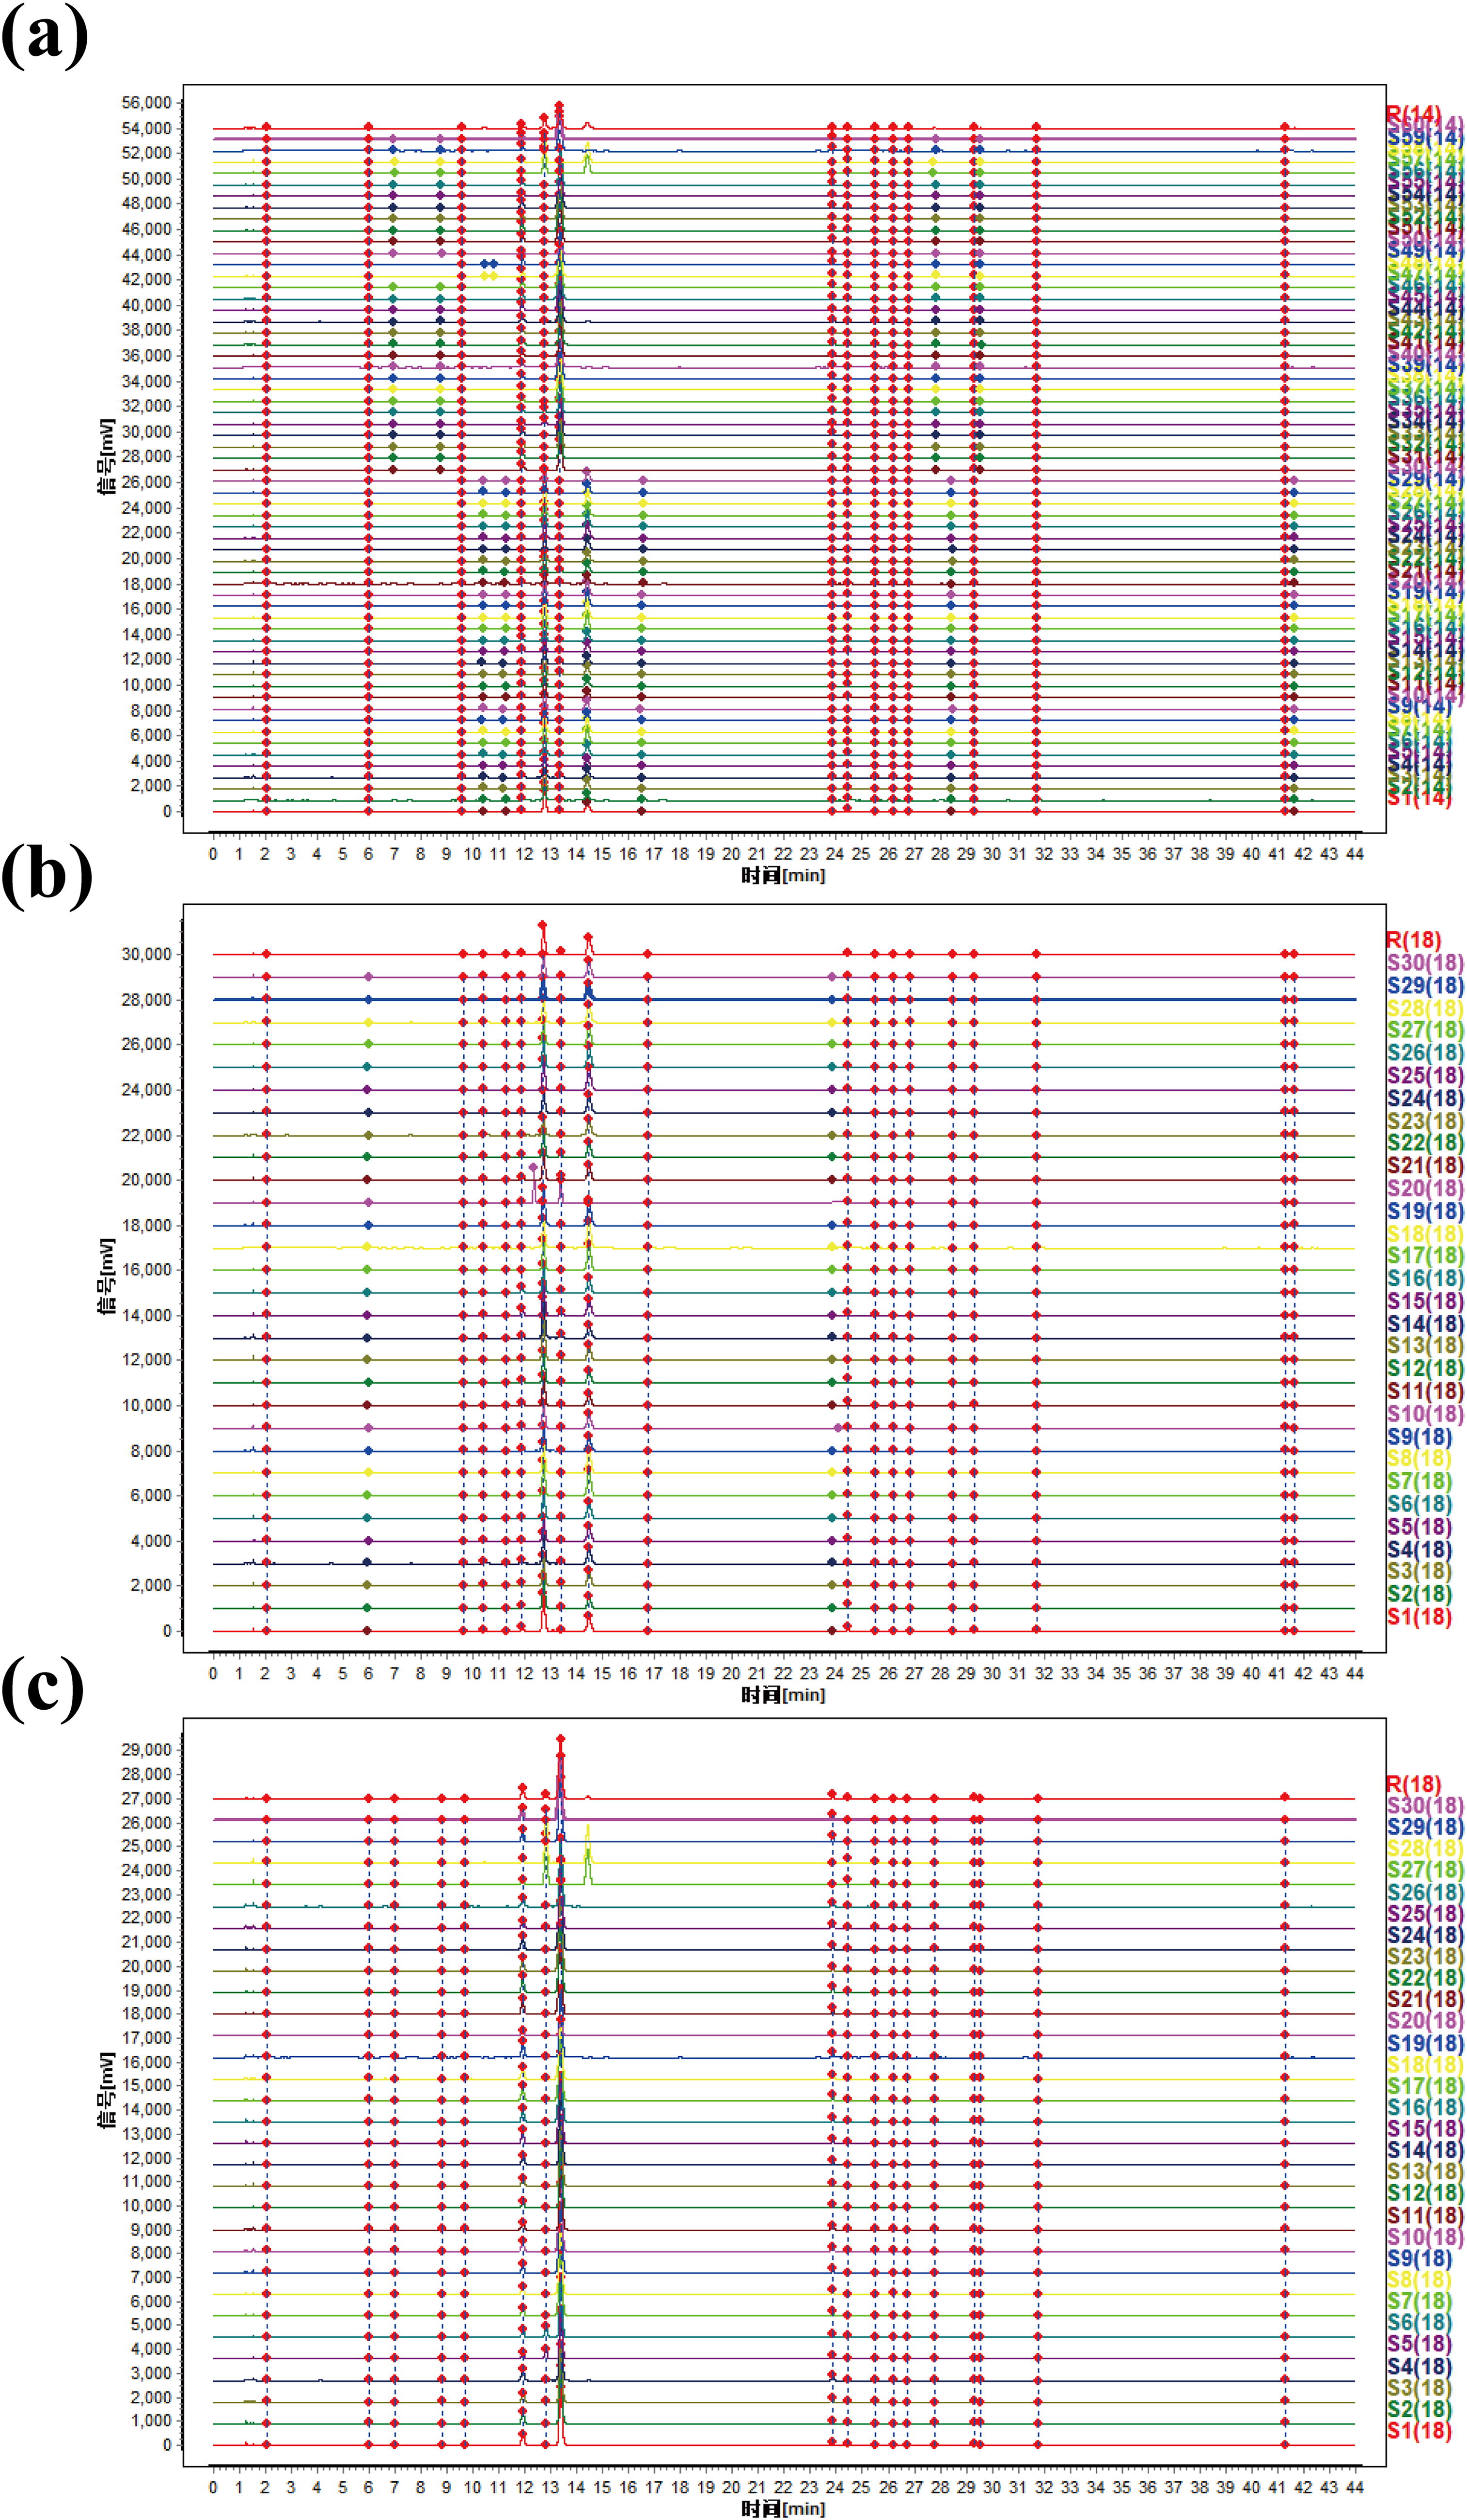
HPLC fingerprints of samples.
Chemometric analysis
HCA
HCA is an unsupervised multivariate analysis technique that classifies samples based on their characteristics and spatial similarity. 23 The data management function of the liquid-phase workstation was used to obtain retention time and peak area information for 30 batches of AF and AFI. The resulting data matrix was imported into SIMCA 14.1 and HCA was performed using Ward’s method. When the distance scale was approximately 800, AF and AFI samples could be divided into two categories (Fig. 3a): G1 (AF) and G2 (AFI). The classification result indicates significant chemical composition differences between AFI and AF.
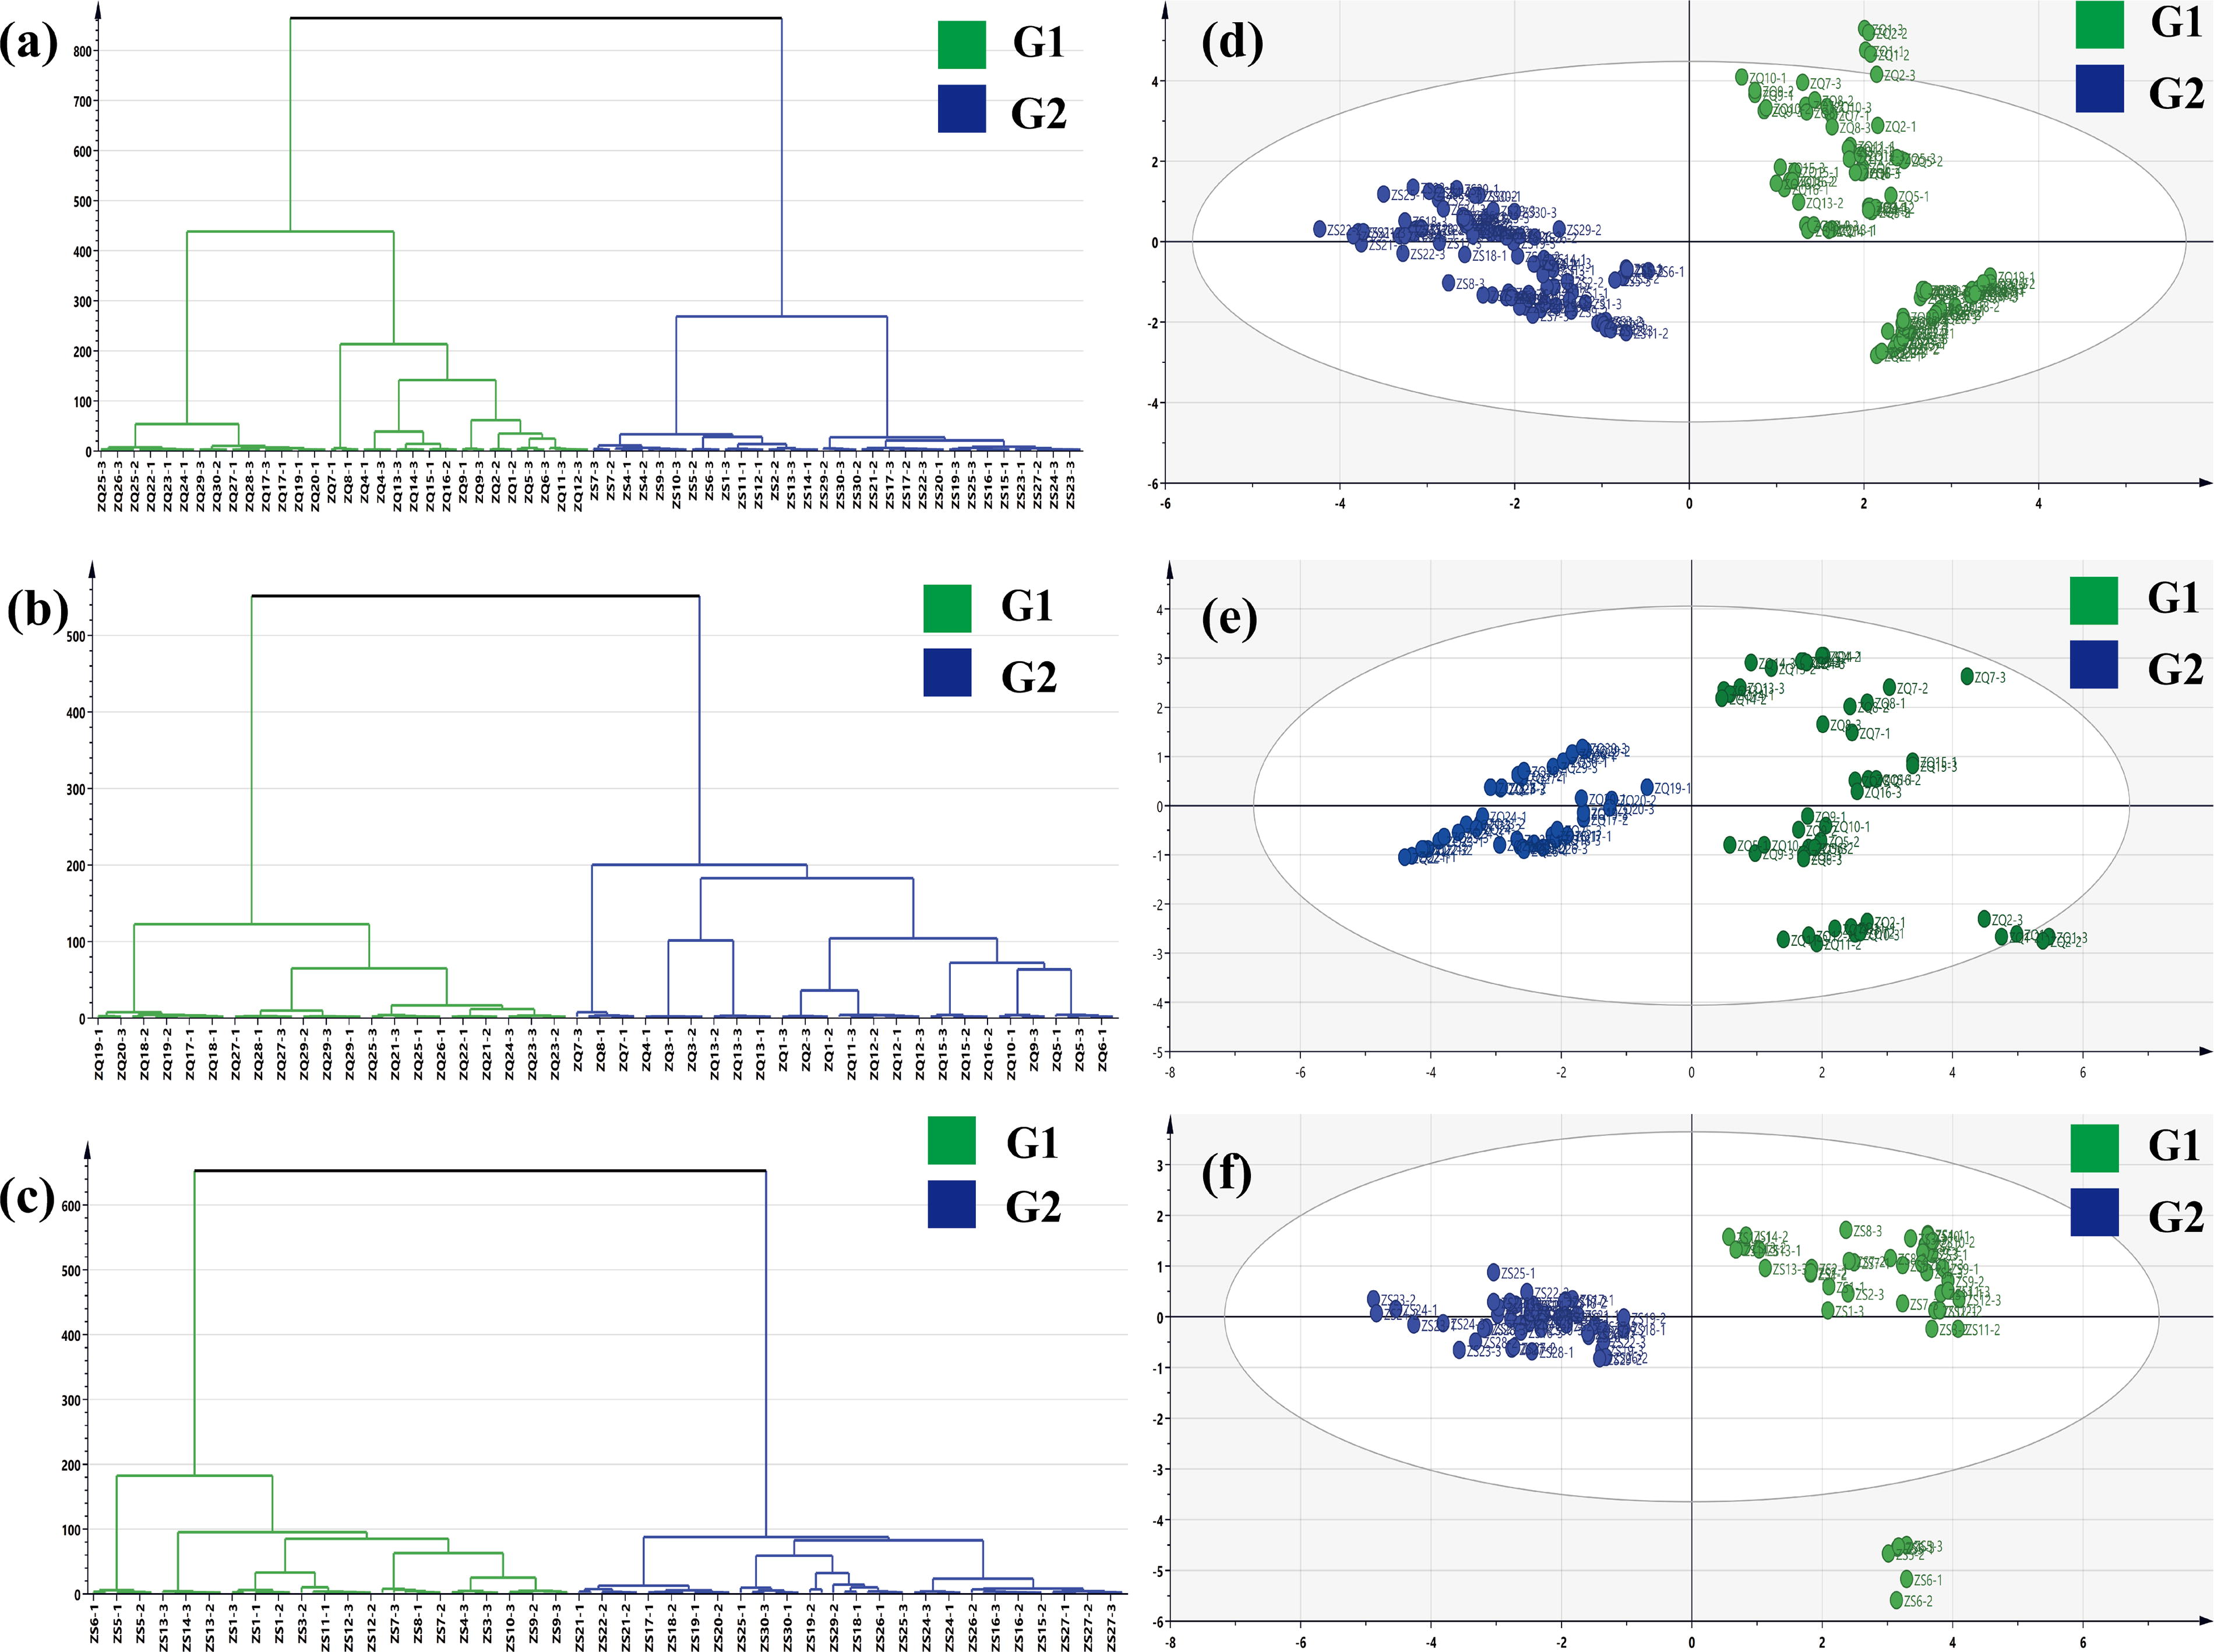
HCA and PCA plots of samples.
At a distance scale of about 500, the 30 batches of AF samples could be divided into two categories (Fig. 3b) as follows: G1 (originating from Sichuan and Hunan) and G2 (originating from Jiangxi). At a distance scale of about 600, 30 batches of AFI samples were also divided into the following two categories (Fig. 3c): G1 (originating from Jiangxi) and G2 (originating from Sichuan and Hunan). These findings indicate that the AF and AFI herbs sourced from Jiangxi significantly differed in chemical composition compared with those obtained from Sichuan and Hunan.
PCA
PCA is an unsupervised modeling method for data analysis. It offers a simple and systematic way to reduce the dimensionality of complex data while retaining much of the original information in the data. 24 A PCA model was created using SIMCA 14.1 to analyze 30 batches of AF and AFI samples. The PCA score plots indicated the classification of the samples into the following two categories (Fig. 3d): G1 (AF) and G2 (AFI). The R2X and Q2 values were reported to be 0.941 and 0.634, respectively, indicating that AF and AFI significantly differed in chemical composition.
Subsequently, individual analysis was conducted on both AF and AFI samples. A total of 30 batches of AF samples were categorized into the following two groups (Fig. 3e): G1 (originating from Jiangxi) and G2 (originating from Sichuan and Hunan), with respective R2X and Q2 values of 0.982 and 0.88. Similarly, 30 batches of AFI samples were grouped into the following two categories (Fig. 3f): G1 (from Jiangxi) and G2 (from Sichuan and Hunan) showing R2X and Q2 values of 0.968 and 0.535, respectively. These results indicated that the chemical composition of AF and AFI from Jiangxi significantly differed from those from Sichuan and Hunan. The PCA results above were consistent with the HCA results, demonstrating the accuracy of the model.
OPLS-DA
OPLS-DA is a widely used supervised pattern recognition model that is an upgraded version of PLS-DA. It incorporates orthogonal signal correction to improve the interpretation of variables. 25 To identify chemical markers, a supervised OPLS-DA model for 30 batches of AF and AFI was established, based on the unsupervised classification results mentioned previously. The prediction models were consistent with the PCA and HCA findings. The OPLS-DA models for AF and AFI revealed R2X and Q2 values of 0.677 and 0.968, respectively (Fig. 4a). For the AF model, the R2X and Q2 values were 0.602 and 0.943 (Fig. 4b), respectively, whereas for the AFI model they were 0.533 and 0.973, respectively (Fig. 4c). These outcomes indicate that the models possess high predictive capabilities.

OPLS-DA results and VIP plots of samples.
To assess the significance of each variable in classifying the chemical markers obtained, VIP plots were generated. For both the AF and AFI samples (Fig. 4d), variables 6, 5, 4, 7, 2, and 8 were found to have a VIP value >1. For the 30 batches of AF (Fig. 4e), variables 14, 5, 2, 11, 9, 1, 15, 13, and 6 had a VIP value >1. For the 30 AFI batches (Fig. 4f), variables 13, 16, 2, 14, 11, 15, 6, 1, and 17 had a VIP value >1. Consequently, it can be concluded that these chemical variables play a crucial role in their respective classifications.
Network pharmacology analysis
Based on the above classification results and analysis of relevant references, the chemical markers screened with VIP values >1 that had already been identified were selected for network pharmacological analysis, including eriocitrin, narirutin, naringin, meranzin hydrate, naringenin, hesperidin, nobiletin, tangeretin, neohesperidin, and poncirin. 26 –28 The targets of the above compounds were retrieved from the TCMSP database and the Swiss Target Prediction database. Then, the protein names were converted to gene names using the UniProt database. Subsequently, the drug components and targets were imported into Cytoscape 3.10.1 software to construct a “drug–component–target” network (Fig. 5a). The network comprises 230 nodes and 498 edges, of which 2 are drug nodes (green) and 10 are active ingredient nodes (blue); all other nodes (orange) represent targets. The figure illustrates that the ten active ingredients operate on various targets. Similarly, a single target can be related to multiple active ingredients, indicating that AF and AFI play an effective role through multicomponent and multitarget interactions.

PPI networks of collected targets were constructed using the String database (Fig. 5b). The connecting lines between the nodes represent the interactions between the targets. Different line colors indicate different types of interactions; the more connecting lines, the closer the interactions. The graph contains 218 nodes and 2385 edges, with an average node degree of 21.9 and an average local clustering coefficient of 0.529. The PPI network was visualized and analyzed by Cytoscape 3.10.1 software, and 54 core targets were screened. The top six nodes with the highest degree values were AKT1 has no spelled-out form, but it is also known as Protein Kinase B (Protein Kinase B, PKB) (AKT1), tumor necrosis factor (TNF), epidermal growth factor receptor (EGFR), estrogen receptor 1 (ESR1), B-cell lymphoma-2 (BCL2), and Caspase-3 (CASP3), suggesting that these proteins may be the key targets for the functioning of AF and AFI.
To better understand the target–pathways relationship, GO functional enrichment analysis and KEGG pathway enrichment analysis were performed on the core targets using the David database. Both results were considered significant with a P value < .05. GO enrichment analysis revealed a total of 480 entries, with 345 classified as biological processes (BPs), including protein phosphorylation, response to xenobiotic stimulus, protein autophosphorylation, negative regulation of apoptotic process, and positive regulation of protein kinase B signaling. The study identified 53 cellular components, comprising receptor complex, cytosol, extracellular exosome, plasma membrane, and cytoplasm. It also found 82 molecular functions, including carbonate dehydratase activity, hydrolyase activity, protein tyrosine kinase activity, ATP binding, and protein kinase activity. The KEGG enrichment analysis showed 131 pathways, such as Phosphoinositide 3-kinase (PI3K)/protein kinase B (AKT) (PI3K-Akt) pathway, nuclear factor kappa-B (NF-κB) signaling pathway, Hypoxia-inducible factor-1 (HIF-1) signaling pathway, p53 signaling pathway, and Ras signaling pathway. According to the P value, the 20 most significant GO entries and KEGG pathways were selected for mapping, respectively (Fig. 5c and 5d).
Content determination of representative chemical markers
The contents of the chemical markers screened above were determined, including eriocitrin, narirutin, naringin, meranzin hydrate, naringenin, hesperidin, nobiletin, tangeretin, neohesperidin, and poncirin. Ten compounds displayed good linearity within the specified concentration ranges (Supplementary Table S1). To assess the accuracy of the established method, the recoveries were performed using the standard addition method. The results are presented in Supplementary Tables S2 and S3. The recovery rates of ten components in AF were as follows: 99.16%, 101.53%, 100.29%, 99.68%, 100.85%, 99.61%, 100.43%, 99.72%, 101.48%, and 100.11%, with RSDs of 2.31%, 2.37%, 0.66%, 1.95%, 2.30%, 1.64%, 2.20%, 0.94%, 1.62%, and 1.57%, respectively. Eight components in AFI had recovery rates of 100.81%, 100.53%, 99.70%, 101.12%, 101.66%, 99.72%, 99.98%, and 101.25%, with RSDs of 2.23%, 2.72%, 1.54%, 2.21%, 2.57%, 2.28%, 1.53%, and 1.92%, respectively. These results demonstrate that the recoveries met the required standards.
The contents of the representative chemical markers in AF and AFI were determined according to the sample solution preparation methods and chromatographic conditions (Supplementary Tables S4 and S5), and the findings were represented through bar charts (Fig. 6 and Supplementary Fig. S1). The results of the analysis of variance for all components demonstrated a statistically significant difference (P < .05). This indicated that there were significant differences in the content of all eight components in AF and AFI, with the overall content of AFI being higher than that of AF. Flavonoids are the primary active ingredients shared by both. The content of eriocitrin, narirutin, naringenin, hesperidin, and nobiletin was higher in AF compared with AFI. In contrast, naringin, poncirin, and tangeretin levels in AF were lower than in AFI. Neither component, meranzin hydrate or neohesperidin, was detected in AFI. These results demonstrate a significant variation in the types and quantities of chemical constituents during the growth process from AFI to AF. As the fruit matured, a gradual decrease in the amounts of hesperidin and narirutin was observed, whereas the levels of naringin and neohesperidin showed a significant increase.

Comparison of the representative chemical markers in AF and AFI (*indicates a statistical significance; P < .05).
Differences in chemical composition may account for the varying effectiveness of the two medicines. The literature suggests that hesperidin promotes gastric emptying and small intestinal propulsion. 29,30 AFI contains a notably higher amount of hesperidin than AF, leading to a more rapid and effective promotion of gastrointestinal motility. Therefore, AFI is frequently used to disperse severe abdominal distention and to eliminate phlegm. Naringin and neohesperidin components can inhibit the expression of inflammatory signaling pathways and proinflammatory cytokines and regulate intestinal microbiota. Consequently, AF has more robust anti-inflammatory properties than AFI and shows potential for improving obesity-related metabolic disorders. 31,32 Moreover, flavonoids are essential in preventing oxidative stress, inhibiting apoptosis, and improving cognitive deficits, indicating that AF and AFI possess antioxidant, hepatoprotective, and neuroprotective effects. 33,34
CONCLUSIONS
AF and AFI are herbs derived from the same botanical source but have distinctly different harvesting times. Due to the differences in maturity resulting in different efficacy, these herbs are classified as homologous with different effects and should not be mixed. Therefore, it is crucial to investigate the differences between AF and AFI to ensure the safety of clinical drugs. Furthermore, growing herbs in different environments and under different conditions may affect the quality of plants. Consequently, identifying the source of herbs is crucial to establish quality standards. In this study, compounds in AF and AFI were identified based on UPLC-Q-TOF-MS. Then, the HPLC fingerprints of the two herbs were established, and the data were analyzed by chemometrics. HCA and PCA results revealed that AF and AFI were classified into two distinct categories. Similarly, AF and AFI from different origins were also clustered. Ten chemical markers were screened through OPLS-DA modeling. Subsequently, network pharmacology was used to correlate these markers with biological networks, and a total of 54 core targets were screened. Clinically, AF and AFI are primarily used to treat functional dyspepsia (FD), diabetes, and obesity. In addition, they also exhibit pharmacological effects such as anti-inflammatory, antitumorigenic, antidepressant, and neuroprotective actions. 35,36 These proteins may serve as the key targets for the therapeutic effects of AF and AFI. Among them, AKT1 plays an important role in the regulation of protein synthesis, cell survival, and angiogenesis, as well as insulin-dependent cellular response and metabolism. 37 TNF is a tumor necrosis factor that has been shown to influence cell proliferation and differentiation, as well as immune and inflammatory responses. 38 EGFR is the epidermal growth factor receptor that attenuates the associated inflammatory response by regulating the expression of the MAPK signaling pathway. Its phosphorylation can activate the PI3K-AKT signaling pathway, thus regulating cell proliferation and metabolism. 39 Estrogen can inhibit gastric emptying and gastric acid secretion, which is very closely related to FD. ESR1, as an estrogen receptor, is a potential treatment for FD by modulating endocrine pathways to maintain normal estrogen levels. 40 Bcl-2 is a protein that plays a crucial role in the apoptotic process. Increased expression of Bcl-2 can impede the apoptotic process, exerting reno protective effects and mitigating the advancement of diabetic nephropathy. 41 CASP3 is also a protease involved in the process of apoptosis. It has been demonstrated that its increased expression promotes adipocyte catabolism and inhibits adipocyte production, thereby treating obesity. 42 GO enrichment and KEGG pathway analyses revealed a total of 480 key BPs and 131 metabolic pathways. Among them, the inhibition of the NF-κB pathway has been demonstrated to reduce the production of IL-6 in adipocytes in the bone marrow, thereby preventing obesity-induced bone loss and ameliorating obesity-related bone diseases. 43 The PI3K-Akt signaling pathway is a crucial intracellular signaling pathway. Studies have demonstrated that impairments in its signaling may result in neuronal damage, which may subsequently lead to bipolar disorder). 44 The upregulation of gastric mucosal HIF-1α expression has been demonstrated to promote cell proliferation and differentiation, thereby facilitating ulcer healing and protecting the gastric mucosa. 45 In response to cellular stress, p53 prevents cells with mutated or damaged DNA from differentiating by regulating the expression of genes involved in cell apoptosis and cell cycle, which is a contributing factor to its tumor suppressor ability. 29 Finally, the study determined the content of ten differential components in both drugs.
This experiment aimed to investigate the material basis for AF and AFI, which have identical origins but different efficacies, from the perspective of changes in chemical composition. In addition, identification methods for AF and AFI from different origins had been established. It provided a reference basis for establishing a modern quality evaluation system for both plants. In addition, this study revealed that AF and AFI exert significant effects in the treatment of dyspepsia, obesity, blood sugar regulation, and antioxidant activity. Future studies may consider incorporating them into functional foods or dietary supplements, thereby offering a novel approach for AF and AFI to contribute to public health and industrial quality enhancement. It had significant implications for the development of the food, pharmaceutical, and health care industries.
Footnotes
AUTHORS’ CONTRIBUTIONS
J.G., M.L., and Z.Y.: Conducting experiments and writing the article. X.Z. and Z.M.: Processing of experimental data. L.S.: Designing experiments. Y.L. and X.R.: Supervising and investigating.
AUTHOR DISCLOSURE STATEMENT
The authors declare no conflict of interest.
FUNDING INFORMATION
This work was supported by Tianjin Graduate Research Innovation Project (2022BKY197), TUTCM Graduate Research Innovation Project (YJSKC-20221003), the Science & Technology Development Fund of Tianjin Education Commission for Higher Education (2023ZD026), and the National Natural Science Foundation of China (82074280).
SUPPLEMENTARY MATERIAL
Supplementary Figure S1
Supplementary Figure S2
Supplementary Table S1
Supplementary Table S2
Supplementary Table S3
Supplementary Table S4
Supplementary Table S5
References
Supplementary Material
Please find the following supplemental material available below.
For Open Access articles published under a Creative Commons License, all supplemental material carries the same license as the article it is associated with.
For non-Open Access articles published, all supplemental material carries a non-exclusive license, and permission requests for re-use of supplemental material or any part of supplemental material shall be sent directly to the copyright owner as specified in the copyright notice associated with the article.
