




Abstract
This study aimed to investigate the hypoglycemic effects of different concentrations of black tea (BT) extracts and their underlying mechanisms in type 2 diabetic (T2DM) mice. Results indicated that BT extracts significantly mitigated weight loss, improved glucose and insulin tolerance, and modulated cytokine levels related to glucose and lipid metabolism in T2DM mice. Moreover, BT extracts ameliorated liver and pancreas damage resulting from high-sugar/high-fat diets and insulin resistance. Among the tested concentrations, low-concentration BT (BT-L) extract exhibited the most potent hypoglycemic ability. Furthermore, BT-L restored pancreatic function in hyperglycemic mice via activating the glucagon-like peptide-1 receptor–protein kinase A–pancreatic and duodenal homeobox-1–glucokinase cascade pathway. In terms of intestinal homeostasis, all BT-treated groups adjusted the gut microbiota structure by regulating the distribution and diversity of gut microbiota in T2DM mice. Among them, BT-L intervention specifically and significantly increased the levels of probiotic Bifidobacterium in the intestine of T2DM mice. Furthermore, BT-L intervention effectively promoted the synthesis of streptomycin by gut microbiota, thereby exerting anti-inflammatory effect. Comprehensively, the hypoglycemic effect of BT cannot show an absolute concentration-dependent relationship. Our findings highlight the potential of BT as an effective blood glucose regulator and provide valuable insights for BT-based functional food development.
INTRODUCTION
A high-fat or high-sugar diet can disrupt glucose metabolism and contribute to the development of diabetes. Diabetes is a significant health concern in modern society, with an estimated 537 million adults (aged 20–79 years) affected as of 2021. 1 Among these cases, type 2 diabetes (T2DM) accounts for more than 90%. 2 T2DM is a complex metabolic disorder characterized by insufficient insulin action or insulin resistance (IR) in target organs due to pancreatic β-cell dysfunction. 2 Excessive consumption of sugar and fat is widely believed to increase the risk of T2DM and contribute to intestinal microbial imbalances. 3
The gut microbiome consists of a diverse range of bacteria that play crucial roles in immune system regulation and energy metabolism. 4 Growing evidence from both animal and human studies indicates a close association between the gut microbiome and the development and progression of T2DM. 5,6 Unhealthy and irregular diets can lead to a reduction in beneficial flora and an increase in harmful, potentially pathogenic flora in the gut. For instance, a high-fat diet has been found to significantly elevate the levels of Escherichia coli, Klebsiella, and Shigella in the gut microbiota while decreasing Lactobacillus and Bifidobacterium, which are indicators of T2DM development and progression. 7 Conversely, a high-fiber diet was shown to improve the abundance of beneficial intestinal microorganisms, such as Lactobacillus and Bifidobacterium, and decrease the prevalence of opportunistic pathogens such as Desulfovibrio and Klebsiella in individuals with T2DM. 5 Consequently, promoting gut microbiota homeostasis through dietary management may offer a novel approach for preventing and managing T2DM.
Studies have shown that incorporating plant-based foods and dietary components into one’s diet may lower the risk of T2DM by mitigating IR and modulating the composition of gut microbiota. 8 Tea, a traditional health beverage, contains various natural bioactive components with hypoglycemic effects, such as tea polyphenols and tea polysaccharides. 9 Extensive research has demonstrated that tea can effectively reduce serum glucose levels and improve diabetes by enhancing glucose metabolism and enriching probiotic flora in the intestinal tract. 10,11 Black tea (BT), being a fully fermented tea, contains diverse active constituents such as theaflavins and theobromine. 12 Studies have indicated that fermented tea can activate signaling pathways such as Phosphoinositide 3-kinase/Protein kinase B (PI3K/Akt) and AMP-activated protein kinase (AMPK), which facilitate Glucose transporter type 4 (GLUT4) translocation and increase insulin receptor expression in skeletal muscle, thereby improving impaired glucose tolerance. 13 In our previous study, we found that both green and BT can positively modulate the composition and diversity of intestinal flora by regulating gene or protein expression related to glucose and lipid metabolism, consequently exhibiting hypoglycemic effects. 14 However, there remains a gap in our understanding of the mechanistic aspects underlying the hypoglycemic effects of BT. To address this, we investigated the role and mechanism of BT at various concentrations in the hypoglycemic process, aiming to establish a scientific foundation for using BT as a natural product to improve diabetes.
MATERIALS AND METHODS
Materials and reagents
The BT was purchased from Enshi Selenium Impression Agricultural Technology Co., Ltd (Hubei Province, China). The blood glucose (BG) test strips were purchased from Roche Diagnostics Co., Ltd (Shanghai, China). Total cholesterol (TC), triglyceride (TG), high-density lipoprotein cholesterol (HDL-C), low-density lipoprotein cholesterol (LDL-C), glycation serum protein (GSP), aspartate transaminase (AST), alanine transaminase (ALT), free fatty acids (FFA), C-peptide (C-P), glutathione (GSH), malondialdehyde (MDA), and superoxide dismutase (SOD) assay kits were purchased from Nanjing Jiancheng Bioengineering Institute (Nanjing, China). All other chemicals were of analytical grade.
Aqueous extract preparation
A designated quantity of tea leaves was pulverized and added to ultrapure water at a ratio of 1:10 (based on the dry weight of the tea powder). The resulting mixture was placed in a preheated water bath at 90°C for a duration of 2 h, while maintaining continuous stirring. Afterward, the mixture was centrifugated at 5000 rpm for 10 min to separate and collect the supernatant. LXJ-IIB low-speed large-capacity multi-tube centrifuge, Shanghai Anting Scientific Instrument Factory, Shanghai, China. The above steps were then repeated. The supernatants obtained from both centrifugation steps were combined and subjected to ultrafiltration, rotary evaporation, and freeze-drying processes to yield the final tea extract sample.
Animal experiment design
All animal experiments were conducted strictly in compliance with the Experimental Animal Ethics Standards of the Experimental Animal Ethics and Use Committee of Shanghai Jiao Tong University (Approval No. A2020002).
Forty 4-week-old C57BL/6J specific pathogen-free mice were provided by Shanghai Slaughter Animal Center (Shanghai, China). The mice were divided into five groups (eight mice per group), including the normal group (NC), model group (MC), low-concentration BT group (BT-L, 200 mg/kg), medium-concentration BT group (BT-M, 400 mg/kg), and high-concentration BT group (BT-H, 800 mg/kg). All mice were acclimated to the new environment in the first week. The mice in the NC group were fed normal chow from the second to the seventh week, and the rest were fed high-sugar and high-fat chow. On day 1 of the eighth week, all mice were fasted without water for 12 h. Mice in the NC group were injected intraperitoneally with 0.1 M citrate-sodium citrate buffer (pH = 4.5) and the rest of the group were injected with 50 mM streptozotocin (STZ, dissolved in 1 M citrate-sodium citrate buffer) at a dose of 50 mg/kg body weight (BW), three times on alternate days. After 1 week of STZ injection, the mice were tested for fasting blood glucose (FBG), and the T2DM model was considered successfully constructed if the FBG was ≥11.0 mmol/L. 11 After that, the NC group continued to receive a normal diet, while the remaining groups received a high-sugar and high-fat diet. Meanwhile, the BT intervention groups received different concentrations of tea extracts (200, 400, and 800 mg/kg) for 8 weeks. During the intervention period, the BWs and FBG of the mice were monitored regularly. A total of 12 h of fasting without water was performed before FBG measurement, while tail vein blood was collected and BG level was measured. At the end of the experiment, serum was collected and mice were euthanized, and liver and pancreas tissues were collected immediately.
Oral glucose tolerance test and insulin tolerance test
At the end of the experiment, oral glucose tolerance test (OGTT) and insulin tolerance test (ITT) were conducted on the mice. Prior to the tests, the mice underwent a 4-h fasting period with access to water. Baseline BG levels were measured by sampling from the tail vein to establish the initial 0-min BG value. Subsequently, all mice received an intraperitoneal injection of insulin solution (0.75 U/kg) for the ITT assay. Blood samples were collected at 15, 30, 45, and 60 min after injection, and BG levels were recorded for the OGTT assay.
Histological analysis
The liver and pancreas were immersed in neutral formalin for fixation. Subsequently, the tissues were dehydrated, embedded in paraffin, sectioned, baked, and stained for further pathological analysis.
Biochemical parameter analysis in serum
The levels of TC, TG, HDL-C, LDL-C, GSP, AST, ALT, FFA, C-P, GSH, and MDA, as well as the activity of SOD, in the serum were measured using the corresponding commercial kits.
Key enzyme activity analysis in liver glucose metabolism
The activity of glycogen synthase kinase-3 beta (GSK-3β) and phosphoenolpyruvate carboxylase kinase (PEPCK) in the liver was determined using Enzyme-linked immunosorbent assay (ELISA) kits following the provided instructions.
Real-time quantitative PCR analysis
Total RNA was isolated from the pancreatic tissue samples using Trizol Reagent (Service, Wuhan, China). Subsequently, cDNA was synthesized through reverse transcription. The mRNA expression levels of glucose transporter 2 (GLUT2), insulin receptor substrate 1 (IRS-1), protein kinase A (PKA), pancreatic/duodenal homeobox-1 (PDX-1), glucagon-like peptide 1 receptor (GLP-1R) and glucokinase (GCK) in the tissue were detected using SYBR Green I (SYBR) fluorescent dye in a qPCR assay. A light qPCR kit (High ROX, Wuhan, China) was utilized for this purpose. The specific primers used for amplification are presented in Supplementary Table S1.
Immunohistochemical and immunofluorescent analysis
The embedded pancreatic tissue sections were deparaffinized and rehydrated. The sections were placed in a repair buffer with a pH of 6.0 to facilitate antigen retrieval. Once antigen retrieval was completed, the sections were exposed to a 3% H2O2 solution at room temperature for 25 min while being shielded from light. Subsequently, the slides were washed three times in pH = 7.4 Phosphate-buffered saline (PBS) to block endogenous peroxidase activity. Following this, serum blocking was performed for 1 h, and then these sections were subsequently incubated with primary antibodies at 4°C overnight and secondary antibodies for 1 h at room temperature.
The sections used for immunohistochemistry staining were then subjected to 3,3'-Diaminobenzidine (DAB) staining and nuclear counterstaining. After dehydration and mounting, the slides were observed under upright biological microscope (Eclipse Ci-L, Nikon, Japan) to evaluate protein expression. The sections used for immunofluorescence staining were further washed and stained with 4',6-Diamidino-2-phenylindole (DAPI) to capture images under upright fluorescence photography microscope (Eclipse Ci-L, Nikon, Japan).
Sequencing analysis of gut microbiota
Fecal samples of mice were taken and collected in sealed sterile plastic tubes. After sampling, the feces were immediately frozen with liquid nitrogen and stored at −80°C. The analysis method was carried out according to the previous report of our lab. 11
Statistical analysis
All statistical data were reported as means ± standard deviations. Statistical analyses were conducted using SPSS (Inc., Chicago, IL, United States) and GraphPad Prism 9.0 (GraphPad Software Inc., San Diego, CA, United States). Group comparisons were assessed using t-tests for comparisons between two groups, whereas one-way analysis of variance followed by the Tukey test was employed for multiple group comparisons. Pearson correlation analysis was performed using SPSS 20.0. A significance level of P < .05 was considered statistically significant.
RESULTS
Effects of different concentrations of BT intervention on various physiological indicators in mice
As depicted in Figure 1A and B, the BW of mice in the MC group consistently declined throughout the experimental period due to the effects of T2DM. In contrast, there were no significant increases or decreases observed in the BW of mice with T2DM that were administered different concentrations of BT intervention. Mice in the NC group gradually increased BW under a normal diet, with a statistically significant difference observed only at the eighth week. As shown in Figure 1C and D, the FBG levels in the NC group remained within the normal range (FBG ≤ 7 mmol/L) throughout the experimental period. Conversely, the FBG levels of mice in the MC group displayed a continuous and significant increase over time. After the intervention of different concentrations of BT, the rise in BG levels in T2DM mice was significantly suppressed, with the BT-L group showing the most pronounced hypoglycemic effect.
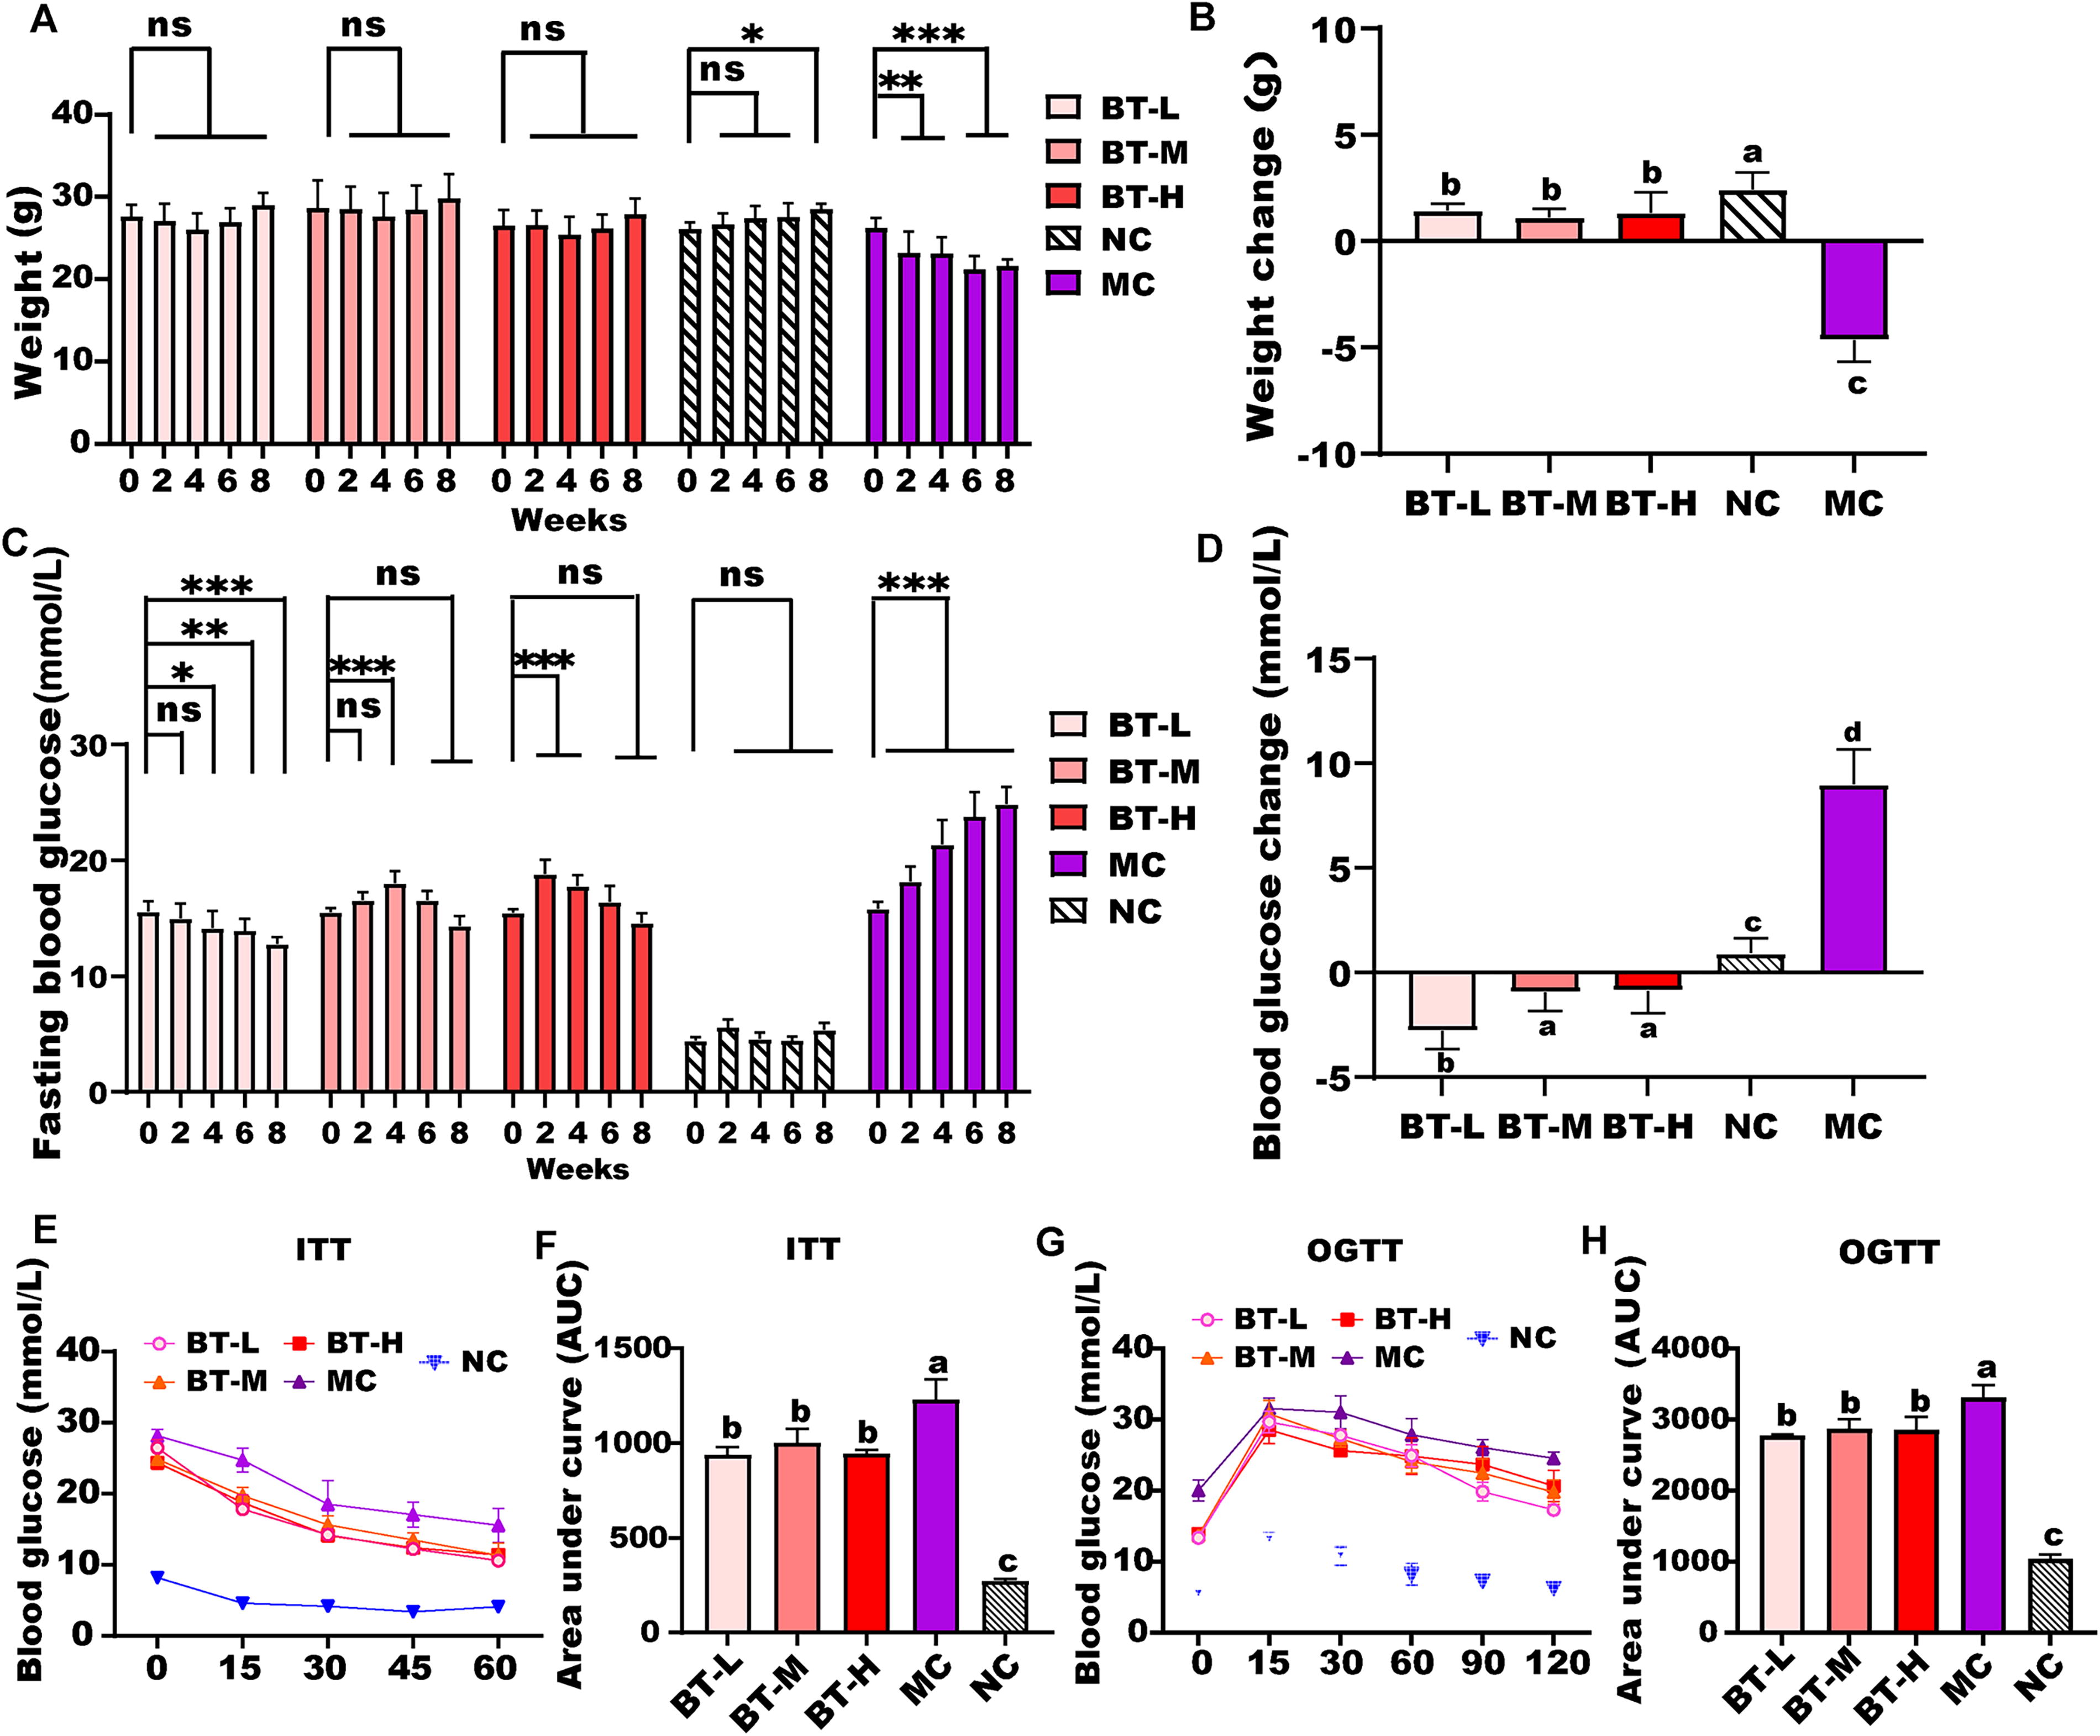
Effects of different concentrations of BT extracts intervention on various physiological parameters of mice, including BW
Effects of different concentrations of BT on glucose tolerance and insulin tolerance in mice
As shown in Figure 1E, the BG concentrations of mice in the MC group and the different concentrations of BT intervention groups exhibited a continuous decrease following insulin injection. Notably, the BG levels in the MC group remained consistently higher than those in the three BT intervention groups. Upon comparing the Area under the curve (AUC) of the ITT for each group (Fig. 1F), it was observed that the BT intervention at different concentrations significantly improved the insulin tolerance of T2DM mice (P < .01). However, no significant differences were observed between the different BT intervention groups. In Figure 1G, the BG levels in the MC group exhibited a rapid and substantial increase, followed by a relatively slower decrease, indicating impaired glucose tolerance. Comparing the AUC of the OGTT for each group (Fig. 1H), it was found that the BT intervention at different concentrations significantly enhanced the glucose tolerance of T2DM mice (P < .01). Nevertheless, there were no significant differences observed between the various BT intervention groups.
Effects of different concentrations of BT intervention on biochemical parameters in serum
The serum lipid metabolic factors were evaluated across all experimental groups. As illustrated in Figure 2A–H, BT administration significantly ameliorated the elevated glucose and lipid levels in the serum of T2DM mice. Specifically, BT intervention at different doses resulted in significant reductions in LDL-C, FFA, GSP, and AST/ALT levels, while concomitantly elevating HDL-C levels (P < .001). Notably, BT-L caused the greatest decreases in TC concentrations, while the three dose groups exhibited comparable effects on other serum metabolic indices. These findings suggest that BT, across various concentrations, possesses a favorable capacity to regulate glucolipid metabolism and confer hepatoprotection. As depicted in Figure 2I–K, no statistically significant differences were observed in SOD activity between the BT intervention groups and the MC group (P > .05). Both BT-H and BT-M groups exhibited elevated GSH levels, with BT-H demonstrating superior efficacy. Furthermore, all BT concentrations significantly attenuated MDA levels, indicating a general beneficial capacity of BT in regulating lipid metabolism. However, no significant inter-group differences were observed among the three BT concentrations (P > .05).
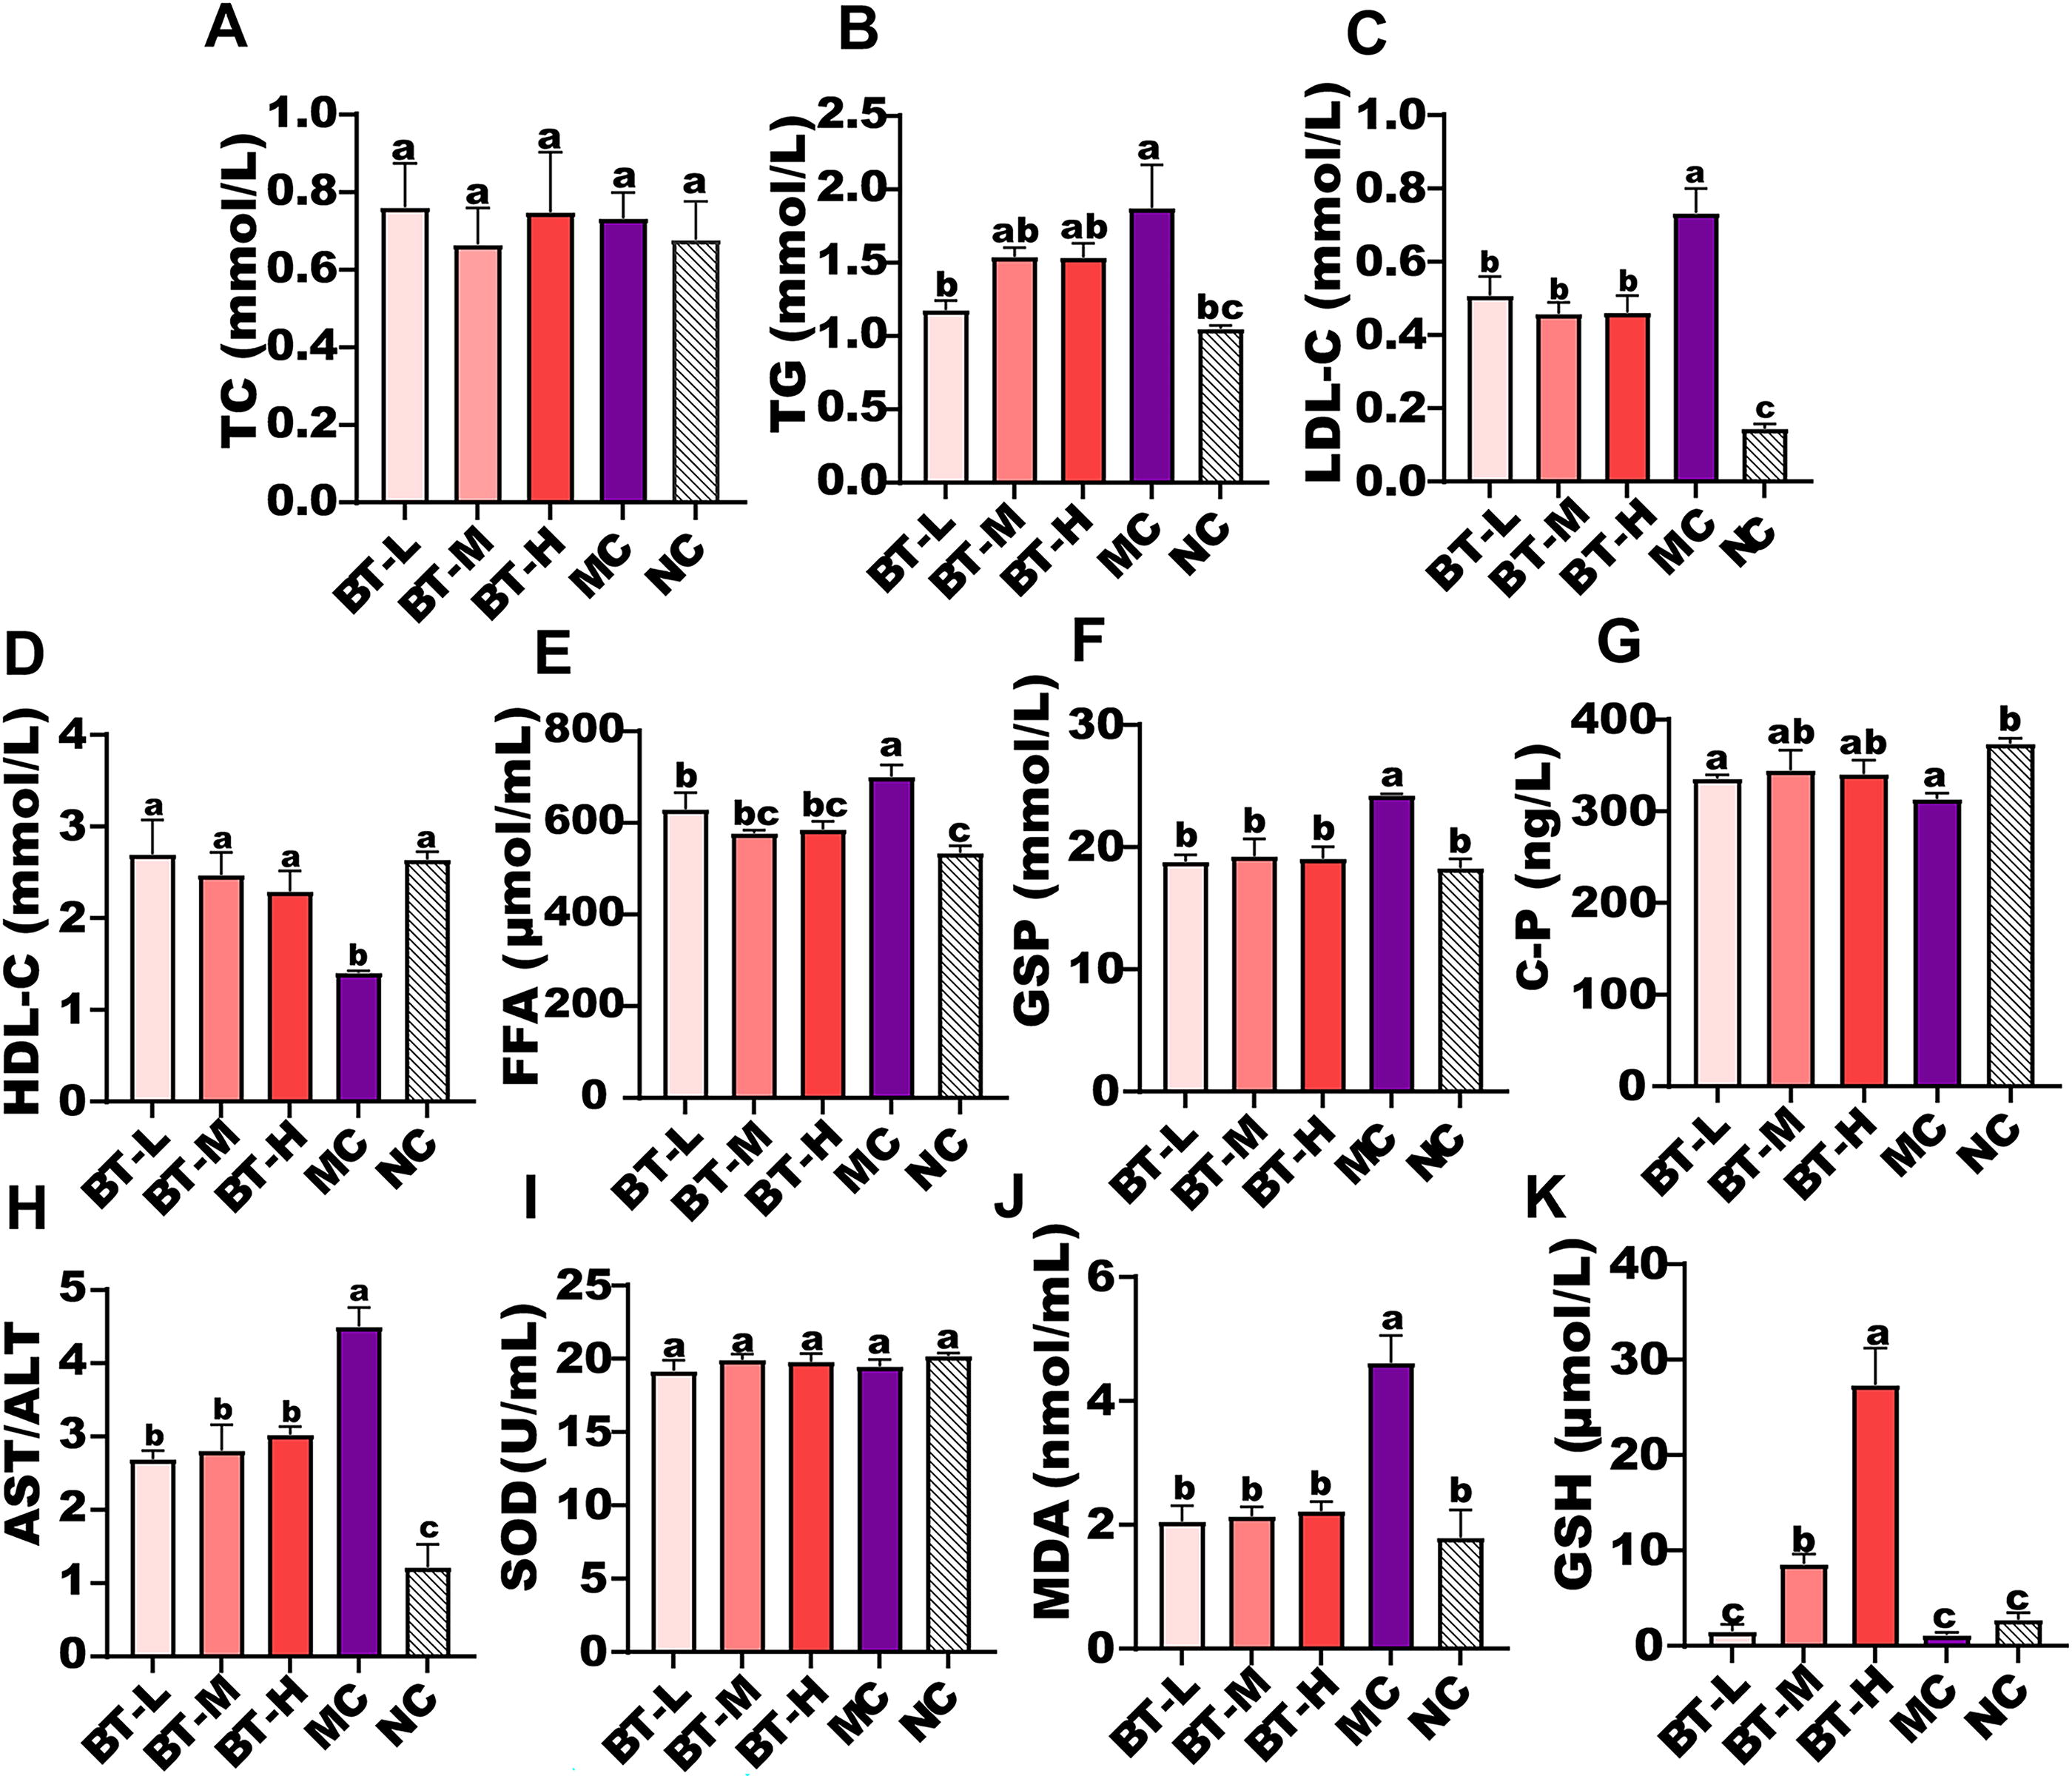
Effects of different concentrations of BT extracts on serum biochemical indices in hyperglycemic mice, including the level of TC
Effect of different concentrations of BT intervention on glucose metabolism in liver
Histological examination of liver tissues from each experimental group under high magnification (Fig. 3A) revealed intact hepatic architecture without significant abnormalities in the NC group. In contrast, the MC group exhibited extensive hepatocyte granular degeneration, moderate hepatocyte ballooning, and cytoplasmic vacuolation of varying sizes. The BT-L and BT-H groups demonstrated significant improvements in hepatic conditions compared with the MC group. In contrast, the BT-M group still exhibited some granular degeneration and pronounced cytoplasmic vacuolation. In addition to histological improvements, BT intervention at different concentrations enhanced the activity and expression levels of key kinases involved in glucose metabolism. Figure 3B and C illustrated significant alterations in hepatic GSK-3β and PEPCK enzyme activities across all experimental groups compared with the MC group, suggesting BT’s capacity to inhibit glucose production, albeit without apparent concentration dependence. Figure 3D and E demonstrated that BT extracts at various concentrations significantly upregulated the mRNA expression of IRS-1 and GLUT2 in hepatocytes, promoting hepatic glucose uptake and metabolism, thereby exerting a hypoglycemic effect. Among the concentrations, BT-L exhibited superior efficacy in promoting IRS-1 mRNA expression compared with BT-M and BT-H.

The effect of different concentrations of BT extract intervention on liver injury and key enzyme activity and gene expression of liver glucose metabolism, including Hematoxylin and eosin (H&E) staining of liver sections
Effects of different concentrations of BT intervention on pancreatic islet morphology and function
The regulatory effect of BT on hyperglycemia extends beyond the liver to the pancreas. Supplementary Figure S1A depicts the pancreatic islet status across groups. The NC group exhibited intact and abundant islets, whereas the MC group demonstrated severe islet damage with minimal observable fragmented islets. Comparatively, BT intervention at different concentrations effectively mitigated islet damage in T2DM mice, leading to a substantial increase in islet cell numbers and expansion of the islet area. Immunofluorescence results (Supplementary Fig. S1B, C) revealed the status of pancreatic β-cell populations. The NC group demonstrated abundant β-cells, whereas the MC group exhibited few observable β-cells due to pancreatic injury. After BT intervention, pancreatic β-cell numbers increased, with significant differences observed between the BT-L and BT-H groups (P < .01), although no significant concentration dependence was noted. GLP-1, an effective insulin scretion stimulant and key regulator of energy homeostasis, prevents hyperglycemia by enhancing insulin secretion and inhibiting glucagon secretion. 15 Therefore, pancreatic GLP-1 protein expression in T2DM mice was assessed under different BT concentration interventions. As shown in Figure 4A and B, all BT concentrations significantly upregulated pancreatic GLP-1 expression compared with the MC group (P < .001). Furthermore, key genes affecting pancreatic function were examined. Figure 4C–F illustrates that, compared with the MC group, the BT-L group significantly promoted the expression of GLP-1R, PKA, PDX-1, and GCK genes in the pancreas (P < .01), with BT-L demonstrating superior efficacy compared with BT-M and BT-H.

Effects of different concentrations of BT intervention on the expression of GLP-1 protein and pancreatic function-related genes, including IHC of GLP-1 protein
Effects of different concentrations of BT on the intestinal flora analysis of colony collection
The Venn diagram allowed visual analysis of the information on the genus types common and specific to each sample. As can be seen from Supplementary Figure S2A and B, in terms of the total number of Operational taxonomic units (OUTs), it was BT-L group > MC group > NC group > BT-M group > BT-H group, respectively. In terms of endemic genera, the BT-L group had the most with 744 species, followed by the MC, NC, and BT-H groups with 727, 677, and 603 species, respectively, while the BT-H group had the least (443 species).
Analysis of bacterial diversity
The α-diversity of intestinal flora of mice in each experimental group was assessed by Chao1 index. As shown in Supplementary Figure S2C, BT intervention at different concentrations significantly increased the intestinal flora diversity of T2DM mice, but there was no significant difference between them. Further Partial least squares discriminant analysis (PLS-DA) analysis of β-diversity was performed for each group (Supplementary Fig. S2D), and the results showed that the distribution of intestinal microflora in both the NC group and BT groups were significantly different from that of the MC group, indicating that BT had a significant improvement on the intestinal flora structure of T2DM mice, but the intervention effects were similar in three dose of BT groups.
Analysis of the change in abundance of intestine flora
As shown in Figure 5A, different doses of BT interventions all contributed to increases in the abundance of Bacteroides in the intestine of T2DM mice, where BT-H significantly promoted the regulation of Bacteroides, while significantly reducing the abundance of Firmicutes. BT-L and BT-M interventions also contributed to increase in the abundance of Bacteroides, but the regulation of Firmicutes levels was not significantly different compared with the MC group (P > .05). Furthermore, the top 20 genera ranked by total distribution of Bacteroides in each experimental group were ranked and analyzed. As shown in Figure 5B, the intestines of mice in all experimental groups were very rich in Akkermansia, a normal flora in the intestine. After the intervention of BT, the abundance of Turicibacter and Bacteroides in the intestinal flora increased significantly. The results of the heat map (Fig. 5C) showed that Akkermansia, Allobaculum, Parabacteroudes, and Ruminococcus were present in high abundance in the intestine of mice in all experimental groups, with Turicibacter and Bacteroides showing significantly higher abundance in the intestines of mice in the three BT intervention groups. In contrast, the abundance of Anaeroplasma, Clostridium, and Dorea was lower in the MC group.

Column graph of intestinal flora at phylum level
Analysis of genus variability
The Linear discriminant analysis effect size (LEfSe) analysis was used to compare the differences between groups at the genus level of different bacteria in each group. As shown in the Linear discriminant analysis (LDA) bar chart in Supplementary Figure S3A, the NC group contained higher abundance of Acinetobacter and Coprococcus at the genus level, whereas the MC group contained a higher abundance of Clostridium, Sutterella, and Mucispirillum. The number and abundance of beneficial bacteria in the intestine of T2DM mice were significantly increased by BT, with higher abundance of Bacteroides in the BT-H group and higher abundance of Turicibacter and Anaerofustis in the BT-M group, while the highest abundance of Bifidobacterium was found in the BT-L group.
Interrelationships between genus changes and physiological phenotypes
Correlation heat map analysis was performed between genus-level strains and their phenotypes. As shown in Supplementary Figure S3B, the genera most correlated with FBG in mice were Lysobacter (positive correlation) and Ruminococcus (negative correlation), respectively. The levels of C-P and GSH in the serum of mice were significantly and positively correlated with the abundance of Streptococcus in the intestine. The serum levels of FFA, AST, ALT, LDL-C, and PEPCK and GSK in the liver were negatively correlated with the abundance of Streptococcus but positively correlated with the abundance of Mucispirillum and Clostridium. Moreover, the presence of both bacteria was significantly and negatively correlated with serum LDL-C and GSH levels and hepatic PDX-1, PKA, and pAKT expression.
Functional analysis of KEGG metabolism
As shown in Supplementary Figure S3C, Kyoto Encyclopedia of Genes and Genomes (KEGG) metabolic pathway enrichment analysis was performed based on the gut microbial gene sequences. The results showed that the metabolic pathways involved in the effects of all intervention groups on intestinal flora mainly included the synthesis and metabolism of amino acids, the biosynthesis and degradation of glycans, and the mismatch repair of genetic material. Among them, BT-L could better promote the synthesis of streptomycin. While BT-M had a significant role in promoting D-alanine metabolism, BT-H had a significant role in the catabolism of intestinal carbohydrates, especially in enhancing the degradation of polysaccharides by intestinal microorganisms.
DISCUSSION
T2DM is a complex metabolic disorder influenced by various factors, including high-calorie diets, population aging, and unhealthy lifestyles characterized by obesity and lack of exercise. 16,17 T2DM is characterized by insufficient insulin secretion by pancreatic β cells, inadequate tissue insulin response, and an inability to maintain glucose homeostasis, leading to hyperglycemia. 18 Dietary intake plays a crucial role in the management of diabetes, and excessive consumption of sugar and fat is believed to not only increase the risk of T2DM but also disrupt the gut microbiota. 8 Numerous studies have highlighted the involvement of gut flora in energy metabolism and its close association with the occurrence and progression of T2DM. 19 In recent years, research has shown that tea, with its ability to inhibit carbohydrate absorption, stimulate glucose metabolism, and alleviate oxidative stress, can effectively reduce BG levels and improve IR. 13 In addition, tea has been found to have a positive regulatory effect on the gut microbiome in both animal and human studies. 10,11 However, there is limited research on the specific mechanisms underlying the hypoglycemic effects of BT. Therefore, this study aimed to further investigate the role and mechanisms of BT in the hypoglycemic process.
In this study, we observed that different concentrations of BT extract exhibited significant inhibitory effects on weight loss and BG elevation in T2DM mice (Fig. 1A–D). Furthermore, the BT extract effectively improved glucose tolerance and insulin tolerance in T2DM mice (Fig. 1E–H). Interestingly, we did not observe a clear concentration-dependent effect in our findings. Similar observations have been reported in previous studies. 20 In addition, yellow tea demonstrated improvements in glucose tolerance and IR without exhibiting dose-dependent effects. 21 However, it is worth noting that Zhu et al. reported a dose-dependent improvement in metabolic disorders and complications associated with hyperglycemia upon the administration of Liubao brick tea, particularly in terms of BG improvement. 11 These variations in findings may be attributed to differences in the type and composition of tea used in the studies. Further research is needed to elucidate the specific mechanisms underlying the observed effects of BT and the potential dose–response relationship.
In our study, BT significantly reduced the levels of serum LDL-C, FFA, GSP, and AST/ALT while significantly increasing the level of HDL-C (P < .001). Simultaneously, BT intervention significantly reduced the TG content in serum, and it is worth noting that BT-L has the most significant regulatory effect on serum TG levels. Overall, the results indicate that BT possesses the abilities to regulate glucose and lipid metabolism and protect the liver (Fig. 2). These findings were consistent with the results reported by Shang et al. where both selenium-enriched BT (Se-BT) and BT treatments significantly reduced TG levels and increased HDL-C levels. 22 In addition, rhubarb tea has been shown to significantly reduce liver lipids, including TG, TC, and LDL-C, thereby alleviating the development of fatty liver in Lepr−/− rats. 23 Regarding oxidative stress-related indicators, we observed that BT did not significantly improve the level of SOD, but it exerted a favorable regulatory effect on the levels of MDA and GSH. SOD is an antioxidant metalloenzyme that plays a crucial role in organisms by catalyzing the dismutation of the superoxide radical into oxygen and hydrogen peroxide. MDA, on the other hand, is an end product of lipid peroxidation that reflects the extent of tissue peroxidation damage and the potential antioxidant capacity of the body. 24 Hyperglycemia-induced depletion of reduced GSH leads to oxidative stress in erythrocytes, highlighting the significance of GSH in maintaining the body’s antioxidant defense system. 25 This suggested that BT ameliorates lipid peroxidation damage and nonenzymatic antioxidant substances, while not enzymatic antioxidants.
BT interventions demonstrated significant regulatory effects on hepatic glucose metabolism and exhibited notable hepatoprotective properties. Our investigation revealed that post-BT intervention, the activities of two key kinases involved in hepatic glucose synthesis, GSK-3β and PEPCK, were significantly attenuated. GSK-3β, a crucial enzyme in hepatic glucose metabolism, modulates hepatic glucose synthesis and is regulated by insulin, primarily participating in hepatic glycogen synthesis and metabolism. 26 PEPCK, another key enzyme in the gluconeogenesis pathway, promotes glucose production and elevates BG levels. Thus, the inhibition of these enzymes’ activities contributes to BG reduction. Moreover, BT interventions significantly upregulated the mRNA expression of GLUT2 and IRS-1 (Fig. 3), promoting glucose uptake and insulin utilization, respectively. 27 Specifically, insulin regulates BG by binding to hepatic insulin receptors, phosphorylating its substrate protein IRS-1, and activating signaling cascades such as the PI3K-AKT pathway, CAP/Cb1/Tc10 pathway, and Ras Mitogen-activated protein kinase (MAPK) pathway. This triggers a cascade of protein kinases and phosphatases, ultimately stimulating GLUT2 translocation to cellular membranes, facilitating glucose uptake by tissues, inhibiting glucose synthesis, and thus modulating circulating glucose levels. 14
In addition to ameliorating hepatic glucose metabolism disorders, BT extract demonstrated the capacity to promote pancreatic injury recovery and enhance insulin secretion. Our findings indicate that BT intervention significantly increased pancreatic islet area. Notably, GLP-1 expression levels appeared to positively correlate with the degree of pancreatic islet recovery. GLP-1 exerts its hypoglycemic effects in the pancreas primarily by augmenting insulin synthesis and release, promoting angiogenesis and proliferation, and reducing apoptosis of β-cells. 28,29 According to the literature, GLP-1 stimulates Gαs by binding to its specific receptor GLP-1R, activating the adenylate cyclase (AC)–cyclic adenosine monophosphate–PKA–dependent intracellular signaling pathway. This activation promotes the transcription of various downstream target genes, ultimately triggering insulin release, affecting pancreatic physiology, and participating in BG regulation. 15,30 Our analysis of mRNA levels of downstream target genes related to this signaling pathway revealed beneficial modulation of these molecules. After treatment with varying concentrations of BT, significant increases were observed in the pancreatic mRNA levels of GLP-1R, PKA, PDX-1, and GCK in T2DM mice. PDX-1, a transcription factor exclusively expressed in the pancreas, is considered the “master regulator” of pancreatic development and is crucial for the development and function of pancreatic islet cells. 31 Studies have demonstrated that increased DNA methylation levels of PDX-1 lead to reduced islet activity in T2DM, contributing to pancreatic β-cell dysfunction. 32 GCK, also known as hexokinase, plays a pivotal role in intracellular glucose uptake and utilization. Impaired GCK function can result in the loss of key glucose-regulating abilities in target organs, leading to glucose metabolism disorders such as abnormal insulin leading to glucose metabolism disorders such as abnormal insulin and glucagon secretion, reduced glucose utilization, and impaired hepatic glycogen synthesis. 33 Activated PKA phosphorylates PDX-1 and enhances its transcriptional activity. PDX-1 activation binds to the promoter region of the GCK and promotes the transcription and expression of GCK. 32 Therefore, we hypothesized that BT could exert its hypoglycemic effect through the GLP-1R-PKA-PDX-1-GCK cascade.
Intestinal flora is closely related to human physiological activities and the occurrence and development of T2DM. The reduction of beneficial flora or the enhancement of harmful and opportunistic pathogenic flora can induce low-grade chronic inflammation in the intestine, thus triggering IR. 19,34 Studies have found that BT could improve the imbalance of intestinal flora caused by hyperglycemia, increase the richness and diversity of intestinal flora, and change the abundance of beneficial and harmful bacteria. 22 This was similar to our results that BT increased the diversity of intestinal flora. Different dosages of BT intervention could help to increase the abundance of Bacteroides in the intestine of T2DM mice, but BT-M could significantly reduce the level of Firmicutes at the same time. However, there was no significant difference in the regulatory effect of BT-L and BT-M intervention on the level of Firmicutes compared with MC group. As shown in Supplementary Figure S2B, the intestines of mice in all experimental groups were abundantly rich in Akkermansia, which is a normal flora in the intestine. Much evidence has shown that Akkermansia was negatively correlated with obesity, DM, cardiovascular disease, and low-grade inflammation. 35 After BT tea intervention, the abundance of Turicibacter and Bacteroides in intestinal flora increased significantly. Turicibacter is involved in fermentation metabolism in the gut, and lactic acid is its main metabolite, which has the effects of regulating muscle and antifatigue. Bacteroides is a dominant beneficial bacterium in the human gut and its proportion with Firmicutes differs in different populations. Relevant studies have found that the relative proportion of Bacteroides in the gut of obese people had decreased, and healthy diet and living habits would promote its growth. 36 According to the results of the heatmap of microbiota distribution (Supplementary Fig. S2C), there were high abundances of Akkermansia, Allobaculum, Parabacteroides, and Ruminococcus in the intestines of mice in each experimental group. In the intestines of mice in the three groups of BT intervention, the abundances of Turicibacter and Bacteroides increased significantly, and the abundances of Bifidobacterium and Anaerostipes were also relatively high. Allobaculum and Ruminococcus belong to the dominant genera in the gut, which can produce Short-chain fatty acids (SCFAs) by digesting nutrients, thus contributing to the maintenance of intestinal homeostasis. For example, acetic acid can regulate BW and insulin sensitivity, while propionate and butyrate are involved in many signal transduction processes. 37 Parabacteroides distasonis can activate different signal pathways by producing succinic acid and secondary cholic acid, and then play a multitarget role in improving metabolic syndrome. It is a potential and new type of probiotics against metabolic syndrome. 38 Bifidobacterium is an important physiological flora in human and animal intestines, which plays an important role in regulating and maintaining human microecological balance in vivo. Dipeptidase, tripeptidase, and carboxypeptidase in Bifidobacterium can help reduce blood pressure and blood lipids. 39 It had been reported that some strains of Anaerostipes could metabolize dietary inositol into SCFAs such as propionate and butyrate, thus contributing to the regulation of intestinal homeostasis and metabolic pathways. 37 At the genus level, the number and abundance of beneficial bacteria in the gut of DM mice were significantly increased after BT intervention, and a greater abundance of Bacteroides was found in BT-H group. The BT-M group contained more Turicibacter and Anaerofustis. Anaerofustis can prevent and treat inflammation-related diseases. 36 The abundance of Bifidobacterium in the BT-L group was the highest and the presence of Bifidobacterium also showed a variety of benefits to the health of the organism’s internal environment. 39
The results showed that Lysobacter (positive correlation) and Ruminococcus (negative correlation) were the most related bacteria to FBG (Fig. 5B). Recent studies had found that small molecule toxins secreted by Lysobacter could be used to fight filamentous fungi, etc., so it was expected to become a potential source of new antibiotics. 40 Ruminococcus is one of the most effective bacterial genera for breaking down carbohydrates. However, some Ruminococcus spp. have also been shown to be pro-inflammatory. 41 The contents of C-P and GSH in the serum of mice were significantly positively correlated with the abundance of Streptococcus in the intestine. Streptococcus was another large group of common gram-positive bacteria in Pyococcus. It was widely distributed in nature and the nasopharynx and gastrointestinal tract and other parts of human body, and most of them are normal flora. Group A Streptococcus and Streptococcus pneumoniae are mainly pathogenic among Streptococcus spp., which can cause various suppurative inflammatory and hypersensitivity diseases in humans. 42 The contents of FFA, AST, ALT, LDL-C in serum, and PEPCK and GSK in liver were negatively correlated with the abundance of Streptococcus but positively correlated with the abundance of Mucispirillum and Clostridium. Mucispirillum belongs to the Myxobacterium genus. Related studies have shown that Mucispirillum can be a marker for the health of the superficial mucosal layer of the distal colon and has a potential connection with the occurrence of inflammatory colitis. 43 Clostridium is a genus with high clinical relevance. The presence of Clostridium may cause rapid and even fatal infection. 44 At the same time, the presence of these two bacteria was also significantly negatively correlated with the content of LDL-C and GSH in serum and the expression of PDX-1 and PKA in the liver. According to the functional analysis of metabolic pathways of gut microbiota (Fig. 5C), BT might mainly affect the composition and function of gut microbes through the biosynthesis and metabolism of amino acids and glycans, as well as the mismatch repair of genes, thereby regulating intestinal homeostasis. Among them, BT-H had a significant effect on the catabolism of intestinal carbohydrates, especially in enhancing the degradation of polysaccharides by intestinal microorganisms and improving glucose metabolism. In addition, it has been found that anthocyanins can prevent the development of diabetes by regulating the metabolism of amino acids. 45
In summary, BT improves the composition of the intestinal flora by promoting the growth of beneficial bacteria and inhibiting the colonization of harmful bacteria. In addition, short-chain fatty acids, as the main metabolites produced by gut microorganisms, may play a role in the hypoglycemic process of tea, and more studies are needed to investigate their influence on the health effects of tea.
CONCLUSIONS
In the present study, the findings demonstrated that BT intervention significantly improved glucose tolerance and insulin tolerance in T2DM mice with no concentration-dependent effects. Importantly, BT promotes the recovery of pancreatic injury and stimulates insulin secretion by increasing the expression of GLP-1 and downstream target genes in the pancreas. In addition, BT repaired liver damage and regulated hepatic glucose metabolism. Notably, BT significantly improved the gut microbial structure of T2DM mice. BT-L intervention significantly increased the diversity of intestinal flora, which significantly affected intestinal anti-inflammatory and amino acid metabolic pathways and exerted the hypoglycemic effect. These findings highlight BT’s potential as a BG regulator for diabetes management.
Footnotes
ACKNOWLEDGMENT
The authors are thankful for the tea production by Xueyun Wang from Enshi Selenium Impression Agricultural Development Co., Ltd. (Enshi, China).
ETHICS APPROVAL
All experiments were conducted in strict accordance with the Experimental Animal Ethics Standards of the Experimental Animal Ethics and Use Committee of Shanghai Jiao Tong University (approval No. A2020002, approval date 2020.8.5).
AUTHORS’ CONTRIBUTIONS
L.F.L. and Z.H.: Conceptualization; data curation; formal analysis; methodology; writing—original draft; and writing—review and editing. Z.J.X.: Conceptualization and writing—review and editing; W.Y.F. and W.X.L.: Funding acquisition and supervision. All authors agree to be accountable for all aspects of work ensuring integrity and accuracy.
AUTHOR DISCLOSURE STATEMENT
The authors declare no conflict of interest.
FUNDING INFORMATION
The authors are grateful for financial sponsored by
SUPPLEMENTARY MATERIAL
Supplementary Table S1
Supplementary Figure S1
Supplementary Figure S2
Supplementary Figure S3
References
Supplementary Material
Please find the following supplemental material available below.
For Open Access articles published under a Creative Commons License, all supplemental material carries the same license as the article it is associated with.
For non-Open Access articles published, all supplemental material carries a non-exclusive license, and permission requests for re-use of supplemental material or any part of supplemental material shall be sent directly to the copyright owner as specified in the copyright notice associated with the article.
