




Abstract
Epigallocatechin-3-gallate (EGCG) and glabridin (GLA) are two phytochemicals derived from homologous plants used for medicine and food that have demonstrated efficacy in inhibiting excessive production of melanin and promoting skin whitening properties. However, it is unknown whether EGCG and GLA can synergistically inhibit melanogenesis. The aim of this study was to explore the effects of the combination of EGCG and GLA on the expression and activity of microphthalmia-related transcription factor (MITF) and to reveal the mechanism of the synergistic treatment with EGCG and GLA on excessive melanin deposition. This study used B16F10 cells to screen for the synergistic effect on melanin deposition and determined the best ratio of EGCG and GLA. Dual-luciferase reported gene assays were used to explore whether GLA and EGCG could regulate the mRNA level of MITF. Molecular docking and molecular dynamics simulation were used to explain the synergistic interaction of EGCG and GLA with MITF, and then Masson–Fontana and hematoxylin–eosin were used to observe the skin changes of mice. The results showed that the combination of EGCG and GLA could synergistically regulate MITF and thus inhibit melanogenesis by modulating microRNA expression. EGCG and GLA were also able to synergistically interact with MITF to inhibit excessive melanogenesis.

INTRODUCTION
There is a global consensus that tea is a healthy beverage. Tea contains large amounts of tea polyphenols, of which epigallocatechin-3-gallate (EGCG) is one of the main active components. 1,2 Many studies have shown that EGCG can play a role in skin whitening by reducing melanin production and is a potential natural plant-derived cosmetic ingredient. 3,4 Glabridin (GLA) is an isoflavone compound derived from the leguminous plant Glycyrrhiza glabra L., which has anti-oxidative, anti-inflammatory, and anti-melanogenesis effects. It has attracted much attention in the field of skin health care and has been widely used in various types of cosmetics. 5 However, the synergistic inhibition of melanin production by EGCG and GLA has not been elucidated and needs to be further studied.
Melanin is synthesized by melanocytes in the skin’s epidermis. Melanogenesis is a complex synthetic process that is affected by melanin-related enzymes, proteins, and genes, such as microphthalmia-related transcription factor (MITF), tyrosinase (TYR), DHICA oxidase (TRP-1), and DOPA pigment isomerase (TRP-2). MITF regulates transcription by binding to the promoter regions of TYR, TRP-1, and TRP-2 to regulate melanogenesis. 6 However, certain studies have shown that the MITF expression levels were associated with the regulation of some microRNAs (miRNAs). 7 MicroRNAs are small, single-stranded RNA molecules of 21–25 nt length that do not code proteins. 8 They regulate gene transcription by binding to the untranslated region (UTR) of mRNAs, either by increasing the transcription of mRNAs or by decreasing the level of mRNAs. 9 Therefore, miRNAs promote or inhibit melanogenesis by modulating the expression of relevant target genes (MITF).
Melanin is the main cause of skin pigmentation. Normal melanin deposition can protect the body from light damage, whereas excessive production of melanin can lead to hyperpigmentation in the skin. 10 Ultraviolet radiation is one of the primary external factors that causes excessive pigmentation in skin. 11 Ultraviolet radiation can cause many pathological effects in the skin, including wrinkles, roughness, and epidermal thickening. 12 Ultraviolet radiation B (UVB) is the main band that affects the synthesis and transport of melanin in melanocytes. 13
Melanin is an important factor in the skin, while excessive deposition is detrimental to skin homeostasis. We were surprised to find that EGCG and GLA have obvious synergistic inhibition on melanin production in B16F10 cells, and a significant synergistic interaction of EGCG and GLA with MITF was observed by molecular dynamics (MD) simulation and molecular docking. Interestingly, EGCG and GLA synergistically regulated the miRNA levels, which further modulated the mRNA transcription of MITF by dual luciferase reporter gene assay. Therefore, the aim of this study was to reveal the synergistic inhibition mechanism on MITF and the consequent reduction in melanin deposition by EGCG and GLA.
MATERIALS AND METHODS
Materials
EGCG and GLA (purity >98%) were obtained from Shanghai Yuanye Biotechnology Co., Ltd. Arbutin (Ab) was used as a positive control and purchased from Thermo Fisher Co., Ltd. Polyvinyl alcohol 205 (PVA-205) and polyvinylpyrrolidone K29/32 (PVP-K29/32) were used to prepare the micro-needles and purchased from Shanghai Yuanye Biotechnology Co., Ltd.
Cell culture
B16F10 cells were purchased from the Institute of Biochemistry and Cell Biology, Chinese Academy of Sciences and inoculated in DMEM high-glucose medium (Gibco) containing a sterile 10% fetal bovine serum (Gibco) and 1% penicillin–streptomycin mixture (Gibco). The culture flask was placed in a CO2 incubator (37°C, 5% CO2, relative humidity of 98%). When the cell density reached 80–90% in the flask, the cells were digested with 0.25% trypsin (Gibco) and subcultured.
Cell viability
B16F10 melanoma cells were plated in 96-well plates at an initial density of 1 × 10⁴ cells/mL (100 μL/well) and maintained under standard culture conditions (37°C, 5% CO2) for 12 h. Post-adhesion, the control group received 100 μL of fresh complete medium, whereas treatment groups (EGCG, GLA, Ab) were administered equivalent volumes of medium containing respective pharmacological agents. In the EGCG group, B16F10 cells were treated with different doses of EGCG (0, 50, 100, 150, 200, 250, and 300 μg/mL) for 48 h. In the GLA group, B16F10 cells were treated with different doses of GLA (0, 25, 50, 75, 100, 125, and 150 μg/mL) for 48 h. In the Ab group, B16F10 cells were treated with different doses of Ab (0, 50, 100, 150, 200, 250, and 300 μg/mL) for 48 h. Post-treatment protocols involved careful removal of supernatants followed by three ice-cold PBS washes. Cellular viability was quantified by adding 10 μL of 10% CCK-8 solution (Gibco) per well, with a subsequent 4-h incubation. Optical density measurements at 450 nm were conducted using a spectrophotometric microplate reader. Experimental validity was ensured through triplicate technical replicates per condition, with data representing mean values from three biologically independent trials.
Relative content of cell melanin
Melanin content in B16F10 melanoma cells was quantified using a sodium hydroxide (NaOH) solubilization assay. Cells were plated in 96-well plates at a density of 1 × 10⁴ cells/mL (100 μL/well) and incubated under standard conditions (37°C, 5% CO2) for 12 h. Following adhesion, the control group received 100 μL of fresh complete medium, while treatment groups (EGCG, GLA, and Ab) were supplemented with equivalent volumes of medium containing respective pharmacological agents. In the EGCG group, B16F10 cells were treated with different doses of EGCG (0, 25, 50, 75, 100, 125, and 150 μg/mL) for 48 h. In the GLA group, B16F10 cells were treated with different doses of GLA (0, 20, 40, 60, 80, and 100 μg/mL) for 48 h. In the Ab group, B16F10 cells were treated with different doses of Ab (0, 25, 50, 75, 100, 125, and 150 μg/mL) for 48 h. Post-treatment, cells underwent three PBS washes, followed by trypsinization (0.25% trypsin) and centrifugation (1000 rpm, 5 min). Pelleted cells were lysed with 200 μL NaOH (1 mol/L) containing 10% dimethyl sulfoxide and then incubated at 80°C for 1 h. Absorbance was measured spectrophotometrically at 405 nm to calculate melanin content. The half-maximal inhibitory concentration (IC50) for melanogenesis was derived for each treatment. Based on IC50 values of EGCG and GLA, combination regimens were designed and analyzed using CompuSyn software 14 –17 to compute combination indices (CI). Synergistic effects were defined as CI < 1, indicating enhanced suppression of melanin synthesis.
Quantitative real-time PCR
Total RNA isolation and subsequent complementary DNA synthesis were systematically performed with commercial reagent systems (TRIzol® Plus RNA Purification Kit and SuperScript™ III First-Strand Synthesis SuperMix, Thermo Fisher Scientific). Quantitative amplification primers were computationally designed through the integrated application of Primer Premier 6.0 and Beacon Designer 7.8 platforms, with oligonucleotide specifications comprehensively outlined in Table 1. Fluorometric quantification of nucleic acids was achieved using PowerUp™ SYBR™ Green Master Mix (Applied Biosystems) according to established protocols, with all reactions conducted in triplicate. Transcript abundance normalization was implemented through parallel amplification of the constitutively expressed GAPDH gene, where relative expression ratios were computationally derived using the comparative Ct (2−ΔΔCt) algorithm for quantitative interpretation.
Real-Time PCR Primers
MITF, microphthalmia-related transcription factor; Trp-1, DHICA oxidase; Trp-2, DOPA pigment isomerase; TYR, tyrosinase.
Western blot
Cellular protein lysates were prepared using a commercial extraction system (Total Protein Extraction Kit, Thermo Fisher Scientific), with protein concentration determined by bicinchoninic acid (BCA) assay (Beyotime Institute of Biotechnology). Following sequential processing steps including SDS-PAGE (12% resolving gel), electrophoretic transfer onto PVDF membranes (0.45 μm pore size), and blocking with 5% non-fat milk/TBST (1 h at 25°C), membranes underwent immunodetection using primary antibodies (Table 2) followed by species-matched HRP-conjugated secondary antibodies(Table 3). Chemiluminescent detection was conducted by incubating membranes with SuperSignal™ West Dura substrate (Thermo Fisher Scientific) for 60 s, followed by X-ray film exposure in a darkroom. Band intensity quantification was performed using ImageJ software (National Institutes of Health) with β-actin serving as a loading control. Statistical analysis of triplicate experiments was executed using Student’s t-test, with data presented as mean ± standard deviation (n = 3 biological replicates).
Primary Antibodies
Secondary Antibodies
Molecular docking and molecular dynamics
The three-dimensional structure of the MITF protein was retrieved from the RCSB Protein Data Bank (https://www.rcsb.org), while the SDF-formatted ligand structures of EGCG and GLA were acquired from the PubChem Compound Database (https://pubchem.ncbi.nlm.nih.gov). Structural format conversion (SDF → PDB) for ligands was performed using OpenBabel 3.1.1. The protein target underwent preprocessing in AutoDock Tools 1.5.6, involving the removal of nonpolar hydrogens and the addition of polar hydrogens. Both ligands and the target protein were subsequently converted into PDBQT format through charge calculation and atom type assignment. Molecular docking simulations were executed using AutoDock Vina 1.2.3.
The investigation of receptor-ligand binding mechanisms employed MD computational approaches, utilizing GROMACS 2019.6 for trajectory calculations. 18 Protein and ligand molecular topologies were constructed using the Amber99sb-ildn and GAFF force fields, respectively. A cubic solvation environment was established with 1.0 nm buffer regions surrounding the biomolecule. The explicit solvent system incorporated SPC216 water molecules, with ionic compensation (Na+/Cl−) ensuring electrostatic equilibrium.
Structural optimization proceeded through steepest descent energy minimization to resolve atomic steric conflicts. Sequential thermal (NVT, 300 K) and pressure (NPT, 1 bar) equilibration phases were conducted over 100 ps intervals. Following system stabilization, extended MD sampling was performed for 100 ns under periodic boundary constraints, employing V-rescale temperature coupling and Parrinello–Rahman pressure regulation. 19
MD simulations employed the leapfrog Verlet algorithm with a 2-femtosecond integration time step. Long-range electrostatic forces were accounted for through the Particle Mesh Ewald (PME) method, utilizing a 0.16-nm Fourier grid spacing parameter. Bond length constraints were maintained using the LINCS algorithm with fourth-order polynomial interpolation. Trajectory analysis leveraged specialized visualization tools: VMD 1.9.3 and PyMOL 2.4.1 for three-dimensional structural rendering and dynamic process animation. Thermodynamic binding parameters were quantified through the MMPBSA protocol implemented in the gmx_mmpbsa (http://jerkwin.github.io/gmxtool) computational framework.
miRNA levels in B16F10 cells
Using combinatorial algorithms from TargetScan (https://www.targetscan.org/vert) and miRanda (www.microrna.org), MITF was systematically predicted as a potential target of miRNAs in B16F10 melanoma cells. Subsequent refinement via TargetScanMouse identified conserved miRNA candidates specifically interacting with MITF. According to the “relative content of cell melanin” method, B16F10 cells were treated with EGCG (100 μg/mL), GLA (50 μg/mL), Ab (125 μg/mL), and EGCG combined with GLA (EGCG: GLA = 50 μg/mL: 25 μg/mL), respectively. RNA extraction was performed using TRIzol™ reagent (Thermo Fisher Scientific), followed by miRNA isolation via PureLink™ miRNA Isolation Kit. Reverse transcription utilized SuperScript™ III Reverse Transcriptase with stem-loop primers (sequences provided in Table 4). Quantitative real-time PCR amplification (QuantStudio 6 Flex System) evaluated expression levels of miR-182-5p, miR-96-5p, and miR-183-5p using SYBR™ Green chemistry, with primer sequences documented in Table 4.
Reverse Transcription Primer Sequences of miRNAs and Real-Time PCR Primers of miRNAs
miRNA, microRNA.
Dual luciferase reporter gene assay
In 96-well plates, 293T cells were seeded at a density of 1 × 10⁵ cells/mL. After 12 h, pmirGLO-MITF WT or MUT was co-transfected with miR-182-5p, miR-183-5p, and miR-96-5p mimic or NC into the above cells. After 48 h, the dual luciferase reporter gene detection system (Promega Co., Ltd.) was used to determine the luciferase activity of fireflies and Renilla according to the operation instructions. Finally, firefly luciferase activity was normalized according to Renilla luciferase activity.
Computational docking analyses revealed specific binding affinities between MITF and either EGCG or GLA. A MITF-responsive luciferase reporter system was engineered through molecular cloning of the pcDNA3.1-luc vector, with constitutive pRL-TK expression serving as internal normalization control; 293T cultures were established in 96-well formats (80% confluency) for parallel pharmacological interventions: EGCG (0, 50, 100, and 150 μg/mL), GLA (0, 25, 50, and 100 μg/mL), and EGCG combined with GLA (0:0, 25:25, 50:50, and 100:100). Lipofectamine™ 3000-mediated co-transfection (Thermo Fisher Scientific) delivered MITF-luc/pRL-TK complexes (10:1 mass ratio). Post-48 h incubation, sequential processing included each well was washed twice with PBS, 250 µL of 1×PLB lysate was added, and cells were then lysed at room temperature. The Firefly and Renilla luciferase activities were then determined with the Dual-Luciferase Reporter Assay System (Promega Co., Ltd.) according to the operating guidance. Then Firefly luciferase activity was normalized according to Renilla luciferase activity.
Preparation and characterization of DMN
Polydimethylsiloxane (PDMS) (Taizhou Microchip Pharmaceutical Technology Co., Ltd.) was used as the casting mold. The main body of the mold was cylindrical (diameter 8 mm, height 150 mm). The mold had a circular array of 80 needles (needle length 1000 μm, tip distance 750 μm, and bottom diameter 420 μm). The concentrations of 60% PV A-205 and 45% PV-k29/32, respectively, were poured into the PDMS molds, centrifuged for 5 min (5000 rpm/min), and dried at 37°C for 24–48 h before demolding. Fresh pig skin was used to test the machine properties of DMN, in vitro skin insertion rate, and to evaluate the transdermal release ability of DMN using the Franz diffusion cell method. 20 –22
Animals
This study was approved by the Animal Experimental Ethics Committee of China Jiliang University (2023-055), which conforms to the principles of animal protection, welfare, and ethics. Healthy 4-week-old C57BL/6 female mice were purchased from Shanghai SLAC Experimental Animal Co., Ltd (SCXK-<Hu>-2022-0004). All mice were placed in an experimental environment of 22 ± 2°C temperature, 50 ± 10% humidity, and 12 h of day and night circulation. During the experiment, all mice were free to drink water and feed.
The design of the animal experiment is shown in Figure 1. After a week of adaptive culture, 70 healthy C57BL/6 female mice were randomly divided into a control group, a model group, and a DMN treatment group. The DMN group was subdivided into the EGCG group (100 μg/mL), GLA group (50 μg/mL), Ab group (150 μg/mL), empty Micro-needle group, EGCG & GLA combination group (EGCG: GLA= 50:25), and 10 mice were used in each group. A 2 × 3 cm area of the back skin of these mice was shaved with a shaver and then smeared with depilatory cream for 10 min, and the remaining hair was scraped with a scraper. Except for the control group, the mice in the other groups were placed in a ventilated box with a 302 nm UVB lamp to receive 180 mJ/cm2 irradiation every day for 3 weeks. During the 3 weeks, the control group received normal natural light irradiation, and DMN groups were treated with 302 nm UVB light irradiation (per mouse once per day for 6 h). After 3 weeks, the control group continued to receive normal natural light irradiation, the model group and DMN treatment groups continued to receive UVB irradiation, and DMN treatment groups continued to be treated for a period of 3 weeks. After the end of the treatment, the experimental mice were euthanized by carbon dioxide asphyxia, and the skin tissue on the back of the mice was taken for histopathological observation and tissue biochemical index determination.
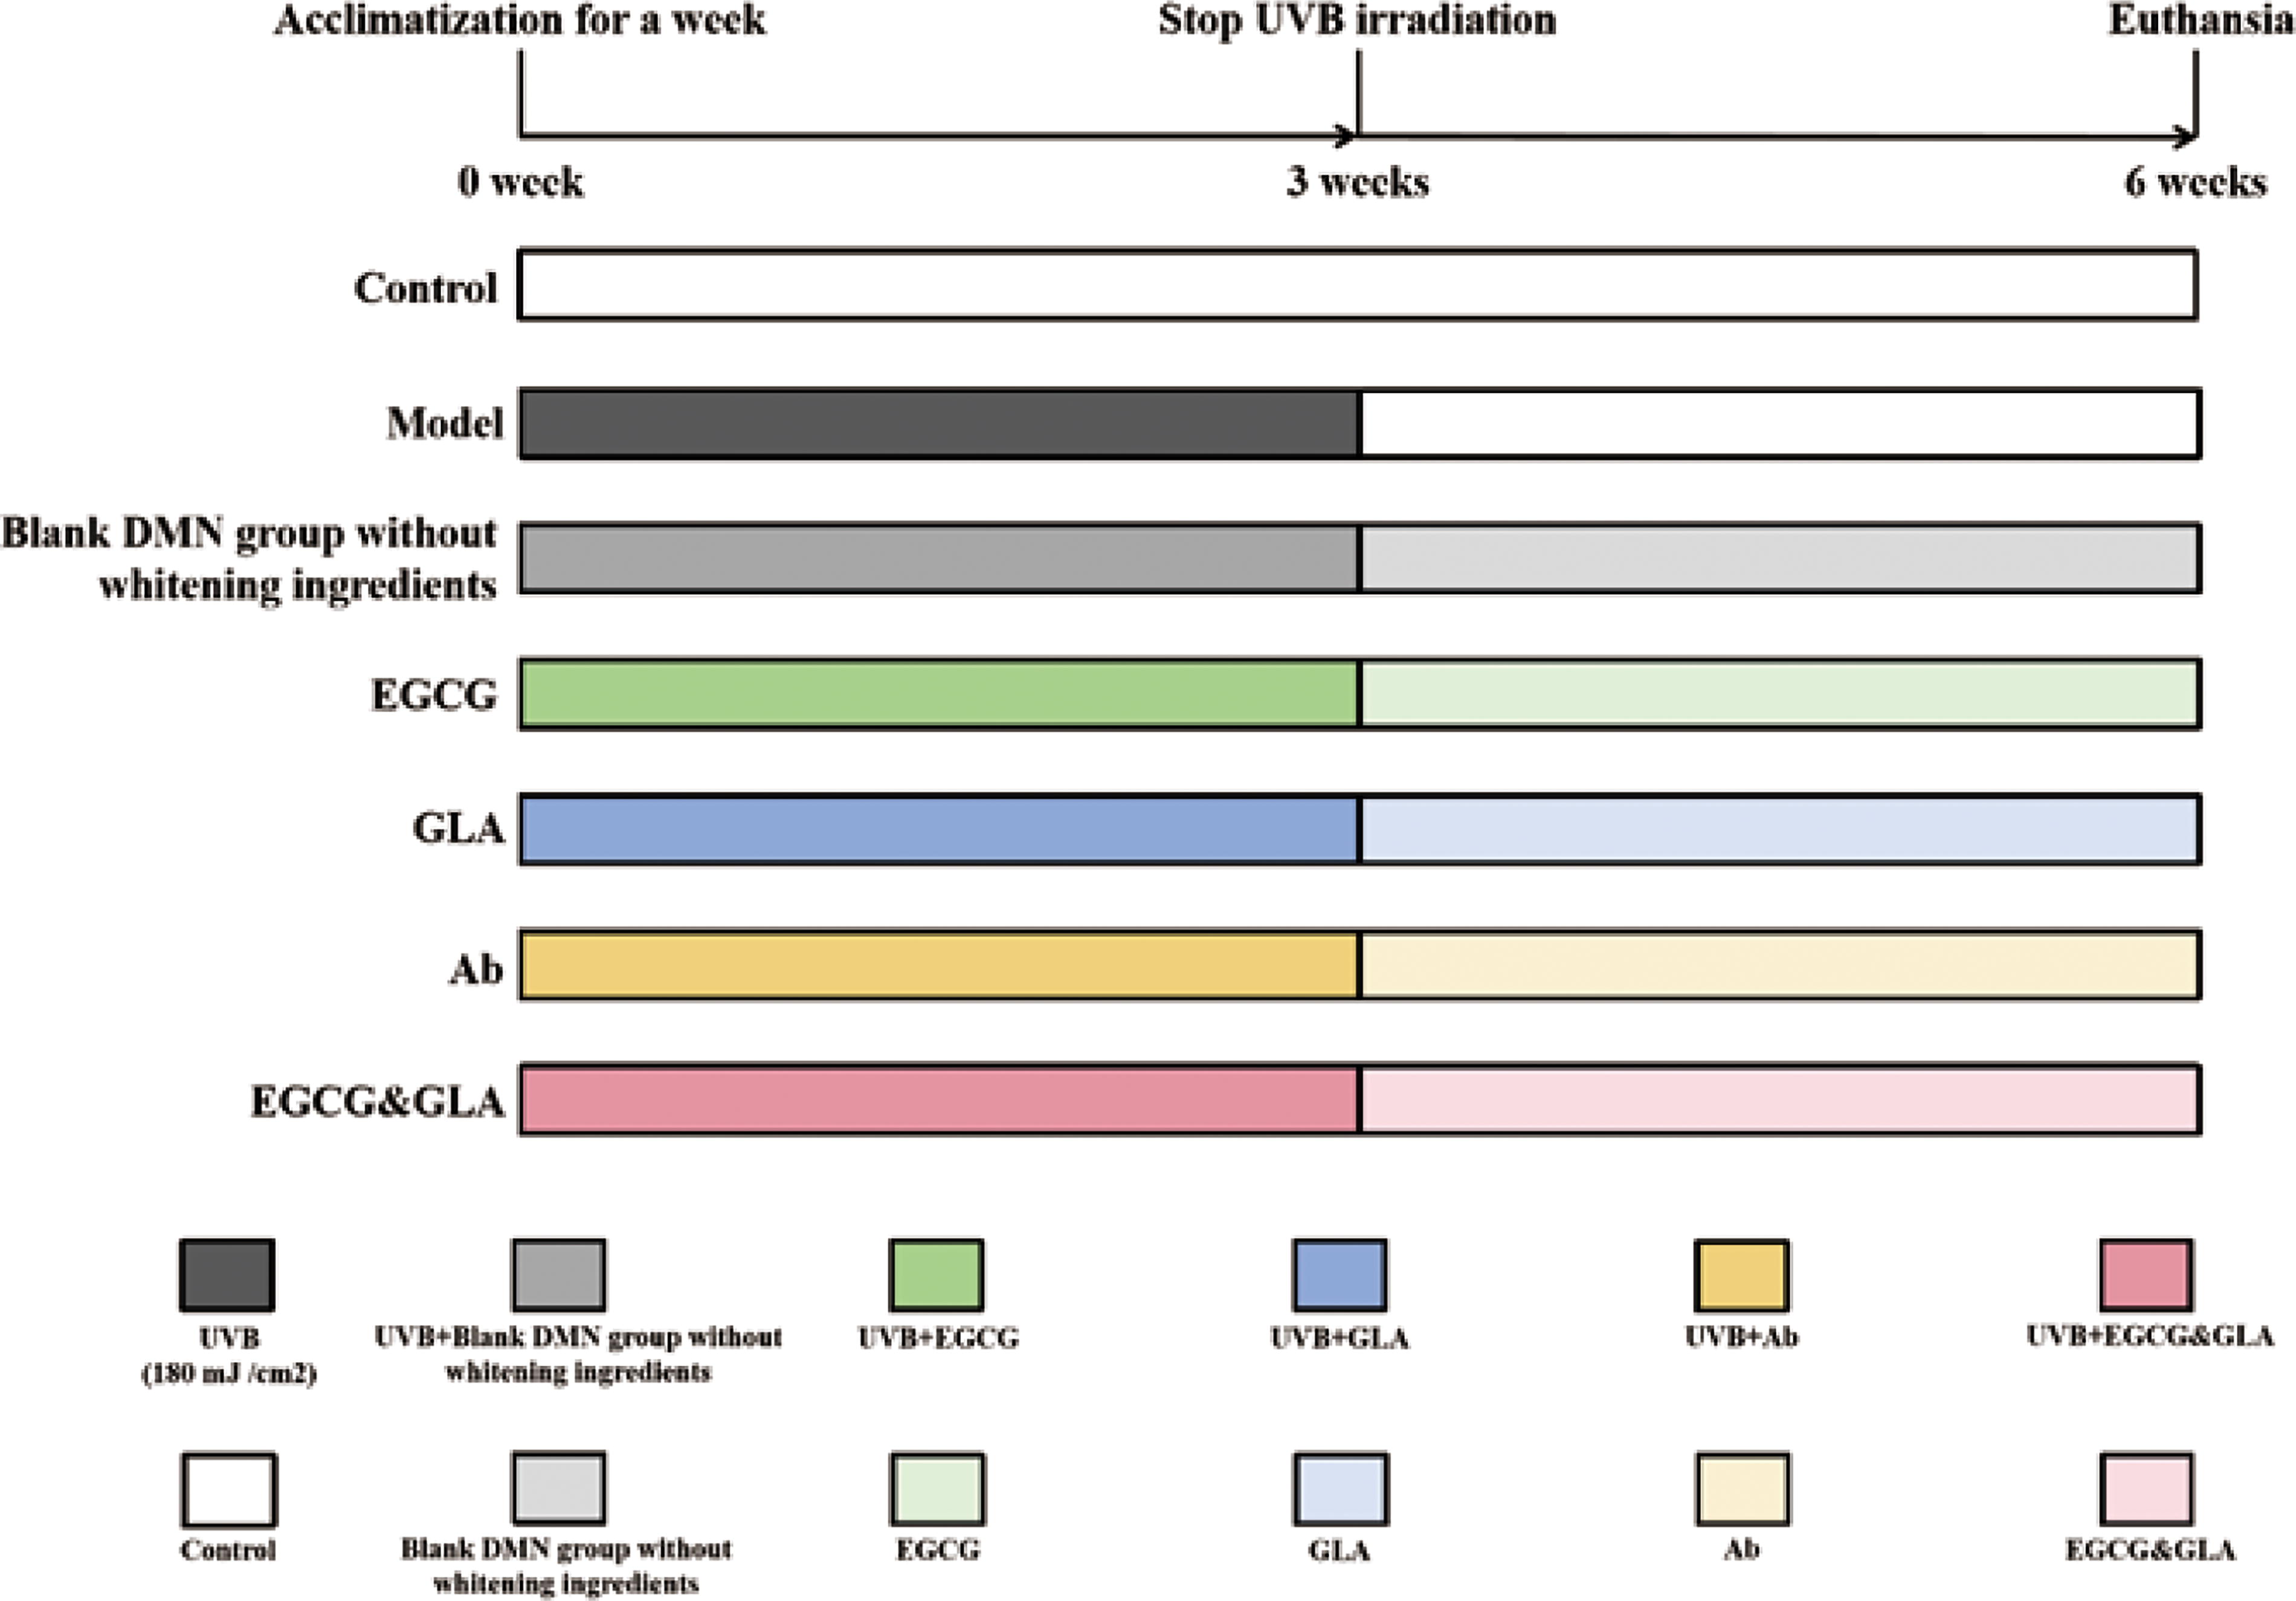
Animal experiment.
Histopathological observation of the skin
The skin tissues (0.5 cm × 0.5 cm) from the backs of the mice were fixed with 10% formalin for 24 h, dehydrated, and embedded in paraffin, and then sliced by a slicing machine. The slices were divided into two parts with a thickness of 3–4 μm for hematoxylin–eosin (HE) staining and Masson–Fontana staining, respectively. The sections used for HE staining were dewaxed with xylene, rehydrated with a graded series of ethanol, and stained with HE. The thickening of the skin epidermis was observed under a common optical microscope. The sections used for Masson–Fontana staining were subjected to xylene dewaxing and hydration, then immersed in ferrous sulfate for 60 min, washed with distilled water 5–6 times, and then immersed in acidic potassium ferricyanide solution for 30 min. After 4–5 times of distilled water, the sections were counterstained with nuclear fast red staining solution for 5 min, washed with distilled water for 1–2 times, dehydrated, transparent, and sealed with synthetic resin, and then observed by optical microscope. The distribution of black particles in the epidermal basal layer of skin tissue was used to characterize melanin deposition.
Quantitative real-time PCR and Western blot in mice skin
The specific method is shown in “Quantitative Real-Time PCR” and “Western Blot” sections.
Statistical analysis
In this study, one-way analysis of variance was performed using SPSS 24.0 (IBM), and the data were expressed as means ± standard deviations. The statistical significance between the groups was tested by using Tukey tests for post-hoc multiple comparisons, and P < .05 was statistically significant.
RESULTS
EGCG and GLA exhibited no cytotoxicity against B16F10 within the tested concentrations
In this study, the safe concentration of EGCG, GLA, and Ab for B16F10 cells was screened by CCK-8 assay. As shown in Figure 2a, the results showed that the concentrations of EGCG up to 150 μg/mL had no cytotoxic effect on B16F10. As shown in Figure 2b, the results showed that the content of GLA within 100 μg/mL had no effect on B16F10. As shown in Figure 2c, the results showed that the content of Ab up to 150 μg/mL had no cytotoxic effect on B16F10.

Cytotoxicity screening of EGCG, GLA, and Ab on B16F10 cells.
Combination of EGCG and GLA had an obvious synergistic inhibition on melanin production in B16F10
IC50 values were obtained from single compound treatment when the relative contents of melanin reached 50% in B16F10 cells, and then the combination regimen was formulated according to IC50 values. After the proportions of several combinations of EGCG and GLA were tested, CI values were calculated by CompuSyn software. When CI < 1, the combination had a synergistically inhabited melanin production.
As shown in Figure 3a, the results showed that the IC50 of EGCG was 100.04 (μg/mL). As shown in Figure 3b, the results showed that the IC50 of GLA was 50.34 (μg/mL). As shown in Figure 3c, the results showed that the IC50 of Ab was 125.27 (μg/mL). In this study, five combinations of EGCG and GLA were designed according to the IC50 values of a single compound, which were group a (EGCG: GLA = 25:25), group b (EGCG: GLA = 25:50), group c (EGCG: GLA = 50:25), group d (EGCG: GLA = 50:50), and group e (EGCG: GLA = 100:50). The relative content of melanin in each combination was calculated by CompuSyn software. As shown in Table 5, the combination of EGCG and GLA had a synergistic inhibition of melanin production in B16F10 cells. According to CompuSyn software calculation, it was concluded that the inhibition rate of melanin formation in B16F10 cells reached 50% (IC50) when EGCG and GLA were combined at a ratio of 41.74 μg/mL: 20.87 μg/mL, which showed that the CI value was 0.83 (<1). In summary, the ratio of EGCG: GLA = 50 μg/mL: 25 μg/mL was used as the combination group of EGCG and GLA in subsequent experiments.

The combination of EGCG and GLA has a synergistic inhibitory effect on melanin production in B16F10 cells.
Synergistic Inhibition on Melanogenesis by EGCG and GLA
Dm is used to indicate the dose that is 50% effective (IC50). The value of m is the slope of the median-effect plot. m = 1, m > 1 and m < 1 indicate hyperbolic, sigmoidal, and flat sigmoidal, respectively. The value of r is the linear correlation coefficient by the median-effect plot.
Ab, arbutin; CI, combination indices; EGCG, epigallocatechin-3-gallate; GLA, glabridin.
Regulation of the expression of melanin-related genes by EGCG and GLA
The study was divided into the following groups: Control group, EGCG group (100 μg/mL), GLA group (50 μg/mL), Ab group (125 μg/mL), and combination group (EGCG:GLA = 50 μg/mL: 25 μg/mL), as shown in Figure 4a–d. Compared with the control group, the four treatment groups (EGCG, GLA, Ab, EGCG and GLA) significantly decreased the transcription levels of MITF, TYR, Trp-1, and Trp-2. The largest decrease was seen in the synergistic treatment group. The protein intensities of MITF, TYR, Trp-1, and Trp-2 were detected by Western blotting in B16F10 cells. In Figure 4e and Figure 4f, the results showed that the combination of EGCG and GLA significantly inhibited MITF expression and suppressed melanin production.

Expressions of melanin-related genes and proteins.
Targeting the relationship between miRNA and MITF
As shown in Figure 5a, the interaction sites between miR-182-5p, miR-96-5p, miR-183-5p, and MITF mRNA were hypothesized based on the bioinformatics analysis of TargetScan and miRanda. As shown in Figure 5b, the expression levels of miR-182-5p in each group had better matching degrees with the mRNA of MITI than the levels of miR-183-5p. This study further confirmed the interaction between miR-182-5p and MITF by dual luciferase reporter gene assay. As shown in Figure 5c, the relative fluorescence value of the miR-182-5p + MITF-WT co-transfection group was lower than that of the miR-NC + MITF-WT group (P > .05). The results verified that there was an interaction site between miR-182-5p and MITF mRNA. As shown in Figure 5d, the inhibitory effect of EGCG combined with GLA on MITF was significantly stronger than that of the two components alone.

The targeting relationship between miR-182-5p and MITF.
Synergistic interaction of EGCG and GLA on MITF as observed by molecular docking and molecular dynamics simulations
To elucidate molecular interactions in protein-ligand complexes, we quantified binding free energies at equilibrium states using the gmx_mmpsa computational package (https://jerkwin.github.io/gmxtool/). The MMPBSA methodology divides thermodynamic binding parameters into four distinct contributions: electrostatic forces, van der Waals interactions, polar solvation energies, and non-polar solvation effects—the latter calculated based on solvent-accessible surface area approximations.
Our computational analysis revealed significant binding affinities for three molecular configurations: MITF-EGCG (−90.997 kJ/mol), MITF-GAL (−82.903 kJ/mol), and MITF-EGCG-GAL (−95.014 kJ/mol). Notably, the ternary EGCG-GAL complex demonstrated enhanced binding stability compared with individual ligand interactions, suggesting synergistic effects from EGCG incorporation. Energy decomposition analysis identified electrostatic and van der Waals forces as primary contributors to molecular recognition, consistent with typical protein–ligand interaction profiles.
These computational findings (presented in Fig. 6 and Table 6) provide quantitative evidence for EGCG’s role as a potential binding enhancer in MITF-GAL molecular complexes. The observed energy differentials of approximately 8–12 kJ/mol between configurations warrant further investigation into cooperative binding mechanisms.
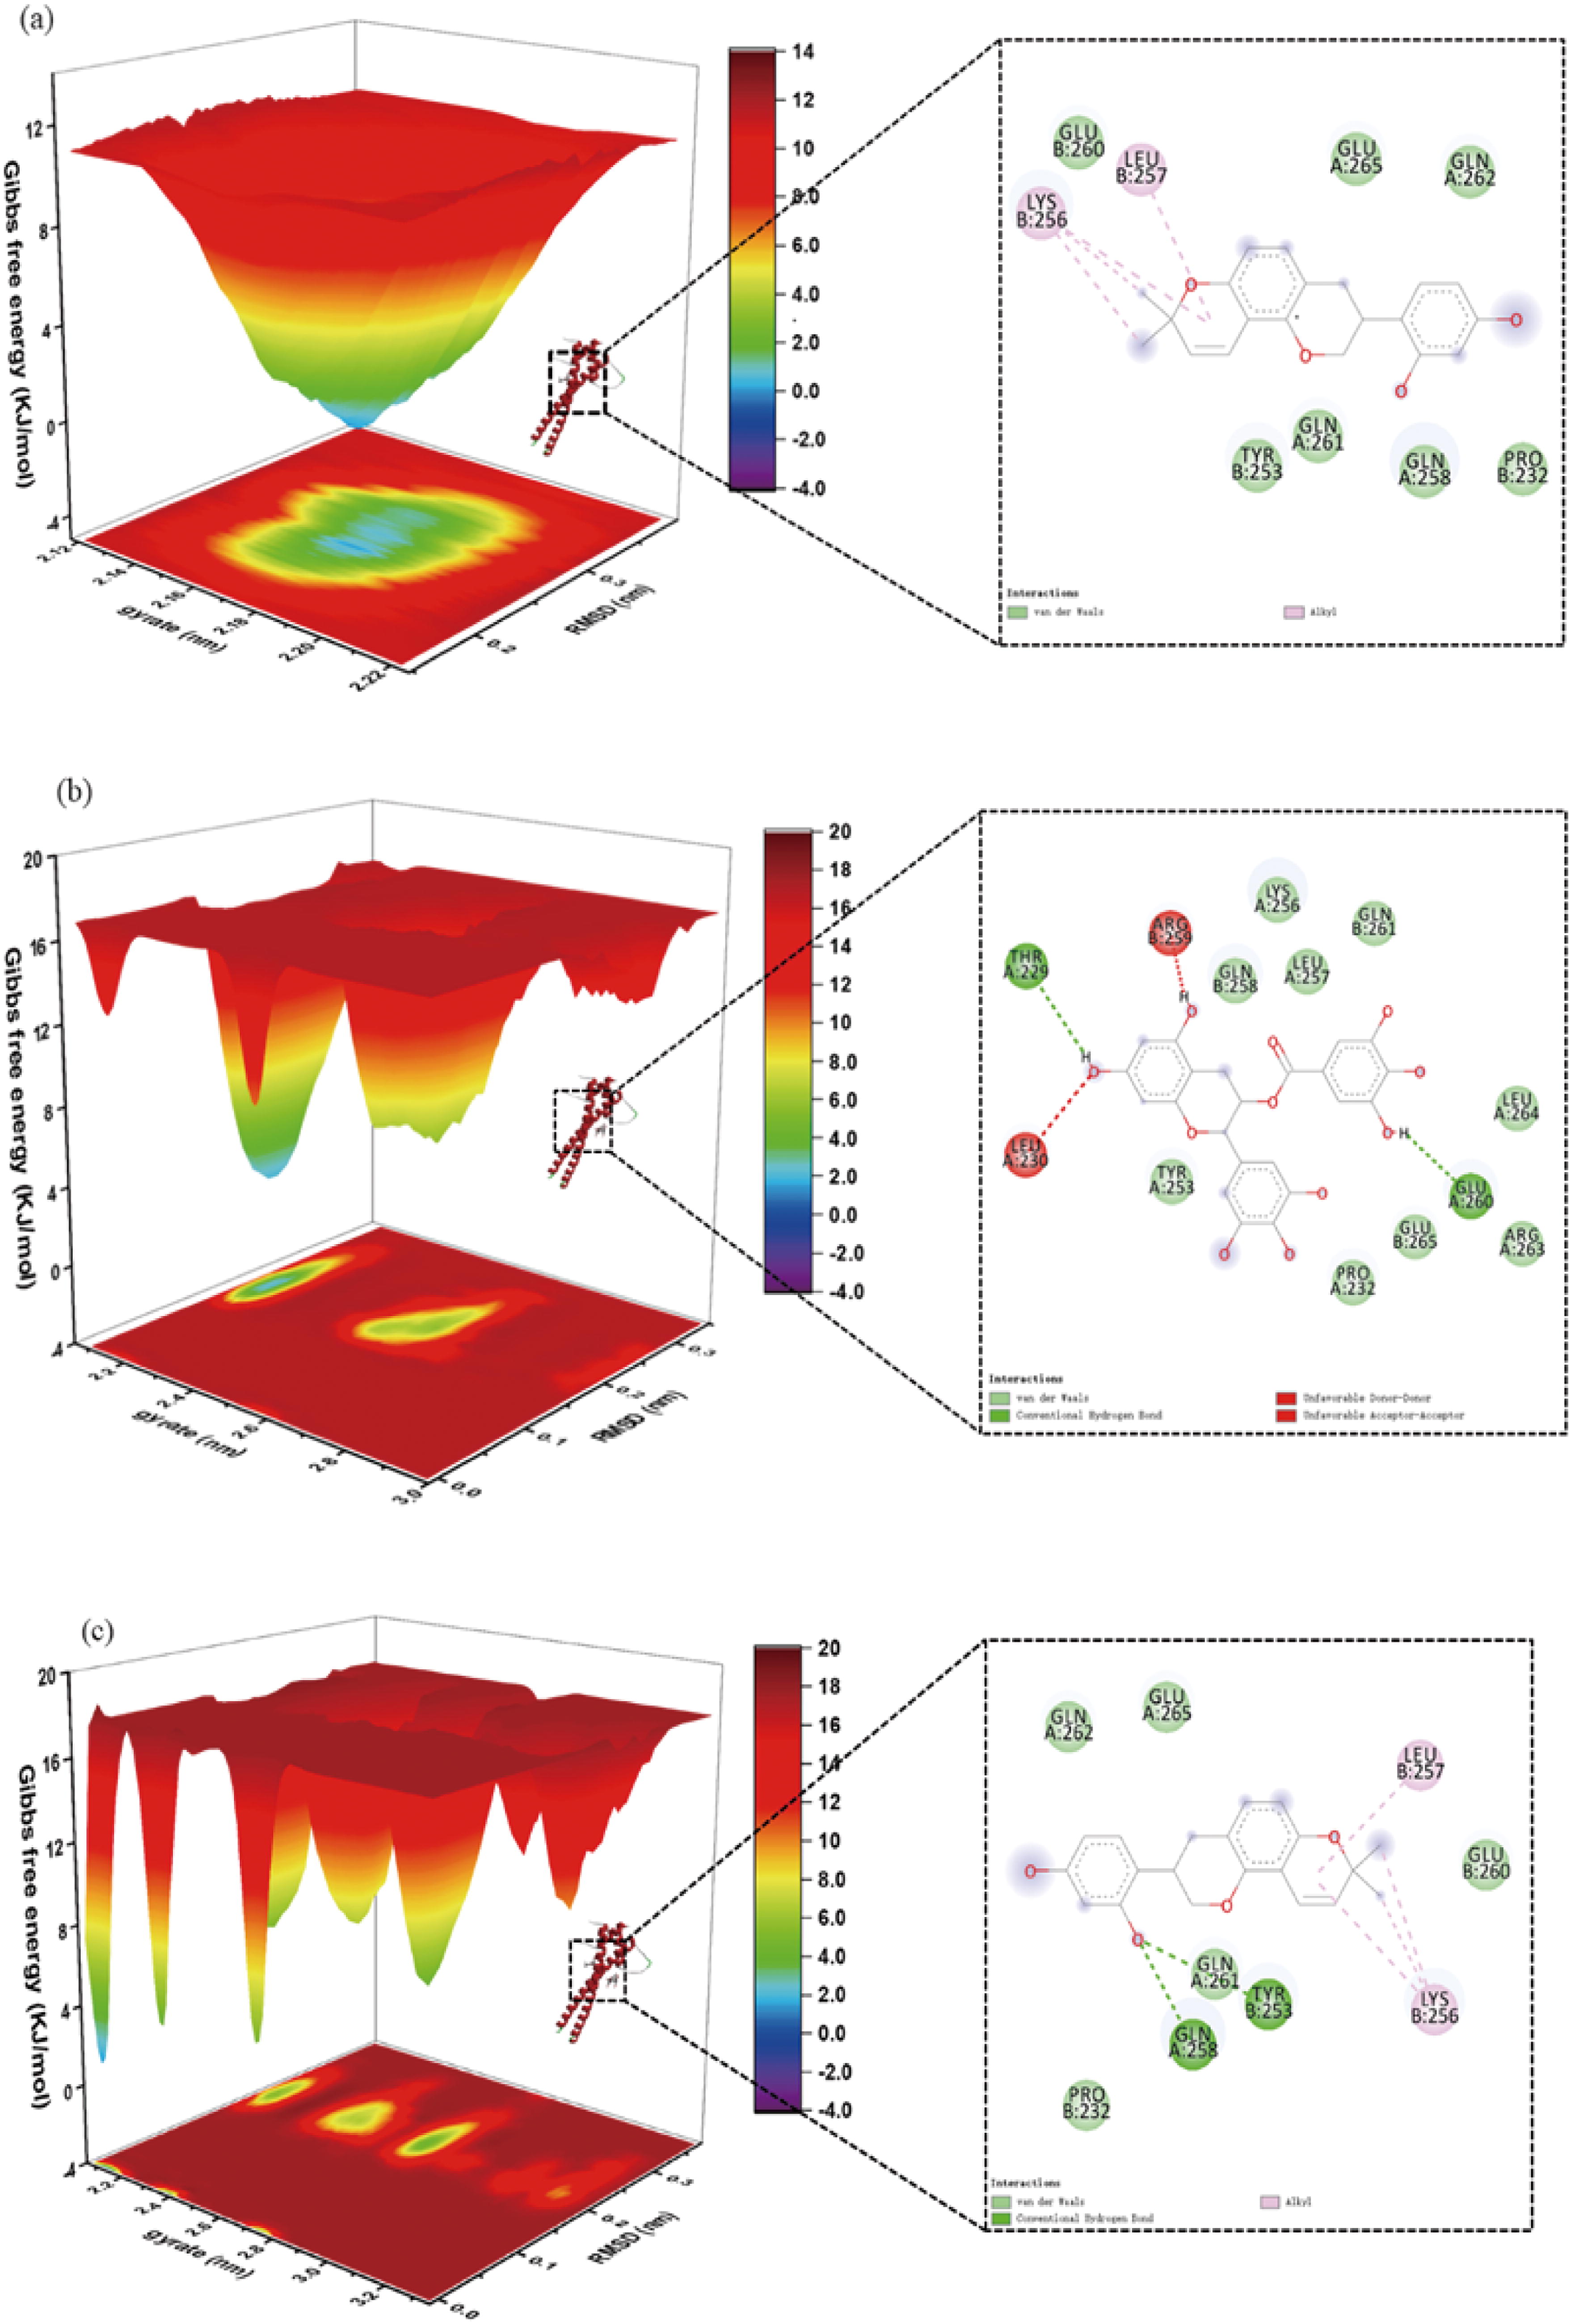
The free energy landscapes (left) and 2D interactions (right) of EGCG/GLA and MITF system.
Protein Ligands MMPBSA Analysis
The RMSD curves represented fluctuations in the conformation of the protein-target complexes, and the molecular motions of the trajectories were computationally simulated for 100 ns. The EGCG-GLA-MITF binding was always stable with no fluctuation in the RMSD curve as shown in Figure 7, and the EGCG-MITF complex fluctuated more after 40 ns, while the GLA-MITF complex only fluctuated more after 25 ns. This indicated that EGCG and GLA have a better synergistic effect on inhibiting MITF function.

Plot of changes in RSMD of protein-ligand complexes.
Preparation and characterization of DMN
To prepare the DMN that was able to effectively penetrate the stratum corneum of mouse skin, we chose the concentrations of 60% PV-A-205 and 45% PV-k29/32 for the preparation of DMN. The composite DMN (containing 100 μg/mL EGCG, 50 μg/mL GLA, and 100 μg/mL Ab) was prepared using a Franz diffusion cell to determine the drug release rate within 8 h to further verify whether the DMN had a good drug release rate. As shown in Figure 8a–c, the results indicated that DMN prepared with 60% PV-A-205 and 45% PV-k29/32 had the highest release rate of the three drugs over 8 h. In conclusion, the prepared DMN had the advantage of a high drug release rate and was able to be used as an effective drug delivery system for animal experiments.

(
EGCG and GLA significantly reduced the excessive deposition of skin melanin and epidermal thickening
The back skin state of C57BL/6 female mice is shown in Figure 9a. The results showed that the skin of the model group and the blank micro-needle group had obvious hyperpigmentation, compared with the control group. At the same time, the four treatment groups (EGCG group, GLA group, Ab group, EGCG and GLA group) had slight melanin deposition, and the EGCG and GLA group had the lowest degree of pigmentation.
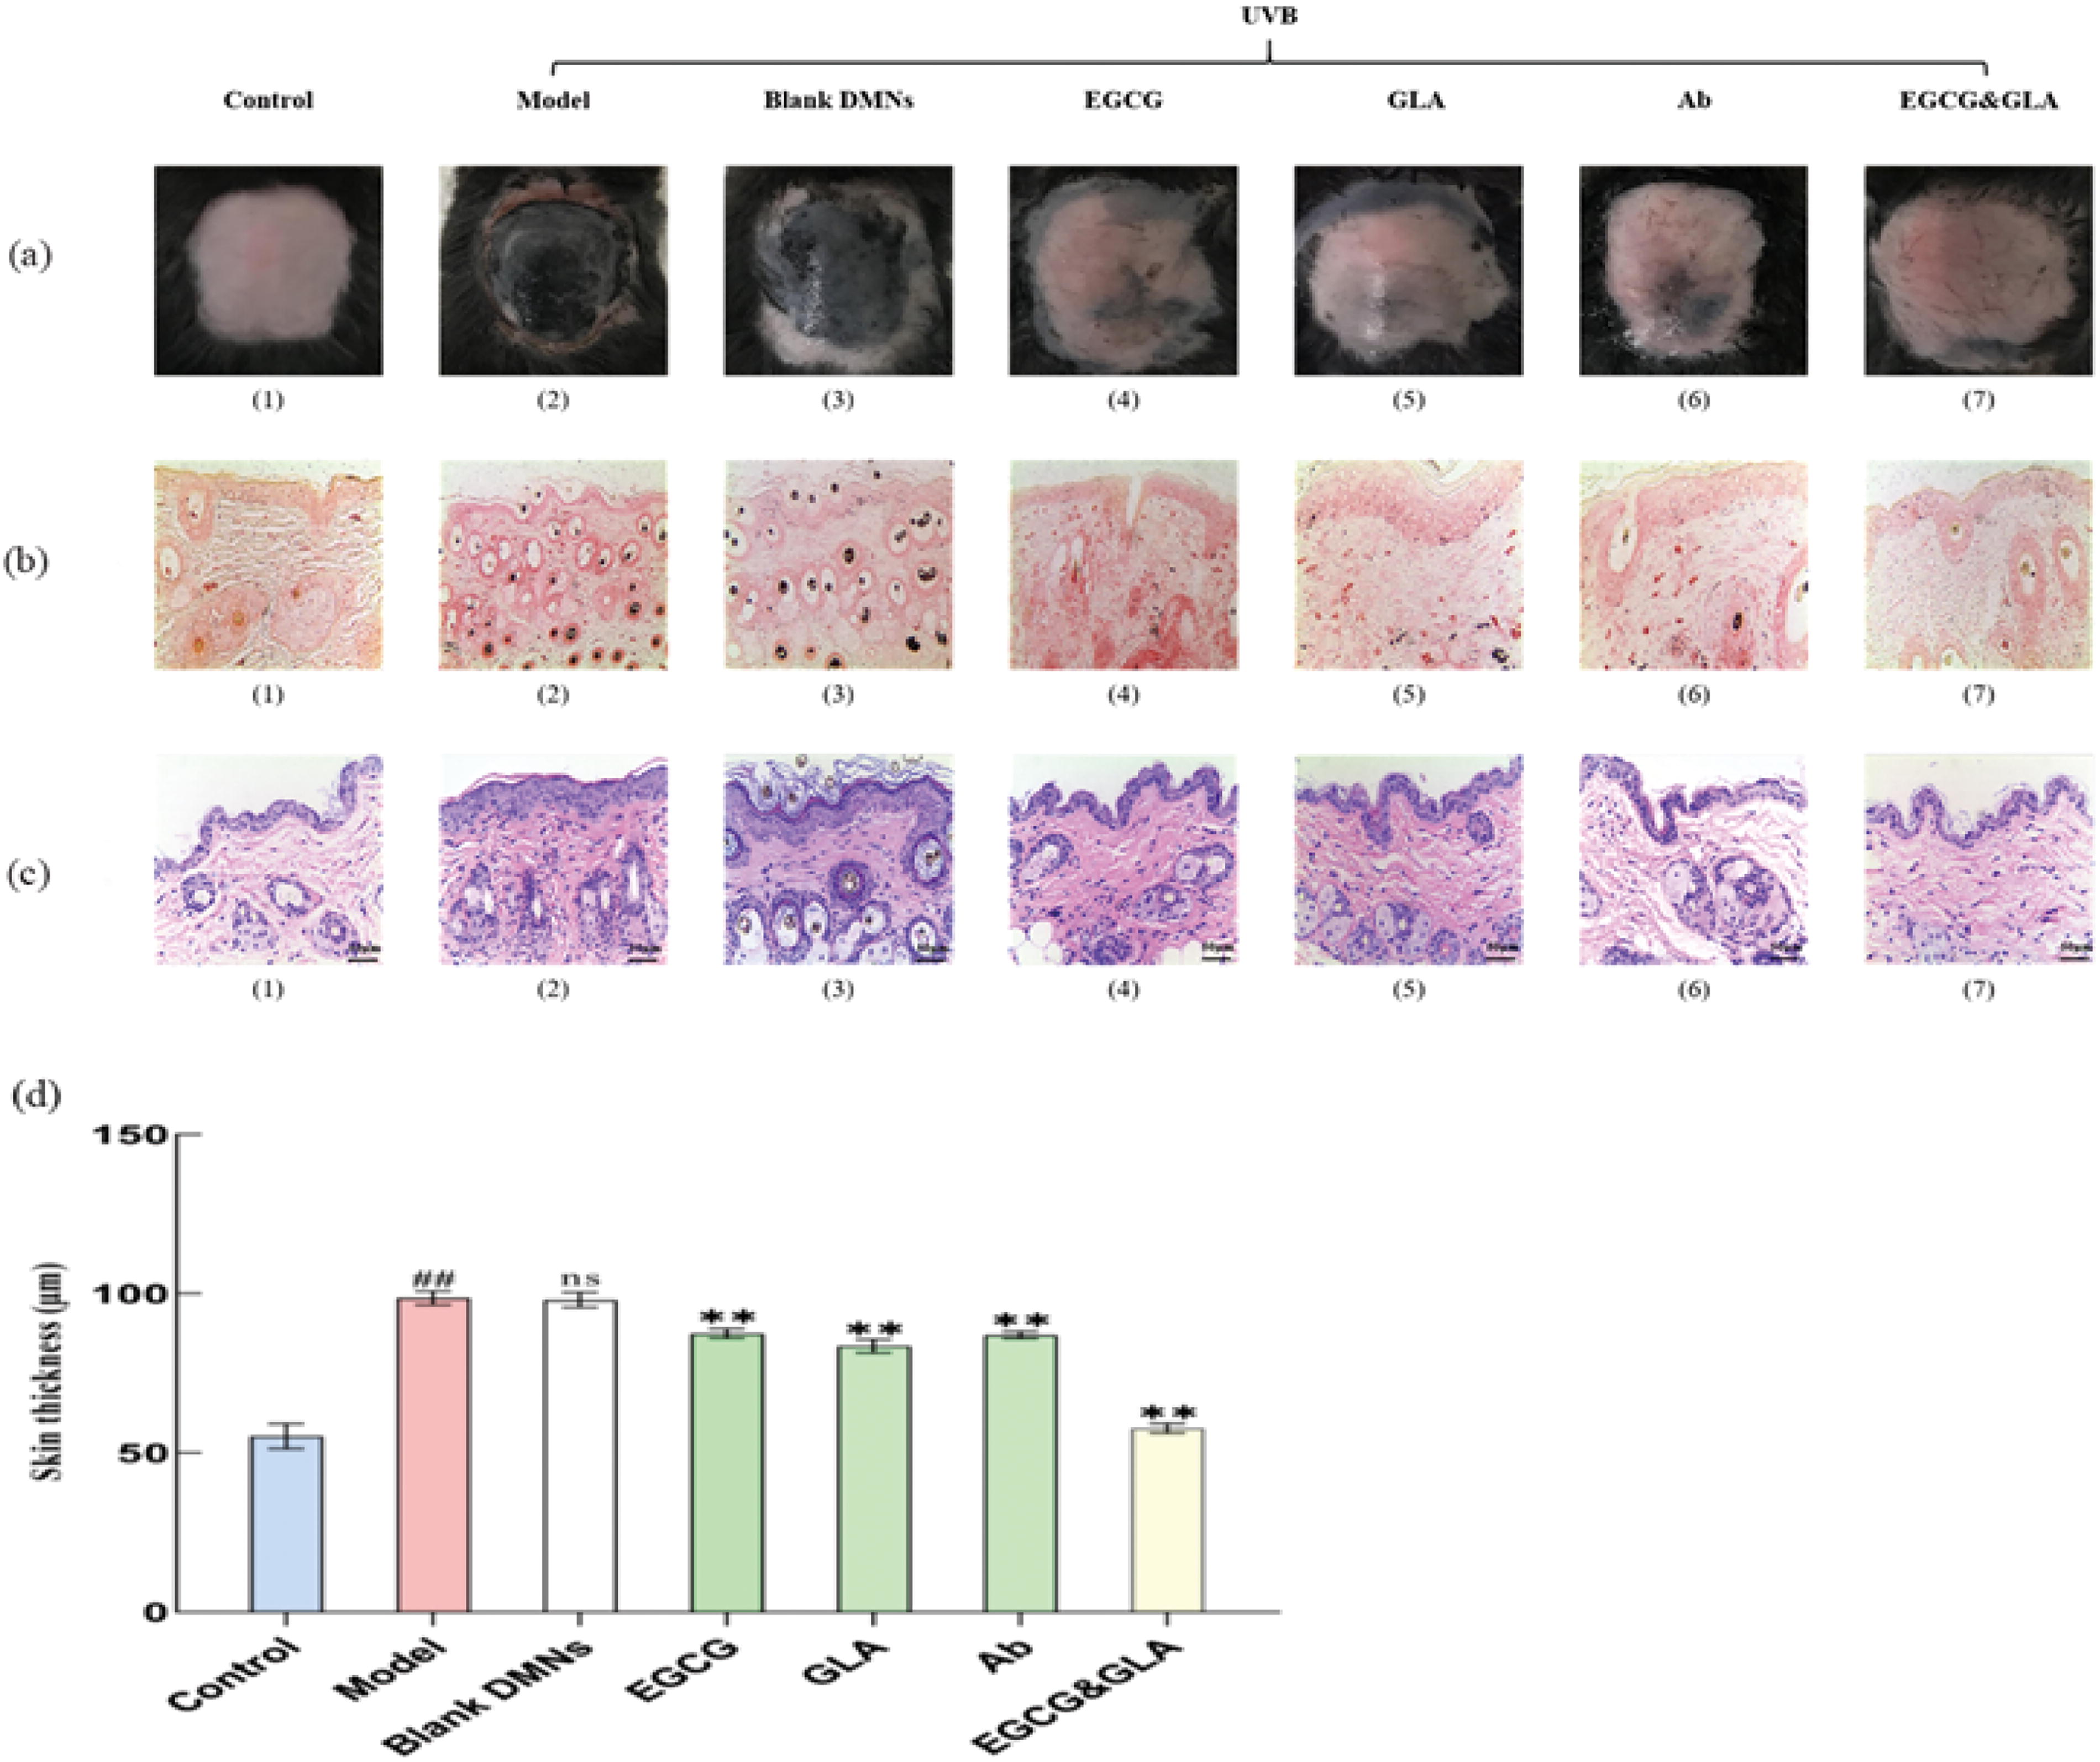
Skin melanin deposition and epidermal thickening.
Masson-Fontana staining was performed on the back skin of the C57BL/6 mice. The staining results are shown in Figure 9b. These results showed that there was no melanin particle distribution in the skin of the control group, and there was a large amount of melanin particle deposition in the model group and the blank micro-needle group. There was a small quantity of melanin granules in the single-drug treatment groups (EGCG group, GLA group, Ab group), but there was no obvious melanin granule deposition in the EGCG and GLA group.
HE staining was also performed in C57BL/6 mice. The staining results showed that the epidermis of the model and blank micro-needle group was significantly thickened compared with the control group, whereas the epidermis of the treatment group was slightly thicker. The specific thickness of each group is shown in Figure 9c–d. All the results showed that the epidermal thickening was significantly reduced by UVB irradiation (P < .01) in the four treatment groups. The EGCG and GLA group had the best therapeutic effect on epidermal thickening.
The combination of EGCG and GLA significantly inhibited mice skin melanin production by regulating the MITF signaling pathway
We examined the expression of melanin-related genes and proteins MITF, TYR, TrP-1, and Trp-2 by qRT-PCR and Western blotting to verify the mechanism of melanogenesis inhibition in mouse skin. As shown in Figure 10, the expression levels of MITF, TYR, Trp-1, and Trp-2 were significantly increased in both the model and blank DMN groups compared with the control group. Furthermore, expression levels of MITF, TYR, Trp-1, and Trp-2 were significantly down-regulated in the four treatment groups (EGCG group, GLA group, Ab group, and EGCG and GLA group), with the lowest level in the EGCG and GLA group (EGCG: GLA = 50 g/mL:25 µg/mL). These results showed that EGCG and GLA significantly downregulated the transcription and expression levels of MITF, TYR, TrP-1, and Trp-2, and inhibited melanin production. These results were consistent with the above MD simulations as well as cellular experiments.

Expression of melanin-related genes and proteins.
DISCUSSION
Melanogenesis is influenced by several transcription factors and signaling pathways. However, MITF is one of the most important regulators of melanogenesis. 23 –25 EGCG and GLA are natural plant-derived components, and some studies have shown that they have potent antioxidant, anti-aging, and anti-dyslipidemia effects. 10 In recent years, some studies have suggested that melanin deposition in skin may be inhibited by EGCG and GLA. 26 Zhang et al. reported that EGCG regulated melanogenesis in B16F10 cells through the cAMP/CREB/MITF pathway, which suggests that catechins could be used as anti-melanogenic agents to protect cells from abnormal melanogenesis. 13 Pan et al. revealed that GLA can effectively inhibit the biological synthesis of melanin both in vitro and in vivo, through the suppression of both PKA/MITF and MAPK/MITF pathways, which suggests that GLA therapy is effective for anti-hyperpigmentation, anti-roughness, and beneficial for skin health. 1 However, the inhibitory mechanism of melanogenesis by EGCG and GLA has rarely been the subject of reports. Especially, the synergistic inhibition mechanism needs further investigation.
In recent years, CompuSyn software has been used to calculate the CI values to infer whether there were synergistic effects among different treatment groups. 16,17 In this study, we evaluated the synergistic inhibition effect on MITF by the CI values from a large number of natural compounds with GLA in B16F10 cells. Interestingly, we found that EGCG and GLA significantly and synergistically inhibited MITF. However, the mechanism of synergistic inhibition of MITF by EGCG and GLA is unclear. Thus, we investigated the synergistic mechanism of inhibition of MITF by molecular docking, MD simulation, and transcriptional regulation.
MD simulation is an indispensable classical technique in CADD. Drug molecules usually exert their pharmacological effects by recognizing and dynamically binding to biomolecular targets such as proteins. It is often difficult to effectively study such dynamic processes by experimental means, so the use of MD to study the dynamic behaviors of target-ligand complex structures is particularly important as a powerful simulation and computational approach. Therefore, we explored whether EGCG and GLA could interact with MITF by MD simulation, and the results showed that the binding within 100 ns in the EGCG-GLA-MITF system was not only stable but also better than that in the EGCG-MITF and GLA-MITF systems. Furthermore, the total binding energy of EGCG-GLA-MITF was the lowest among the above three systems. In conclusion, the combined use of EGCG and GLA can synergistically inhibit MITF, thereby inhibiting melanogenesis.
In this study, the miRDB database search was performed to screen three miRNAs (miR-182-5p, miR-96-5p, and miR-183-5P) for potential effects on MITF. Following this, software simulations were carried out, which indicated that miR-182-5p had the highest binding affinity with MITF. To further validate the simulation reliability, we verified it by the dual luciferase reported assay technique. Interestingly, the experimental results were in good agreement with the theoretical simulations. In summary, EGCG and GLA can regulate the expression of MITF through miR-182-5p, which in turn regulates the synthesis of melanin.
Many studies have shown that DMN can effectively penetrate the skin stratum corneum through a micrometer-sized needle tip and release the whitening ingredients by utilizing the degradable properties of bio-compatible materials. 26 –31 In this study, PV-A-205 and PV-K29/32 composite DMN with good mechanical strength and drug release rate were prepared, and the micro-needle trans-dermal drug delivery loaded with EGCG and GLA (EGCG: GLA = 50 μg/mL: 25 μg/mL) was selected for animal experiments.
CONCLUSIONS
In our study, we found that the melanin production and expression of MITF were significantly inhibited by a combination of EGCG and GLA in B16F10, and there was a synergistic interaction of EGCG and GLA with MITF. The expression of miR-182-5p was obviously modulated by EGCG and GLA in B16F10, and then the mRNA level of MITF was significantly regulated according to the dual-luciferase reported gene assay. The significant interaction of EGCG and GLA with MITF was simulated by MD software GROMACS. To further validate the inhibitory effect, skin experiments were also performed in C57BL/6 mice, which showed that the combination of EGCG and GLA was capable of synergistically inhibiting the expression of MITF and melanin over-deposition.
Footnotes
ACKNOWLEDGMENT
Financial assistance from the National Natural Science Foundation of China and the Major Science and Technology Projects in Zhejiang Province is sincerely appreciated.
AUTHORS’ CONTRIBUTIONS
J.S.: Drafted the article and was involved in the majority of experiments, analysis, and interpretation of data. C.Z.: Drafted the article and was involved in the majority of experiments, analysis, and interpretation of data. T.L.: Performed several experiments and proofread the diagrams in the article. X.W.: Performed several experiments and proofread the diagrams in the article. G.F.: Designed and guided the entire experimental process. G.J.: Designed and guided the entire experimental process.
DATA AVAILABILITY
The data that support the findings of this study are available from the corresponding author upon reasonable request.
ETHICS STATEMENT
The animal experiment protocol was conducted according to the guidelines of the Declaration of Helsinki and approved by the Laboratory Animal Ethics Committee of China Jiliang University (2023-055). All animal procedures were performed in accordance with the institutional and national guidelines.
AUTHOR DISCLOSURE STATEMENT
The authors declare that they have no known competing financial interests or personal relationships that could have appeared to influence the work reported in this article.
FUNDING INFORMATION
This work was financially supported by the National Natural Science Foundation of China (31100499 and 31672394) and the Key Project of Science and Technology Plan of Zhejiang Provincial Market Supervision and Administration Bureau (ZD2025026).