




Abstract
This study explored the anti-obesity potential of Fatdizol, a blend composed of Rosmarinus officinalis L. and Morus alba, in differentiated 3T3-L1 adipocytes and in a high-fat diet (HFD)-induced obese mouse model. High-performance liquid chromatography analysis of Fatdizol verified the presence of two key bioactive constituents, rosmarinic acid and 1-deoxynojirimycin (1-DNJ), which are recognized for their anti-obesity effects. In vitro, the influence of Fatdizol on adipogenesis and lipogenesis was assessed through glycerol release assays, Oil Red O staining, and Western blotting. Fatdizol treatment notably reduced lipid accumulation and triglyceride content while enhancing glycerol release in differentiated adipocytes. In vivo, obesity was induced in C57BL/6J mice by administration of a 60% HFD, followed by oral supplementation with Fatdizol for 16 weeks. Various analyses, including micro-computed tomography imaging, enzyme-linked immunosorbent assay of plasma, adipose tissue, and feces, histological evaluation by hematoxylin and eosin staining of adipose tissues and liver, and western blot analysis, were conducted. Fatdizol administration significantly attenuated body weight gain, reduced white adipose tissue (WAT) and brown adipose tissue mass, improved serum lipid profiles, and decreased both systemic WAT accumulation and lipid droplet size. Mechanistically, Fatdizol inhibited adipogenic and lipogenic protein expression, enhanced lipolytic pathways, stimulated energy metabolism, activated the phosphatidylinositol 3-kinase/protein kinase B signaling axis, and promoted glucose metabolism. Collectively, these findings suggest that Fatdizol holds significant promise as a therapeutic agent for obesity management and may serve as a functional ingredient for health-promoting food development if its efficacy can be confirmed in human clinical trials.
INTRODUCTION
Obesity is a growing public health crisis, with its prevalence increasing rapidly in Western nations, such as the United States. 1 Closely associated with numerous coexisting conditions like type 2 diabetes, high blood pressure, and coronary artery disease, obesity significantly diminishes quality of life and presents substantial health care challenges. 2 Adipose tissue is a key controller of energy balance and plays a central role in energy storage and systemic metabolism, making it critical to understanding obesity and its complications. 3 Adipogenesis, the process in which preadipocytes mature into adipocytes, underpins fat accumulation. This process involves key transcription factors such as peroxisome proliferator-activated receptor gamma (PPARγ) and cytosine–cytosine–adenine–adenine–thymine (CCAAT)/enhancer-binding proteins (C/EBPs). Lipogenesis converts acetyl-CoA into triglycerides (TG) for energy storage, driven by dietary habits and insulin signaling. Conversely, fasting promotes lipolysis, breaking down TG into glycerol and free fatty acids (FFA) to mobilize energy. 4
Lipolysis is regulated by hormonal pathways, including the Cyclic Adenosine Monophosphate (cAMP)-protein kinase A (PKA) cascade, which activates hormone-sensitive lipase (HSL) to hydrolyze TG. This process, modulated by perilipin and phosphodiesterase 3B (PDE3B), highlights the complexity of energy regulation in adipose tissue. Dysregulation of these pathways contributes to obesity and its metabolic consequences. 5 Functionally, adipose tissue comprises white adipose tissue (WAT), which stores energy as TG, and brown adipose tissue (BAT), which dissipates energy via thermogenesis mediated by uncoupling protein 1 (UCP1). The AMP-activated protein kinase (AMPK) pathway also plays a role in regulating energy balance by inhibiting fatty acid synthesis and promoting oxidation. This intricate balance between energy storage and expenditure highlights the potential of adipose tissue as a key focus for obesity treatment. 6
Rosmarinus officinalis L. (R. officinalis L.), a member of the Lamiaceae family, is an herbaceous perennial plant native to the Mediterranean region and now cultivated globally. 7 R. officinalis L. has been recognized for its therapeutic effects in mitigating atherosclerosis, hepatotoxicity, hypercholesterolemia, and obesity. 8,9 Furthermore, R. officinalis L. has demonstrated anti-obesity and metabolic regulatory effects in vivo, including reductions in inflammatory adipokines and hepatic lipid levels, along with the modulation of metabolic gene expression. 10,11 Key bioactive compounds of R. officinalis L., such as carnosic acid, rosmarinic acid (RMA), carnosol, and essential oils, are thought to underpin its therapeutic potential. 12
Morus alba (M. alba), also referred to as white mulberry, is a fast-growing tree belonging to the Moraceae family. While M. alba is well-established for its anti-diabetic effects, recent research has suggested that, beyond its ability to reduce blood glucose levels, the bioactive compounds in M. alba may offer significant benefits in various metabolic processes related to overweight and obesity. 13,14 In particular, M. alba leaf extract has been reported to alleviate adiposity and insulin resistance by modulating adipokine gene expression and improving gut microbiota and lipid homeostasis. 15 One of the active compounds in M. alba leaf extracts, 1-deoxynojirimycin (1-DNJ), is a piperidine polyhydroxy alkaloid found abundantly in mulberry plants. 16,17 This compound has demonstrated various biological activities, such as reducing blood glucose levels, 18 lowering lipids, 19 and exhibiting anticancer properties. 20
In this study, we analyzed the content of RMA and 1-DNJ in Fatdizol, a mixture of leaf extracts from R. officinalis L. and M. alba, and subsequently investigated its anti-obesity effects in adipocytes and obesity model mice fed a high-fat diet (HFD).
MATERIALS AND METHODS
Preparation of materials
The dried R. officinalis L. and M. alba leaves were purchased from Donguiherb Co. (Seoul, Korea). Vouchers for R. officinalis L. and M. alba specimens were deposited at the WiLab Co. Ltd. (Seoul, Korea). The extracts of R. officinalis L. and M. alba were prepared by refluxing the leaves with 30% ethanol at 80 ± 2°C for 6 h, respectively. The extracts were subsequently separated, and concentrated in a water bath under vacuum using a rotary evaporator. Fatdizol was prepared by combining R. officinalis L. and M. alba extracts in a 7:3 (w/w) ratio and spray-drying the mixture with 20% dextrin. Fatdizol was securely sealed and preserved at −20 ◦C prior to experimentation.
RMA, 1-Deoxynojirimycin (1-DNJ), and 9-fluorenylmethyl chloroformate (FMOC-CI) were obtained from Sigma Aldrich (St. Louis, USA). High-performance liquid chromatography (HPLC)-grade acetonitrile, HPLC-grade methanol, extra pure grade boric acid, extra pure grade potassium hydroxide, and glycine were purchased from Samchun Chemicals (Seoul, Korea). Extra pure-grade acetic acid, hydrochloric acid, and phosphoric acid were obtained from Deajung Chemicals & Metals Co. Ltd. (Gyeonggi-do, Korea). Water was produced using a POWER 1 system (Human Science Co. Ltd, Gyeonggi-do, Korea).
Quantification of RMA and 1-DNJ by HPLC
For RMA analysis, the standard was prepared by stepwise dilution to 3.125–100 ppm. 50 mg of sample was dissolved with 10 mL 50% MeOH, extracted for 30 min with ultrasonication, and then clarified by filtration using a 0.45 μm pore-size syringe filter. Waters HPLC system, E2695 and 2998 PDA detector (Waters, USA) were used, and the column was CAPCELL PAK C18 (4.6 × 250 mm, 5 μm, OSAKA SODA Co. Ltd.). The analytes were kept at 25°C and injected at 10 μL. The mobile phase comprised 0.05% Phosphoric acid (A) and acetonitrile (B). The chromatography was conducted on a gradient using a flow rate of 1.2 mL/min at 45°C and measured at 328 nm. The chromatographic gradient was established under the following conditions (time, Solvent B concentration): 0 min, 18%; 25 min, 18%; 26 min, 90%; 30 min, 90%; 31 min, 18%; 35 min, 18%.
For 1-DNJ analysis, analytical sample preparation and HPLC analysis was conducted with modifications based on the method proposed by Saurabh Bajpai and A. Vijaya Bhaskara Rao. 21 Standards were prepared by stepwise dilution to 3.125–100 ppm. 500 mg of sample was dissolved with 10 mL 0.05 N hydrochloric acid in distilled water, extracted for 5 min in ultrasonication, and centrifuged at 1500 × g for 5 min. The centrifuged supernatant was collected in a 50 mL Corning tube. The above process was repeated once more. All the supernatants were combined and the final volume was adjusted to 50 mL using distilled water. A 0.5 mL aliquot for a standard for each concentration was added to 0.5 mL of 0.4 M potassium borate solution and 1 mL 9-fluorenylmethyl chloroformate and reacted for 20 min in the water bath at 20°C. After the reaction, we added 0.5 mL 0.1 M glycine and 5 mL 0.1% acetic acid. A 0.45 μm syringe filter was used to clarify the derivatized extract.
A Waters HPLC system, E2695 and 2998 PDA detector (Waters, USA), was used, and the column was a Fortis C18 (4.6 × 150 mm, 5 μm, Fortis Technologies Ltd.). The analytes were kept at 20°C and injected at 20 μL. The mobile phase was comprised of 0.1% acetic acid (A) and acetonitrile (B). The chromatography was conducted on a gradient using a flow rate of 1 mL/min at 25°C and measured at 264 nm. The gradient conditions were as follows (time, Solvent B concentration): 0 min, 30%; 20 min, 40%; 30 min, 40%; 40 min, 50%; 45 min, 90%; 50 min, 30%.
Cell culture, differentiation of 3T3-L1 preadipocytes, and sample treatment
The mouse 3T3-L1 preadipocyte cell line was procured from the American Type Culture Collection (ATCC, Rockville, MD, USA) and cultured under 95% air and 5% carbon dioxide at 37°C. Cells were maintained in Dulbecco’s Modified Eagle’s Medium (DMEM) supplemented with 10% newborn calf serum (NCS), 1% non-essential amino acids, 1% sodium pyruvate, 1% penicillin-streptomycin, and 1% l-glutamine. For differentiation, cells were seeded at a density of 3 × 10⁵ cells per well in 6-well plates. Upon reaching near confluence, differentiation was initiated by replacing NCS with DMEM containing 10% fetal bovine serum and an adipogenic cocktail of 0.5 mM 3-isobutyl-1-methylxanthine, 1 μM dexamethasone, and 10 μg/mL insulin for 3 days. Subsequently, the medium was replaced with DMEM supplemented only with insulin (10 μg/mL) for another 3 days. The adipogenic cocktail was then removed, and cells were cultured in fresh medium. The groups included normal control (NC; no treatment), differentiation control (C), positive control 1 (PC1; metformin 1 mM), positive control 2 (PC2; catechin 100 μg/mL), and Fatdizol-treated groups (10, 50, and 100 μg/mL). Treatments were administered daily during the 9-day differentiation period. 22
Oil red O staining for lipid accumulation assessment
Lipid accumulation was assessed using a modified protocol based on our established methods. 23 After differentiation, 3T3-L1 cells were washed with Dulbecco’s phosphate-buffered saline and fixed in 10% formalin. Following fixation, cells were dehydrated using 60% isopropanol and stained with Oil Red O working solution for 2 h. Excess stain was removed by rinsing with distilled water, and images were acquired. Lipid-bound dye was eluted with 100% isopropanol, and optical density (OD) was measured at 520 nm to quantify lipid content.
Glycerol release assay for evaluating lipolysis
Glycerol release, a marker of TG breakdown, was measured using a glycerol phosphate oxidase (GPO)-Trinder enzyme assay (Sigma-Aldrich). After differentiation, culture medium was mixed with the reagent, incubated, and OD was read at 540 nm. Glycerol concentration was calculated using a standard curve derived from a glycerol standard solution (Sigma-Aldrich). 24
Animal studies and experimental design
The animal experiments were approved by the Institutional Animal Care and Use Review Committee of Kyung Hee University (KHGASP-24-060). Forty male C57BL/6J mice (4 weeks old; initial body weight 20.61 ± 1.16 g) were obtained from Saeronbio Inc. (Uiwang, Korea) and maintained under controlled conditions. 25
Mice were randomly assigned into five groups: NC (normal control), C (obesity control), PC (HFD + metformin 250 mg/kg body weight), Fatdizol 100 (HFD + Fatdizol 100 mg/kg body weight), and Fatdizol 200 (HFD + Fatdizol 200 mg/kg body weight). Diets were formulated according to AIN-93G standards and administered for 16 weeks. At the study endpoint, mice were euthanized under anesthesia with an O2/N2O gas mixture delivered via an isoflurane respirator.
Micro-computed tomography imaging
One day before sacrifice, anesthetized mice underwent whole-body and abdominal imaging using a micro-computed tomography (micro-CT) scanner (VIVA CT 80, Scano Medical AG, Switzerland). Imaging parameters included voxel size 150 μm, energy 45 kVp, intensity 110 μA, field of view 79.8 mm, and integration time 160 ms. Image analysis was conducted using μCT Evaluation Program V6.6 software, and fat mass was quantified within a Hounsfield Unit (HU) range of −200 to −30.
Histological analysis using hematoxylin and eosin staining
Epididymal WAT samples were fixed in 10% neutral-buffered formalin for 24 h, rinsed with phosphate-buffered saline, embedded in paraffin, sectioned, and stained with hematoxylin and eosin (H&E) for microscopic analysis.
Protein expression analysis by Western blotting
Post-differentiation, 3T3-L1 adipocytes and tissues (WAT, BAT, and liver) from HFD-induced obese mice were lysed using CelLytic™ MT Cell Lysis Reagent (Sigma-Aldrich) supplemented with Halt™ protease and phosphatase inhibitor cocktail (Thermo Fisher Scientific). Protein samples were quantified, separated by Sodium Dodecyl Sulfate (SDS)-polyacrylamide gel electrophoresis, and transferred to membranes. 25 Primary antibodies targeting PPARγ, p-CREB, CREB, C/EBPβ, leptin, adiponectin, SREBP1c, Phosphorylated Acetyl-CoA Carboxylase (p-ACC), ACC, Fatty Acid Synthase (FASN), ATGL, PKA, p-HSL, HSL, perilipin A, PDE3B, p-AMPK, AMPK, UCP1, CPT1A, ACOX1, PGC1α, FABP4, p-IRS, IRS, p-PI3K, PI3K, p-AKT, AKT, and β-actin were used. Antibodies were sourced from Cell Signaling Technology (Beverly, MA, USA), Abcam (Cambridge, MA, USA), LSBio (Seattle, WA, USA), and Bethyl Laboratories (Montgomery, TX, USA). Secondary horseradish peroxidase-conjugated antibodies were used, and signals were detected with EzWestLumi plus reagent and visualized using the Ez-Capture II imaging system (ATTO, Tokyo, Japan). Densitometric analysis was performed with CS Analyzer 3.0 software.
Biochemical parameter measurements
Biochemical parameters including alanine aminotransferase (ALT; Alanine Aminotransferase Activity Colorimetric Assay Kit, Abcam), aspartate aminotransferase (AST; Aspartate Aminotransferase Activity Colorimetric Assay Kit, Abcam), TG (Triglyceride Quantification Kit, Abcam), total cholesterol (TC; Total Cholesterol Assay Kit, Abcam), LDL/High-Density Lipoprotein (HDL)-cholesterol (Abcam), FFA (Free Fatty Acid Colorimetric Assay Kit, Abcam), glucose (Glucose Assay Kit, Abcam), insulin (Insulin ELISA Kit, Abcam), hemoglobin A1c (HbA1c; Hemoglobin A1c Assay Kit, Crystal Chem Inc.), glucagon-like peptide-1 (GLP-1; GLP-1 ELISA Kit, LS-Bio), and cyclic adenosine monophosphate (cAMP; cAMP ELISA Kit, Cell Biolabs Inc., San Diego, CA, USA) were quantitatively measured in differentiated 3T3-L1 adipocytes, plasma, fecal samples, and white adipose tissue (WAT), respectively, utilizing enzyme-linked immunosorbent assay (ELISA) kits. All experimental procedures strictly adhered to the protocols provided by the respective manufacturers.
Statistical analysis
Data are expressed as the means ± standard deviations (SD). The Shapiro-Wilk test was used to evaluate the normality of the data. If the data exhibited a normal distribution, the effects of Fatdizol were evaluated using one-way ANOVA followed by Duncan’s multiple range test for post hoc comparisons, conducted with the SPSS statistical software (SPSS PASW Statistics 22.0, SPSS, Inc., Chicago, IL, USA). If the data were not normally distributed, non-parametric tests were utilized. A P value of less than .05 was regarded as statistically significant, with significance indicated by different superscript letters.
RESULTS
Quantitative analysis of RMA and 1-DNJ in Fatdizol by HPLC
RMA and1-DNJ were selected as standards for the quality control of Fatdizol. RMA, one of the main phenolic compounds of R. officinalis L., was initially discovered in its root bark. 1-DNJ is a representative compound of M. alba, and a naturally occurring compound identified for the first time in the root bark of M. alba. Although it has been isolated from various plants, its concentration is highest in M. alba. As a result, the representative chromatogram of Fatdizol is shown in Figure 1. RMA and 1-DNJ were eluted at 13 min and 8 min, respectively. In Fatdizol, the RMA was determined to be 27.95 mg/g, and 1-DNJ was determined to be 1.67 mg/g. That was consistent with the content quality control specifications for Fatdizol.
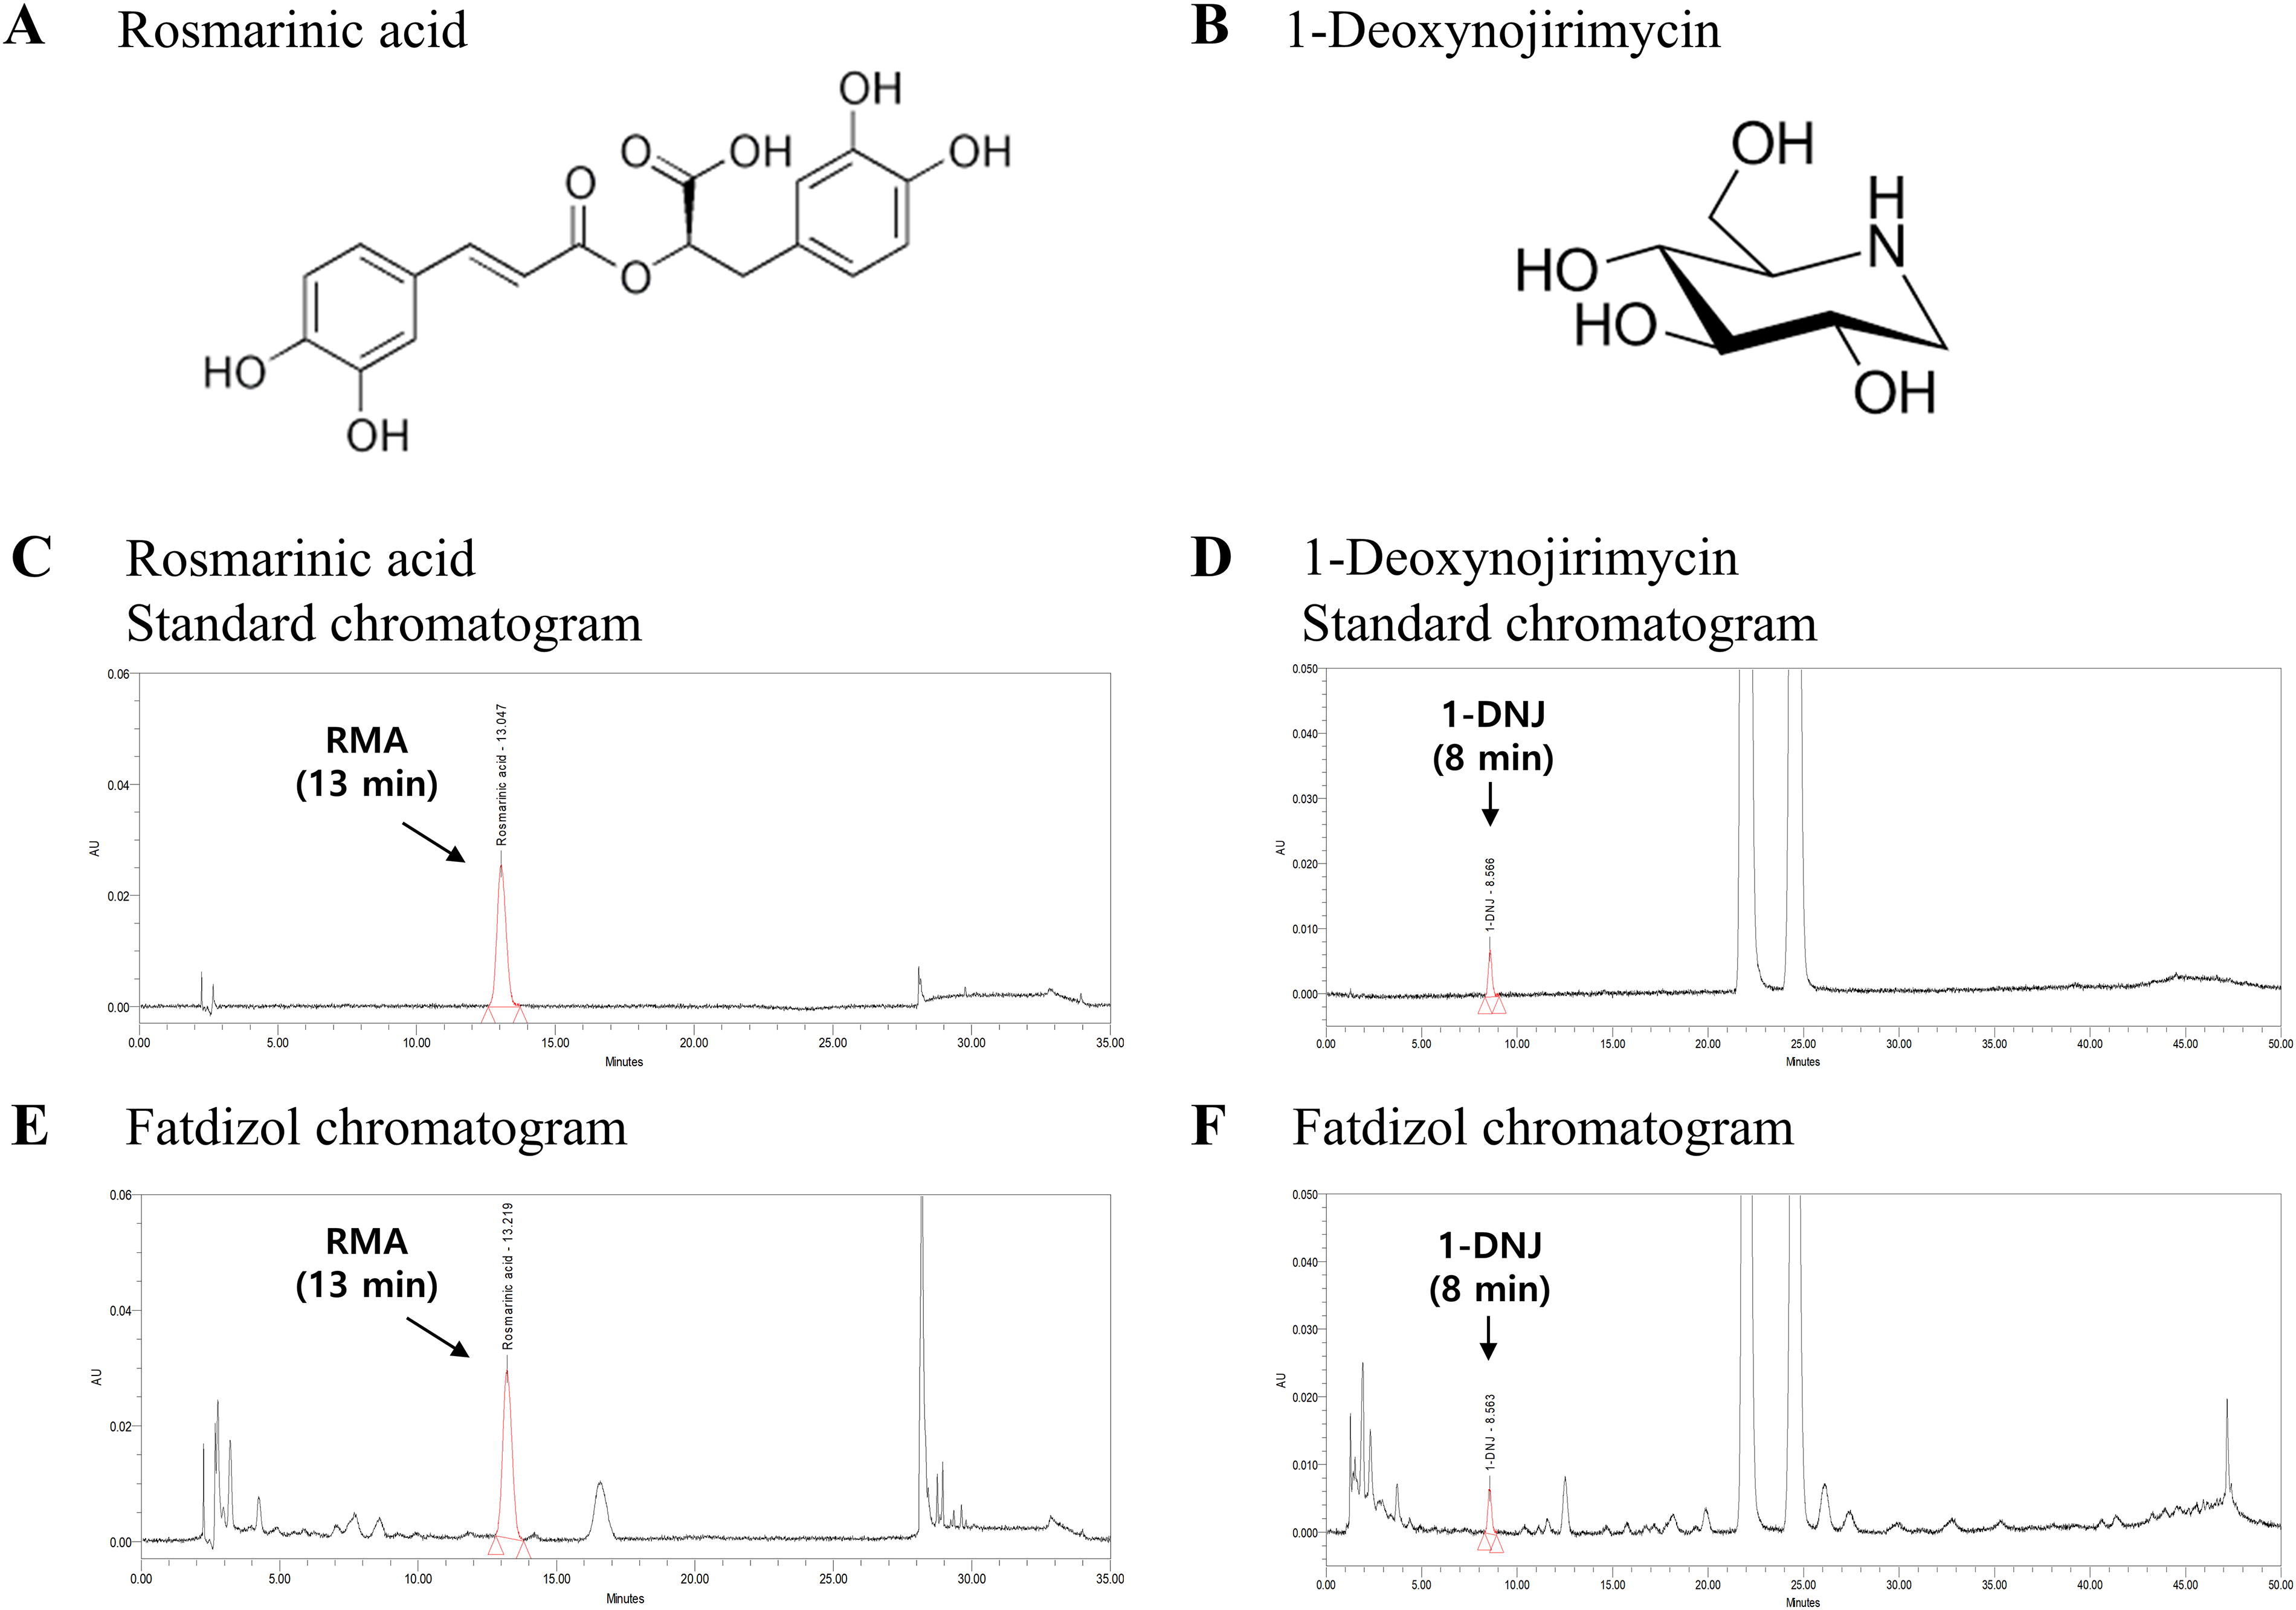
High-performance liquid chromatography (HPLC) chromatograms of 1-Deoxynojirimycin (1-DNJ) and rosmarinic acid (RMA) in the Fatdizol blend at 264 or 328 nm.
Fatdizol suppresses lipid accumulation and triglyceride synthesis during adipogenesis in 3T3-L1 cells
Oil Red O staining and TG contents analysis were performed to assess lipid accumulation during the inhibition of adipogenesis in differentiated 3T3-L1 cells. The OD value in the C group was significantly greater than that in the NC group. Conversely, the OD values for the PC1 (Metformin 1 mM), PC2 (catechin 100 μg/mL), and Fatdizol (50, and 100 μg/mL) groups showed a dose-dependent reduction relative to the C group (Fig. 2A–C).

Fatdizol inhibits lipid accumulation and adipogenesis by regulating adipogenic and lipogenic factors.
Fatdizol enhances glycerol release, promoting lipolysis in adipocytes
Glycerol release was measured to evaluate the lipolytic activity in the experimental groups. The PC groups (Metformin and catechin) demonstrated a significant increase in glycerol release compared to the C group, indicating enhanced lipolysis. Similarly, the Fatdizol-treated groups (50 and 100 µg/mL) exhibited a dose-dependent elevation in glycerol release relative to the C group, further supporting its lipolytic effect. These results suggest that both positive controls and Fatdizol treatment effectively promote lipolysis, with Fatdizol showing a clear dose-responsive relationship. (Fig. 2D).
Regulatory effects of Fatdizol on adipogenic and lipogenic protein expression in adipocytes
The protein expression data for adipogenic and lipogenic genes are illustrated in Figure 1. In the C group, the adipogenic genes, including PPARγ, the p-CREB/CREB ratio, C/EBPβ, and leptin, were significantly higher than those in the NC group. Conversely, the expression of these genes was significantly reduced in the PC groups treated with Metformin and Catechin, compared to the C group. Additionally, the groups administered Fatdizol (at 10, 50, and 100 µg/mL) showed a dose-dependent regulation of these adipogenic markers. Notably, the protein level of adiponectin in the Fatdizol-treated groups showed a dose-dependent increase relative to the C group (Fig. 2E and F).
For the lipogenic genes, the levels of SREBP1c and FASN were significantly higher in the C group compared to the NC group. Conversely, the PC groups treated with Metformin and Catechin showed a significant reduction in the expression of these genes compared to the C group. In the groups administered Fatdizol (at 10, 50, and 100 µg/mL), the protein expression of SREBP1c and FASN was reduced in a dose-dependent manner in comparison to the C group. However, the p-ACC/ACC ratios in the groups administered Fatdizol (at 10, 50, and 100 µg/mL) were significantly and dose-dependently increased compared to the C group (Fig. 2G and H).
Impact of Fatdizol on body weight, feed efficiency, and adipose tissue weight in HFD-Induced obese mice
Table 1 summarizes the effects of Fatdizol on body weight gain, feed efficiency ratio (FER), and organ weights. The final body weight in the HFD-C group was significantly higher than that of the NC group. In contrast, Fatdizol administration at 100 and 200 mg/kg body weight (b.w.) resulted in a dose-dependent reduction in final body weight compared to the HFD-C group. No notable differences in FER were observed among the HFD-fed groups, including the PC and those treated with Fatdizol (at 100 and 200 mg/kg b.w.). Liver weights were significantly decreased in the groups treated with Fatdizol (at 100 and 200 mg/kg b.w.) compared to the HFD-C group. However, no appreciable differences were noted in the kidney and spleen weights across all experimental groups. In the HFD-C group, the weights of total, subcutaneous, and visceral WAT were significantly elevated in comparison to the NC group. Notably, these WAT weights were significantly reduced in the groups treated with Fatdizol (at 100 and 200 mg/kg b.w.) in comparison with the HFD-C group. In summary, Fatdizol demonstrated a dose-dependent ability to reduce body weight, liver weight, and adipose tissue accumulation in high-fat diet-fed mice, indicating its potential anti-obesity effects.
Effects of Fatdizol on the Body Weights, Weight Gains, FER, Organ Weights and Adipose Tissue Weights of High-Fat Diet Induced Obese C57BL/6J Mice
Values are presented as means ± standard deviations (n = 8), and different superscript letters indicate significance at P < 0.05.
Statistical significance was determined using one-way ANOVA followed by post hoc test. Different letters (a, b, c, d) in the table indicate significant differences between groups (P < 0.05).
NS: No significance.
Weight gain (g/16 weeks) = final body weight (g) - initial body weight (g).
FER (Food efficiency rate) = weight gain (g)/total food consumption (g) × 100.
NC, normal control; C, obesity-induced control; PC, HFD+Metformin 250 mg/kg b.w.; Fatdizol 100, HFD+ Fatdizol extract 100 mg/kg b.w.; Fatdizol 200, HFD+ fatdizol extract 200 mg/kg b.w. WAT, white adipose tissue; BAT, brown adipose tissue. HFD, High-Fat Diet.
Fatdizol improves lipid profiles and metabolic biomarkers in HFD-Induced obese mice
The hepatotoxicity evaluation in experimental animals treated with Fatdizol revealed that AST and ALT levels remained within normal ranges, indicating no evidence of hepatotoxicity. The blood levels of TG, TC, and low-density lipoprotein cholesterol (LDL-C) were significantly higher in the HFD-C group than in the NC group. Metformin (250 mg/kg b.w.) or Fatdizol (100 and 200 mg/kg b.w.) significantly reduced these levels relative to the HFD-C group. Notably, the LDL/HDL cholesterol ratio was significantly decreased in the groups treated with Fatdizol (at 100 and 200 mg/kg b.w.) in comparison with the HFD-C group. The level of FFAs was markedly elevated in the HFD-C group compared to the NC group, and it was notably reduced in the metformin-treated group (250 mg/kg b.w.) relative to the HFD-C group. While FFA levels also decreased in the groups treated with Fatdizol (at 100 and 200 mg/kg b.w.), the reductions were not statistically significant. Additionally, the levels of glucose, insulin, HbA1c were markedly increased in the HFD-C group relative to the NC group, but treatment with Fatdizol (100 and 200 mg/kg b.w.) led to significant reductions in these parameters. In contrast, GLP-1 levels were significantly decreased in the HFD-C group compared to the NC group, but were significantly increased in the treatment groups (Fatdizol at 100 and 200 mg/kg b.w.) compared to the HFD-C group (Table 2).
Effects of Fatdizol on Blood Lipid Profiles, Biochemical Markers, and Fecal Lipid Profiles in High-Fat Diet-Induced Obese C57BL/6J Mice
Values are presented as means ± standard deviations (n = 8), and different superscript letters indicate significance at P < 0.05.
Statistical significance was determined using one-way ANOVA followed by post hoc test. Different letters (a, b, c, d, e) in the table indicate significant differences between groups (P < 0.05).
NC, normal control; C, obesity-induced control; PC, HFD+Metformin 250 mg/kg b.w.; Fatdizol 100, HFD+ Fatdizol extract 100 mg/kg b.w.; Fatdizol 200, HFD+ fatdizol extract 200 mg/kg b.w. ALT, alanine aminotransferase; AST, aspartate aminotransferase; BAT, brown adipose tissue; HFD, high-fat diet; GLP, glucagon-like peptide-1; LDL, low-density lipoprotein; WAT, white adipose tissue.
Fatdizol reduces adipose tissue volume and adipocyte size in HFD-Induced obese mice
Tomography analysis revealed that total adipose tissue, including subcutaneous and visceral fat mass, was markedly higher in the HFD-C group than in the normal condition. Conversely, the PC group (metformin, 250 mg/kg b.w.) showed a significant reduction in adipose mass relative to the HFD-C group. Importantly, treatment with Fatdizol (100 and 200 mg/kg b.w.) led to a dose-dependent and significant decrease in adipose mass relative to the HFD-C group (Fig. 3A–C). Similarly, the HFD-C group exhibited a notable increase in abdominal fat volume relative to the NC group. However, significant decreases in abdominal adipose volume were observed in both the PC group (metformin, 250 mg/kg b.w.) and the groups treated with Fatdizol (at 100 and 200 mg/kg b.w.), compared to the HFD-C group. Furthermore, H&E staining analysis of epididymal WAT showed that adipocyte size was notably enlarged in the HFD-C group when compared with the NC group. However, both the PC group (metformin, 250 mg/kg b.w.) and the Fatdizol-treated group (200 mg/kg b.w.) exhibited a significant reduction in adipocyte size relative to the HFD-C group. (Fig. 3D and E).
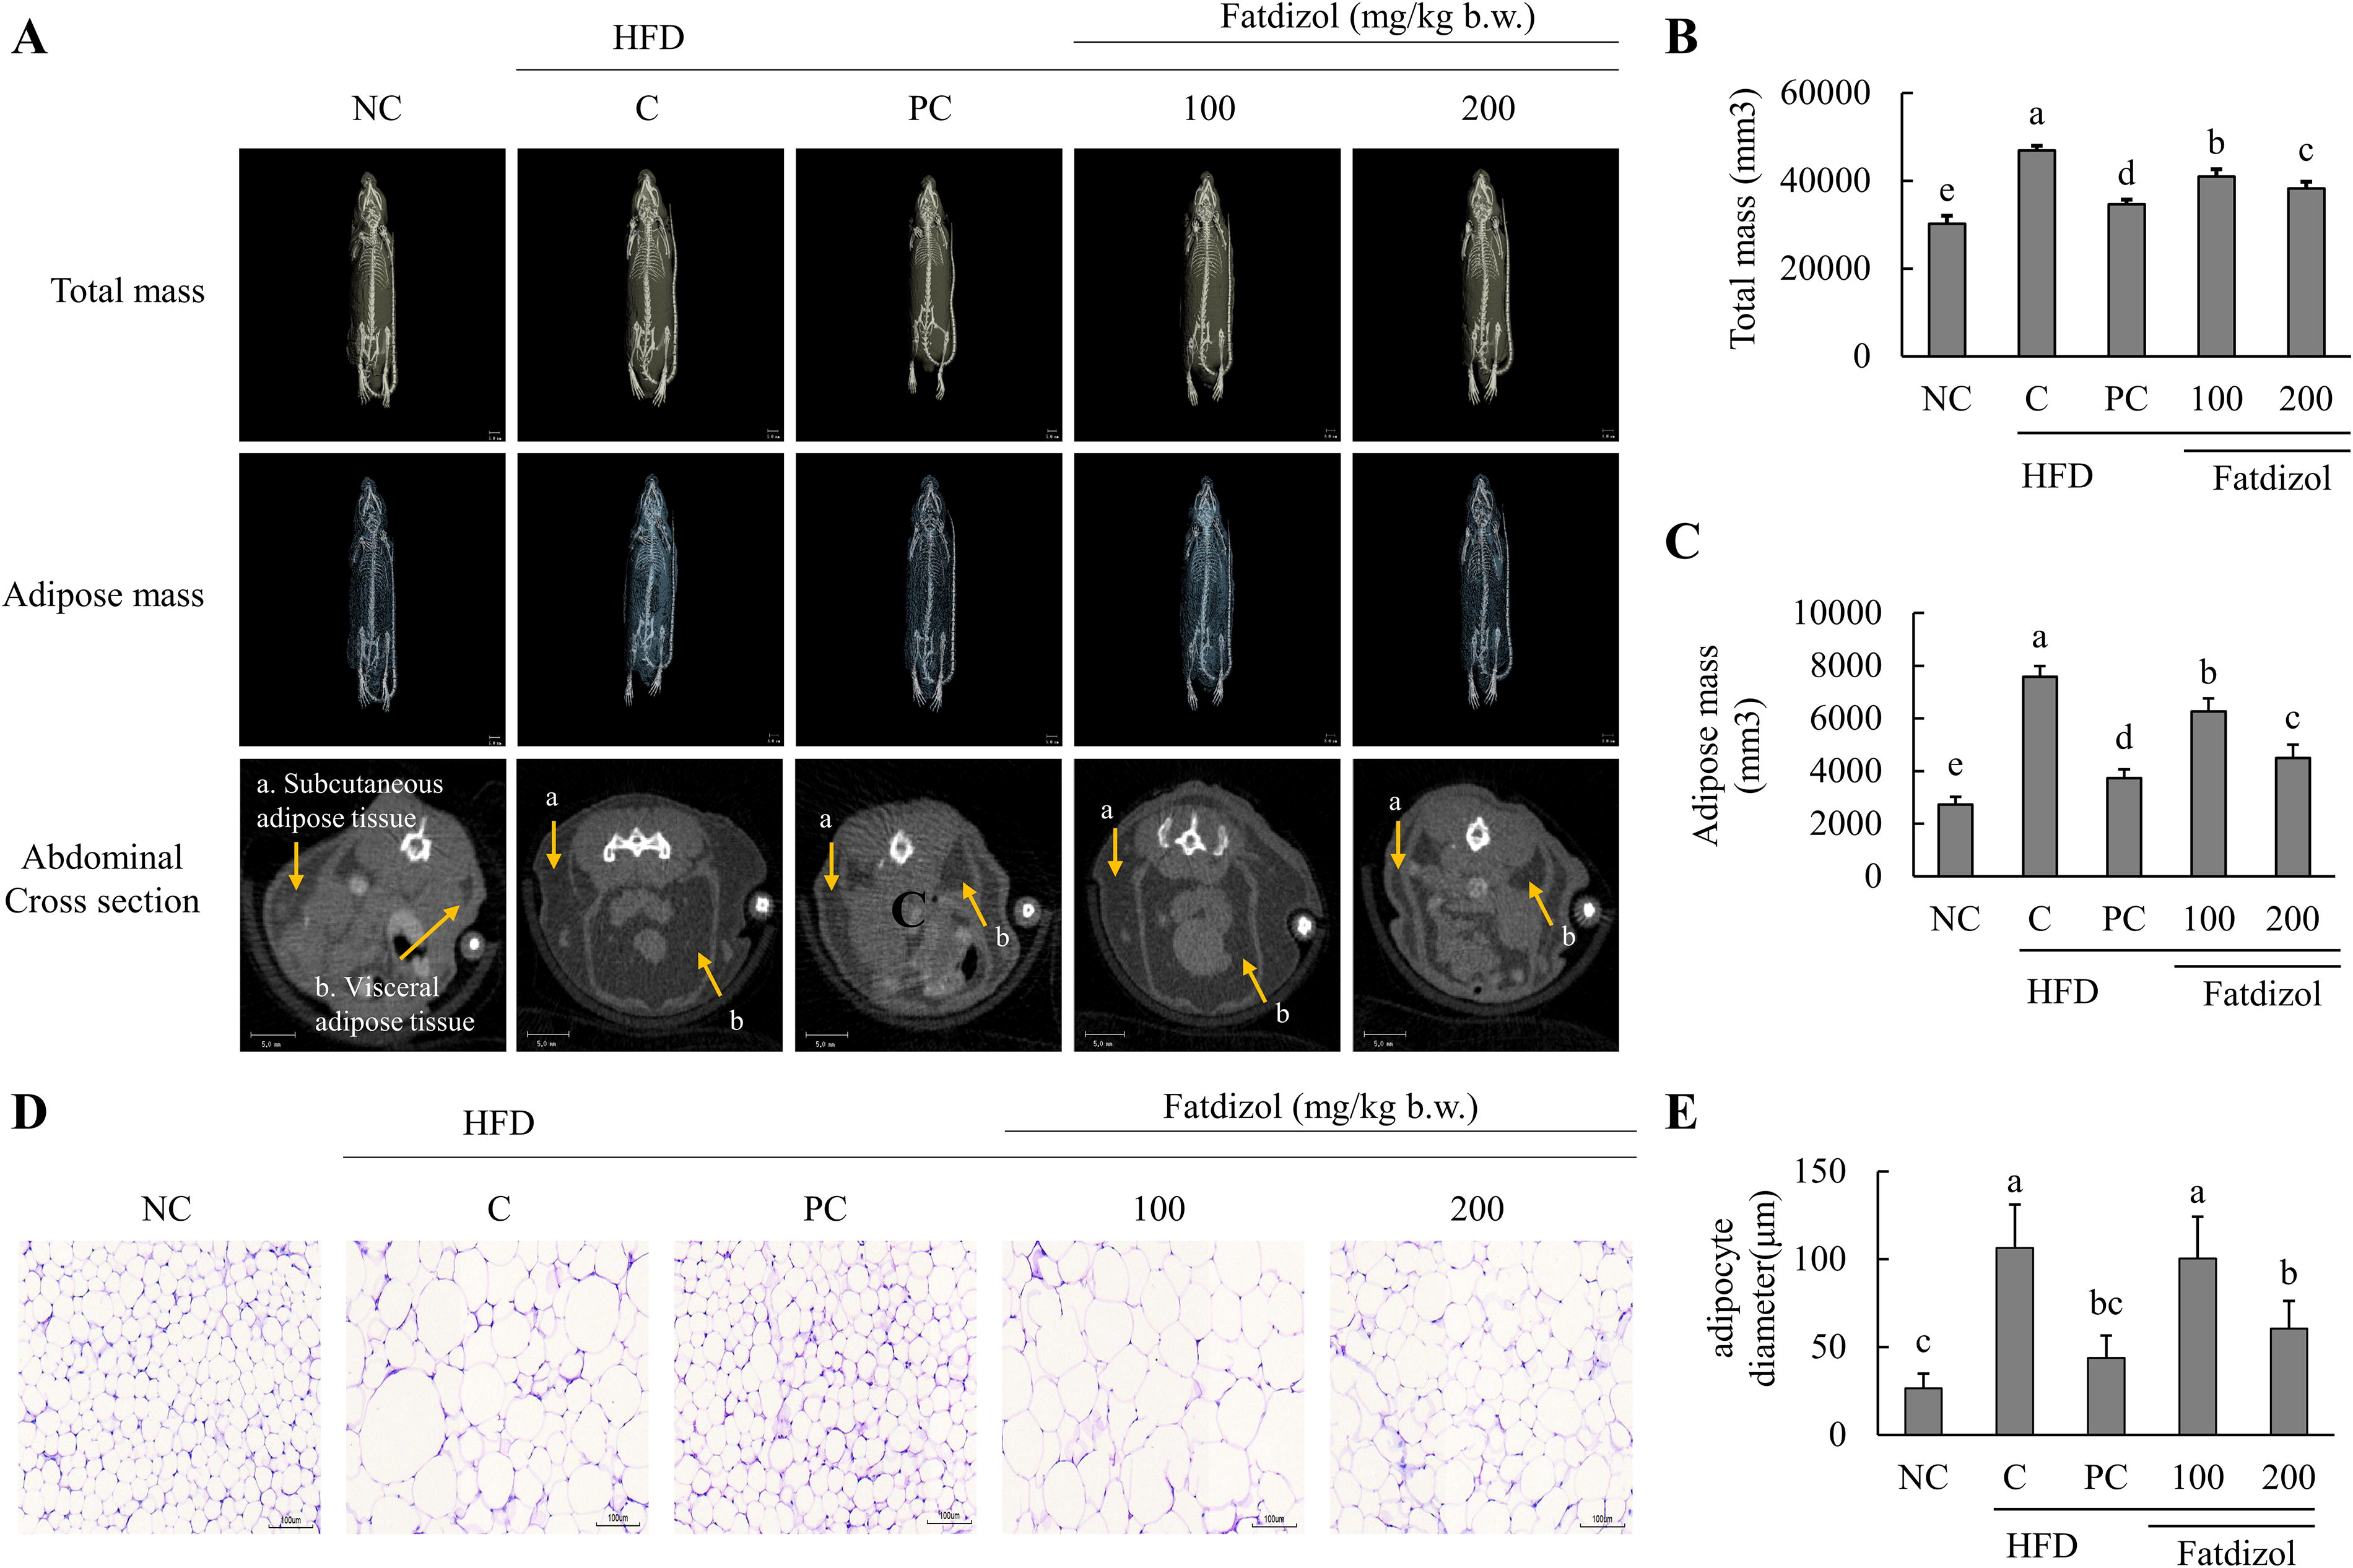
Fatdizol inhibits the total and abdominal adipose mass and lipid droplet size in WAT of HFD-induced obese C57BL/6J mice.
Fatdizol modulates Adipogenesis-Associated protein expression in WAT of obese mice
The expression patterns of proteins related to adipogenesis, lipogenesis, and lipolysis in WAT are presented in Figure 4. In the HFD-C group, the proteins associated with adipogenesis such as PPAR-γ, the p-CREB/CREB ratio, C/EBPα, SREBP1c, and leptin, were found to be significantly increased compared to the NC group. Metformin (250 mg/kg b.w.) or Fatdizol (100 and 200 mg/kg b.w.) significantly reduced these protein levels in a dose-dependent fashion relative to the HFD-C group. Conversely, the protein expression level of adiponectin was significantly reduced in the HFD-C group compared to the NC group. However, treatment with metformin (250 mg/kg b.w.) or Fatdizol (100 and 200 mg/kg b.w.) significantly and dose-dependently increased adiponectin levels when compared to the HFD-C group (Fig. 4A and B).
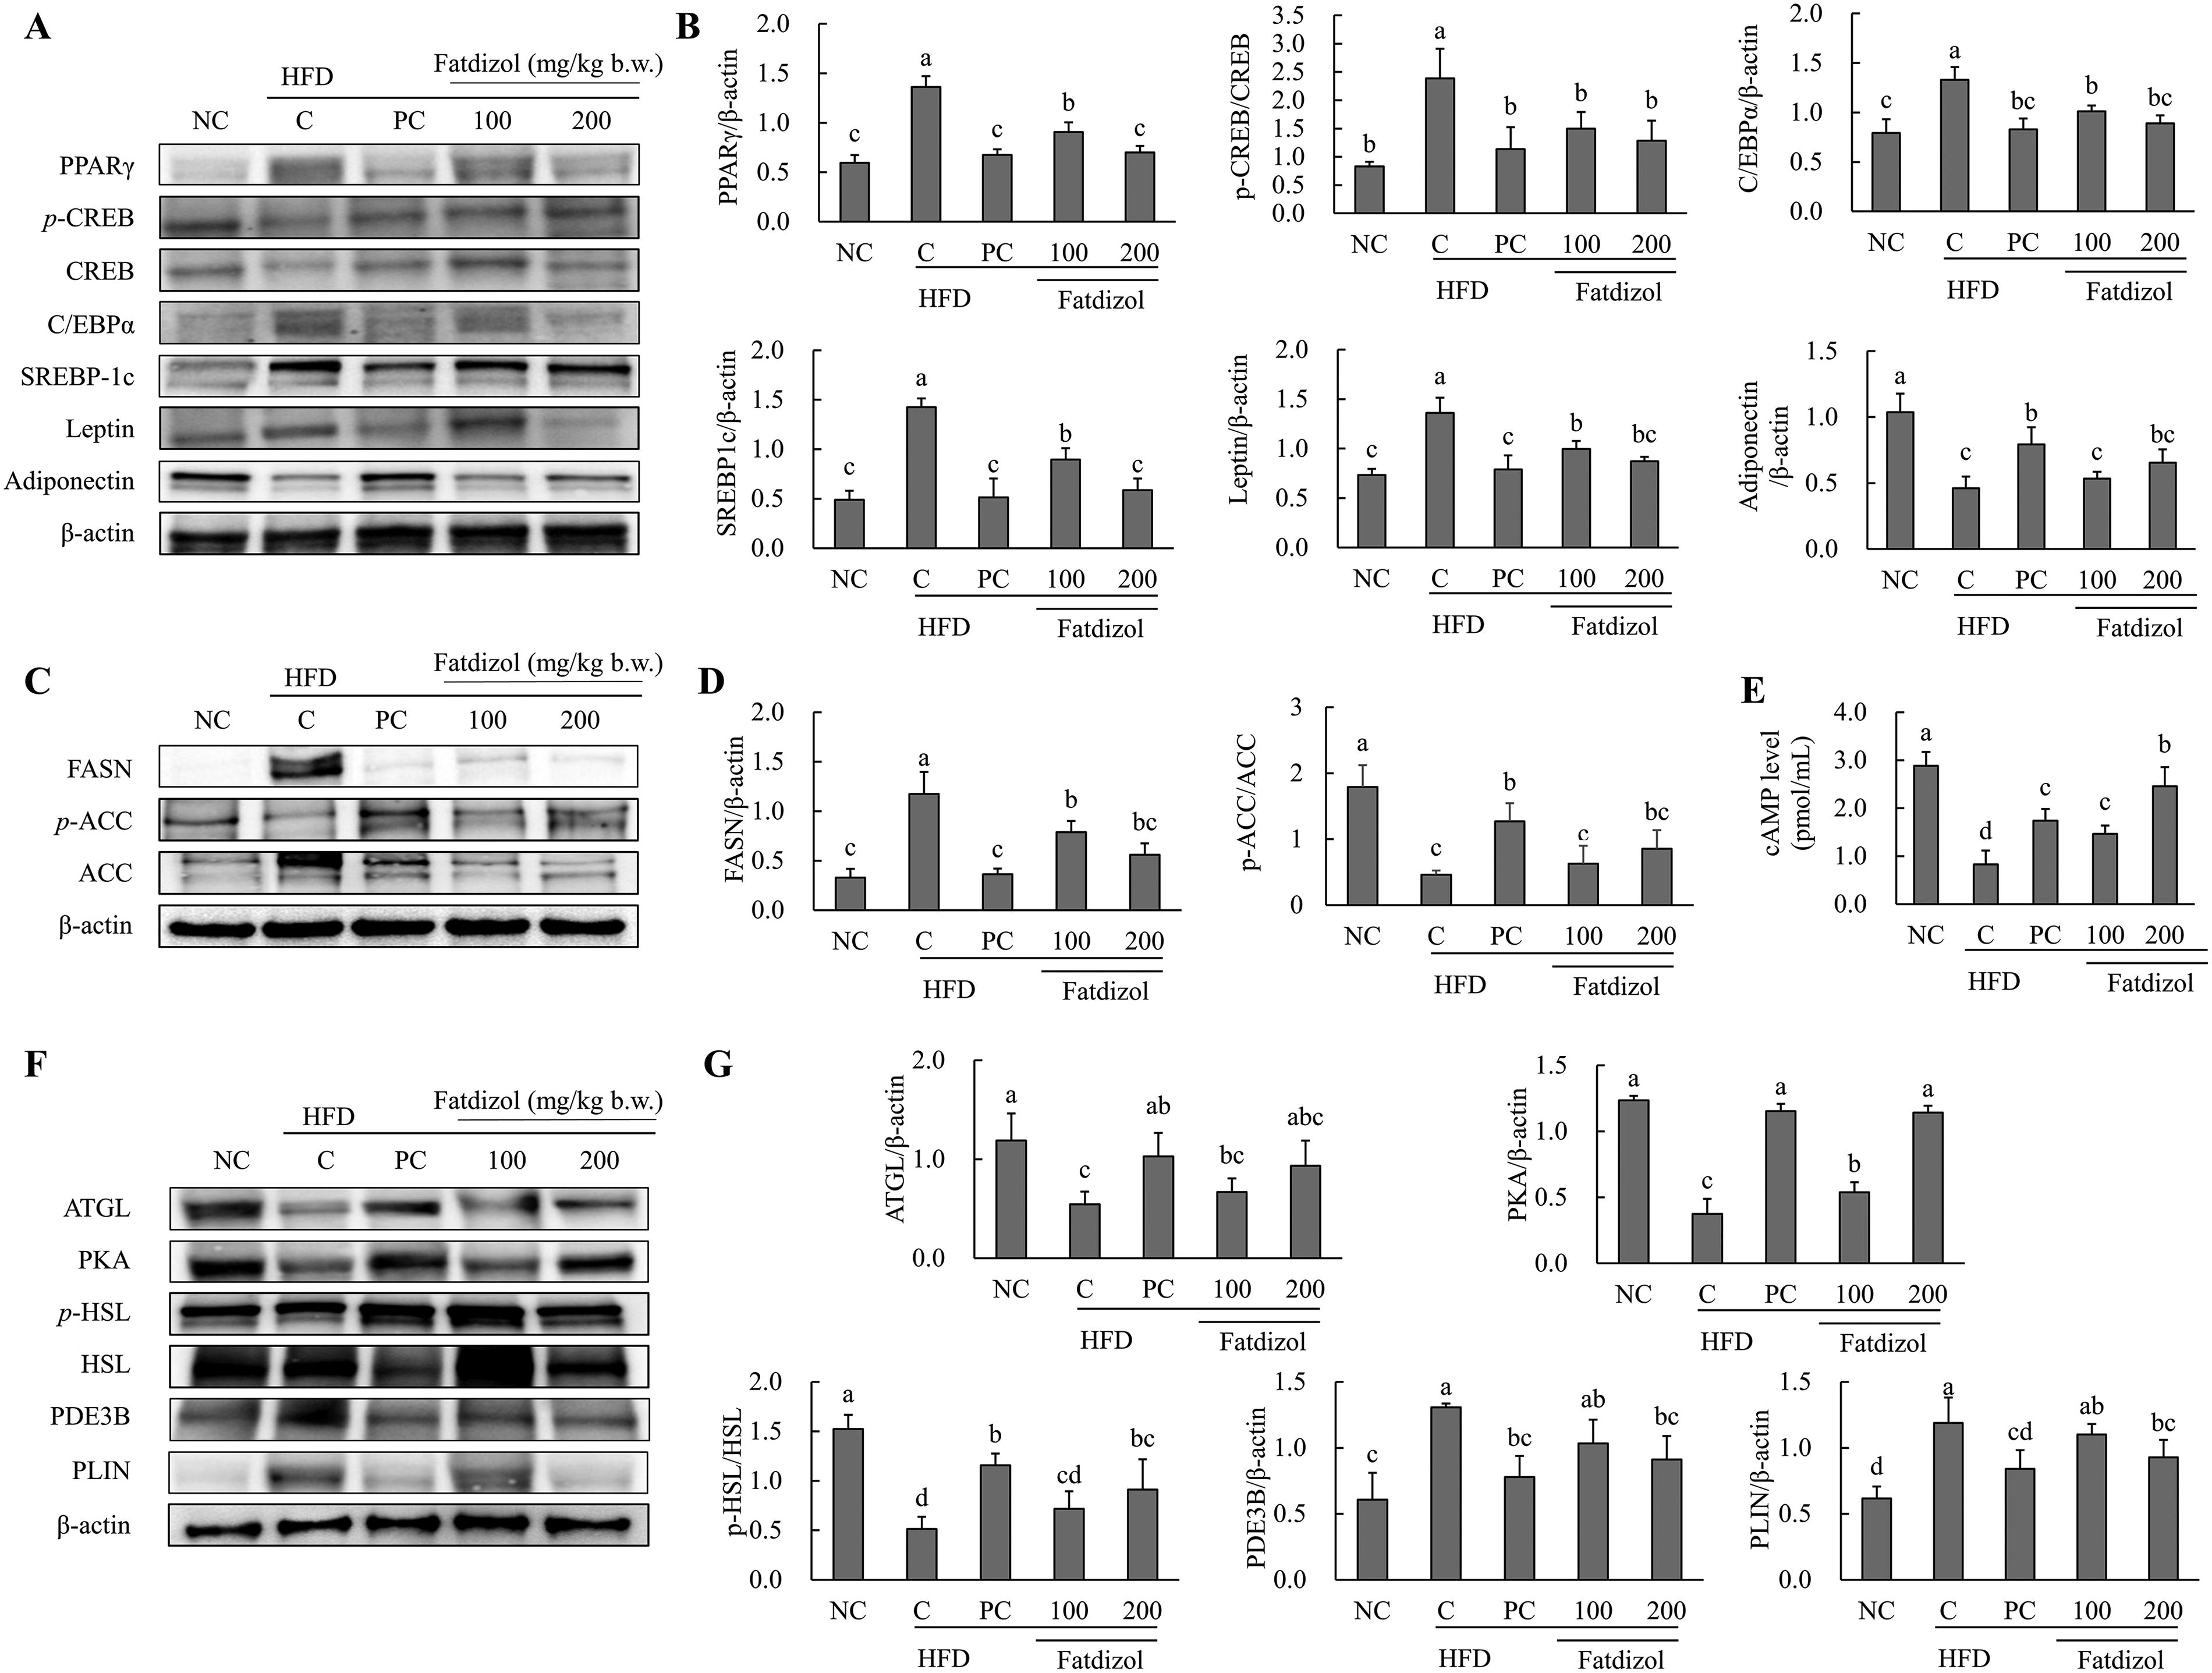
Fatdizol regulates adipogenesis-, lipogenesis-, and lipolysis-related factors in WAT of high-fat diet-induced obese C57BL/6J mice.
Fatdizol attenuates lipogenesis by regulating lipogenic markers in WAT of obese mice
The protein expression of FASN, a lipogenic marker, was notably higher in the HFD-C group than in the NC group. However, treatment with metformin (250 mg/kg b.w.) and Fatdizol (100 and 200 mg/kg b.w.) significantly and dose-dependently decreased FASN levels compared to the HFD-C group. Additionally, the ratio of p-ACC/ACC was significantly reduced in the HFD-C group relative to the NC group. Treatment with metformin (250 mg/kg b.w.) and Fatdizol (100 and 200 mg/kg b.w.) significantly increased the p-ACC/ACC ratio compared to the HFD-C group (Fig. 4C and D). Furthermore, cAMP levels were markedly lower in the HFD-C group, whereas treatments with metformin (250 mg/kg b.w.) and Fatdizol (100 and 200 mg/kg b.w.) significantly enhanced cAMP levels in relation to the HFD-C group (Fig. 4E).
Fatdizol stimulates lipolysis by upregulating lipolytic pathways in WAT of obese mice
The expressions of markers involved in lipolysis, including ATGL, PKA, and the p-HSL/HSL ratio, were significantly lower in the HFD-C group compared to the normal condition. In contrast, treatment with metformin (250 mg/kg b.w.) and Fatdizol (100 and 200 mg/kg b.w.) significantly increased these protein levels compared to the HFD-C group. In contrast, the protein levels of PDE3B and PLIN were considerably increased in the HFD-C group relative to the normal condition. However, treatment with metformin (250 mg/kg b.w.) and Fatdizol (200 mg/kg b.w.) significantly reduced the expression of these markers compared to the HFD-C group (Fig. 4F and G).
Fatdizol enhances energy Metabolism-Related protein expression in BAT of obese mice
The expressions of proteins involved in energy metabolism in BAT are presented in Figure 5. In the HFD-C group, the protein levels of key energy metabolism markers, including the p-AMPK/AMPK ratio, UCP, CPT1A, ACOX1, and PGC1α, were significantly reduced compared to the NC group. However, treatment with metformin (250 mg/kg b.w.) or Fatdizol (100 and 200 mg/kg b.w.) caused a significant rise in the expression of these proteins compared to the HFD-C group. Additionally, FABP4 protein expression was markedly higher in the HFD-C group when compared to the NC group. Treatment with metformin (250 mg/kg b.w.) and Fatdizol (100 and 200 mg/kg b.w.) resulted in a notable dose-dependent reduction in FABP4 levels when compared to the HFD-C group (Fig. 5A and B).
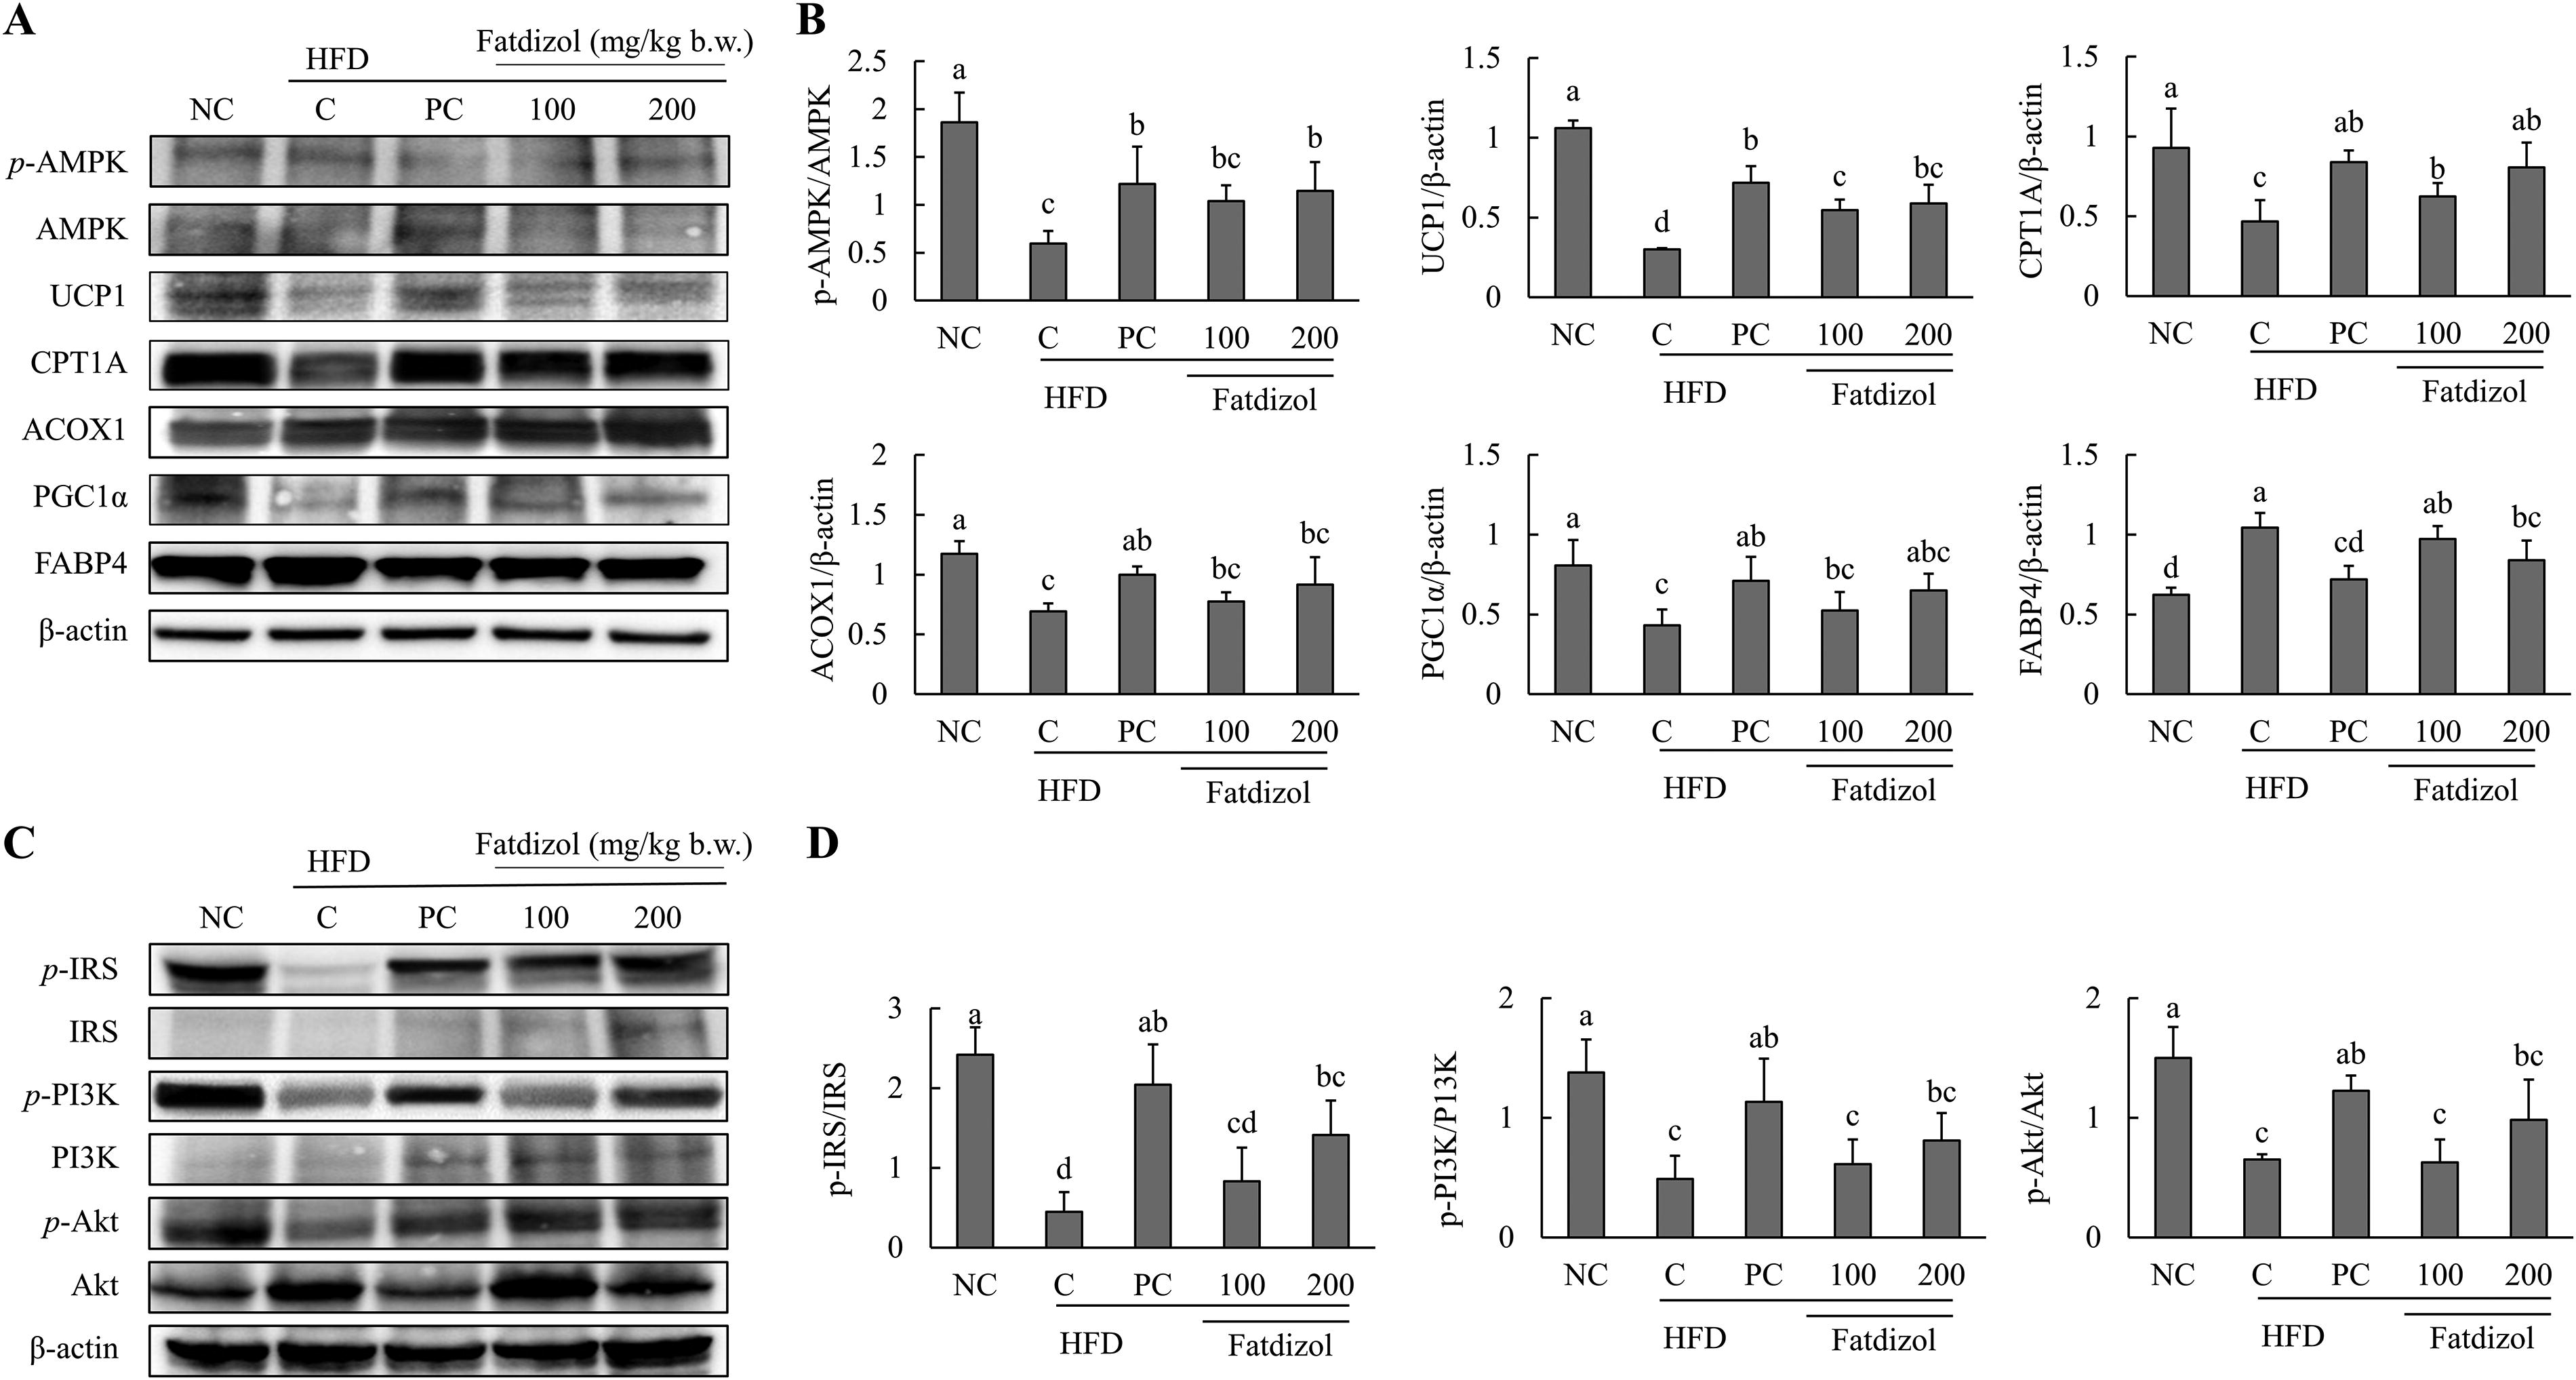
Fatdizol regulates energy metabolism and glucose uptake-related factors in high-fat diet-induced obese C57BL/6J mice.
Fatdizol improves hepatic glucose uptake by activating the PI3K/AKT pathway in obese mice
Figure 5 shows the protein expression levels of markers associated with glucose uptake in the liver of mice. In the HFD-C group, the protein levels of key glucose uptake markers, including the p-IRS/IRS ratio, the p-PI3K/PI3K ratio, and the p-Akt/Akt ratio were significantly reduced when compared to the normal condition. However, treatment with metformin (250 mg/kg b.w.) led to a notable upregulation of these proteins compared to the HFD-C group. Fatdizol (200 mg/kg b.w.) significantly increased the p-IRS/IRS ratio compared to the HFD-C group, while the p-PI3K/PI3K and p-Akt/Akt ratios showed an increasing trend without statistical significance (Fig. 5C and D).
DISCUSSION
Excessive energy accumulation in the body can lead to triglyceride (TG) deposition in both the bloodstream and organs, disrupting metabolic homeostasis and promoting obesity. 26 If this imbalance persists, it can contribute to a range of metabolic disorders, including atherosclerotic hyperlipidemia, type 2 diabetes, and hypertension. 27 –29 This underpins the growing interest in developing functional foods with potential anti-obesity effects. 30,31
Rosemary (R. officinalis L.) is widely utilized for culinary, cosmetic, and therapeutic purposes, and has recently garnered interest for its pharmacological benefits, such as reducing inflammation, managing diabetes, and combating obesity. 12,32 The active compound RMA, a key bioactive component of R. officinalis L., has also been extensively studied for its role in these therapeutic actions. 33 RMA suppresses adipogenesis by downregulating PPARγ and C/EBPα and promotes lipolysis by increasing the phosphorylation of HSL and reducing the expression of perilipin, while also attenuating inflammatory cytokine expression in adipocytes and macrophages. 34 Similarly M. alba (mulberry), a plant used for centuries in various traditional medicinal practices, has been increasingly studied for its impact on metabolic indicators related to overweight and obesity, with numerous in vitro, in vivo, and clinical studies highlighting its potential. 35,36 Of particular interest is 1-DNJ, a primary active ingredient in M. alba, which has demonstrated promising anti-obesity effects by activating the AMPK pathway, improving insulin sensitivity, and reducing body weight in diabetic and obese animal models. 37,38 While the individual anti-obesity properties of R. officinalis L. and M. alba have been well established, there remains a lack of research on their potential synergistic effects. Thus, in this study, we determined the optimal ratio of R. officinalis L. and M. alba (7:3) in the mixture, known as Fatdizol, and investigated its anti-obesity effects through both in vitro and in vivo experiments (Fig. 6).
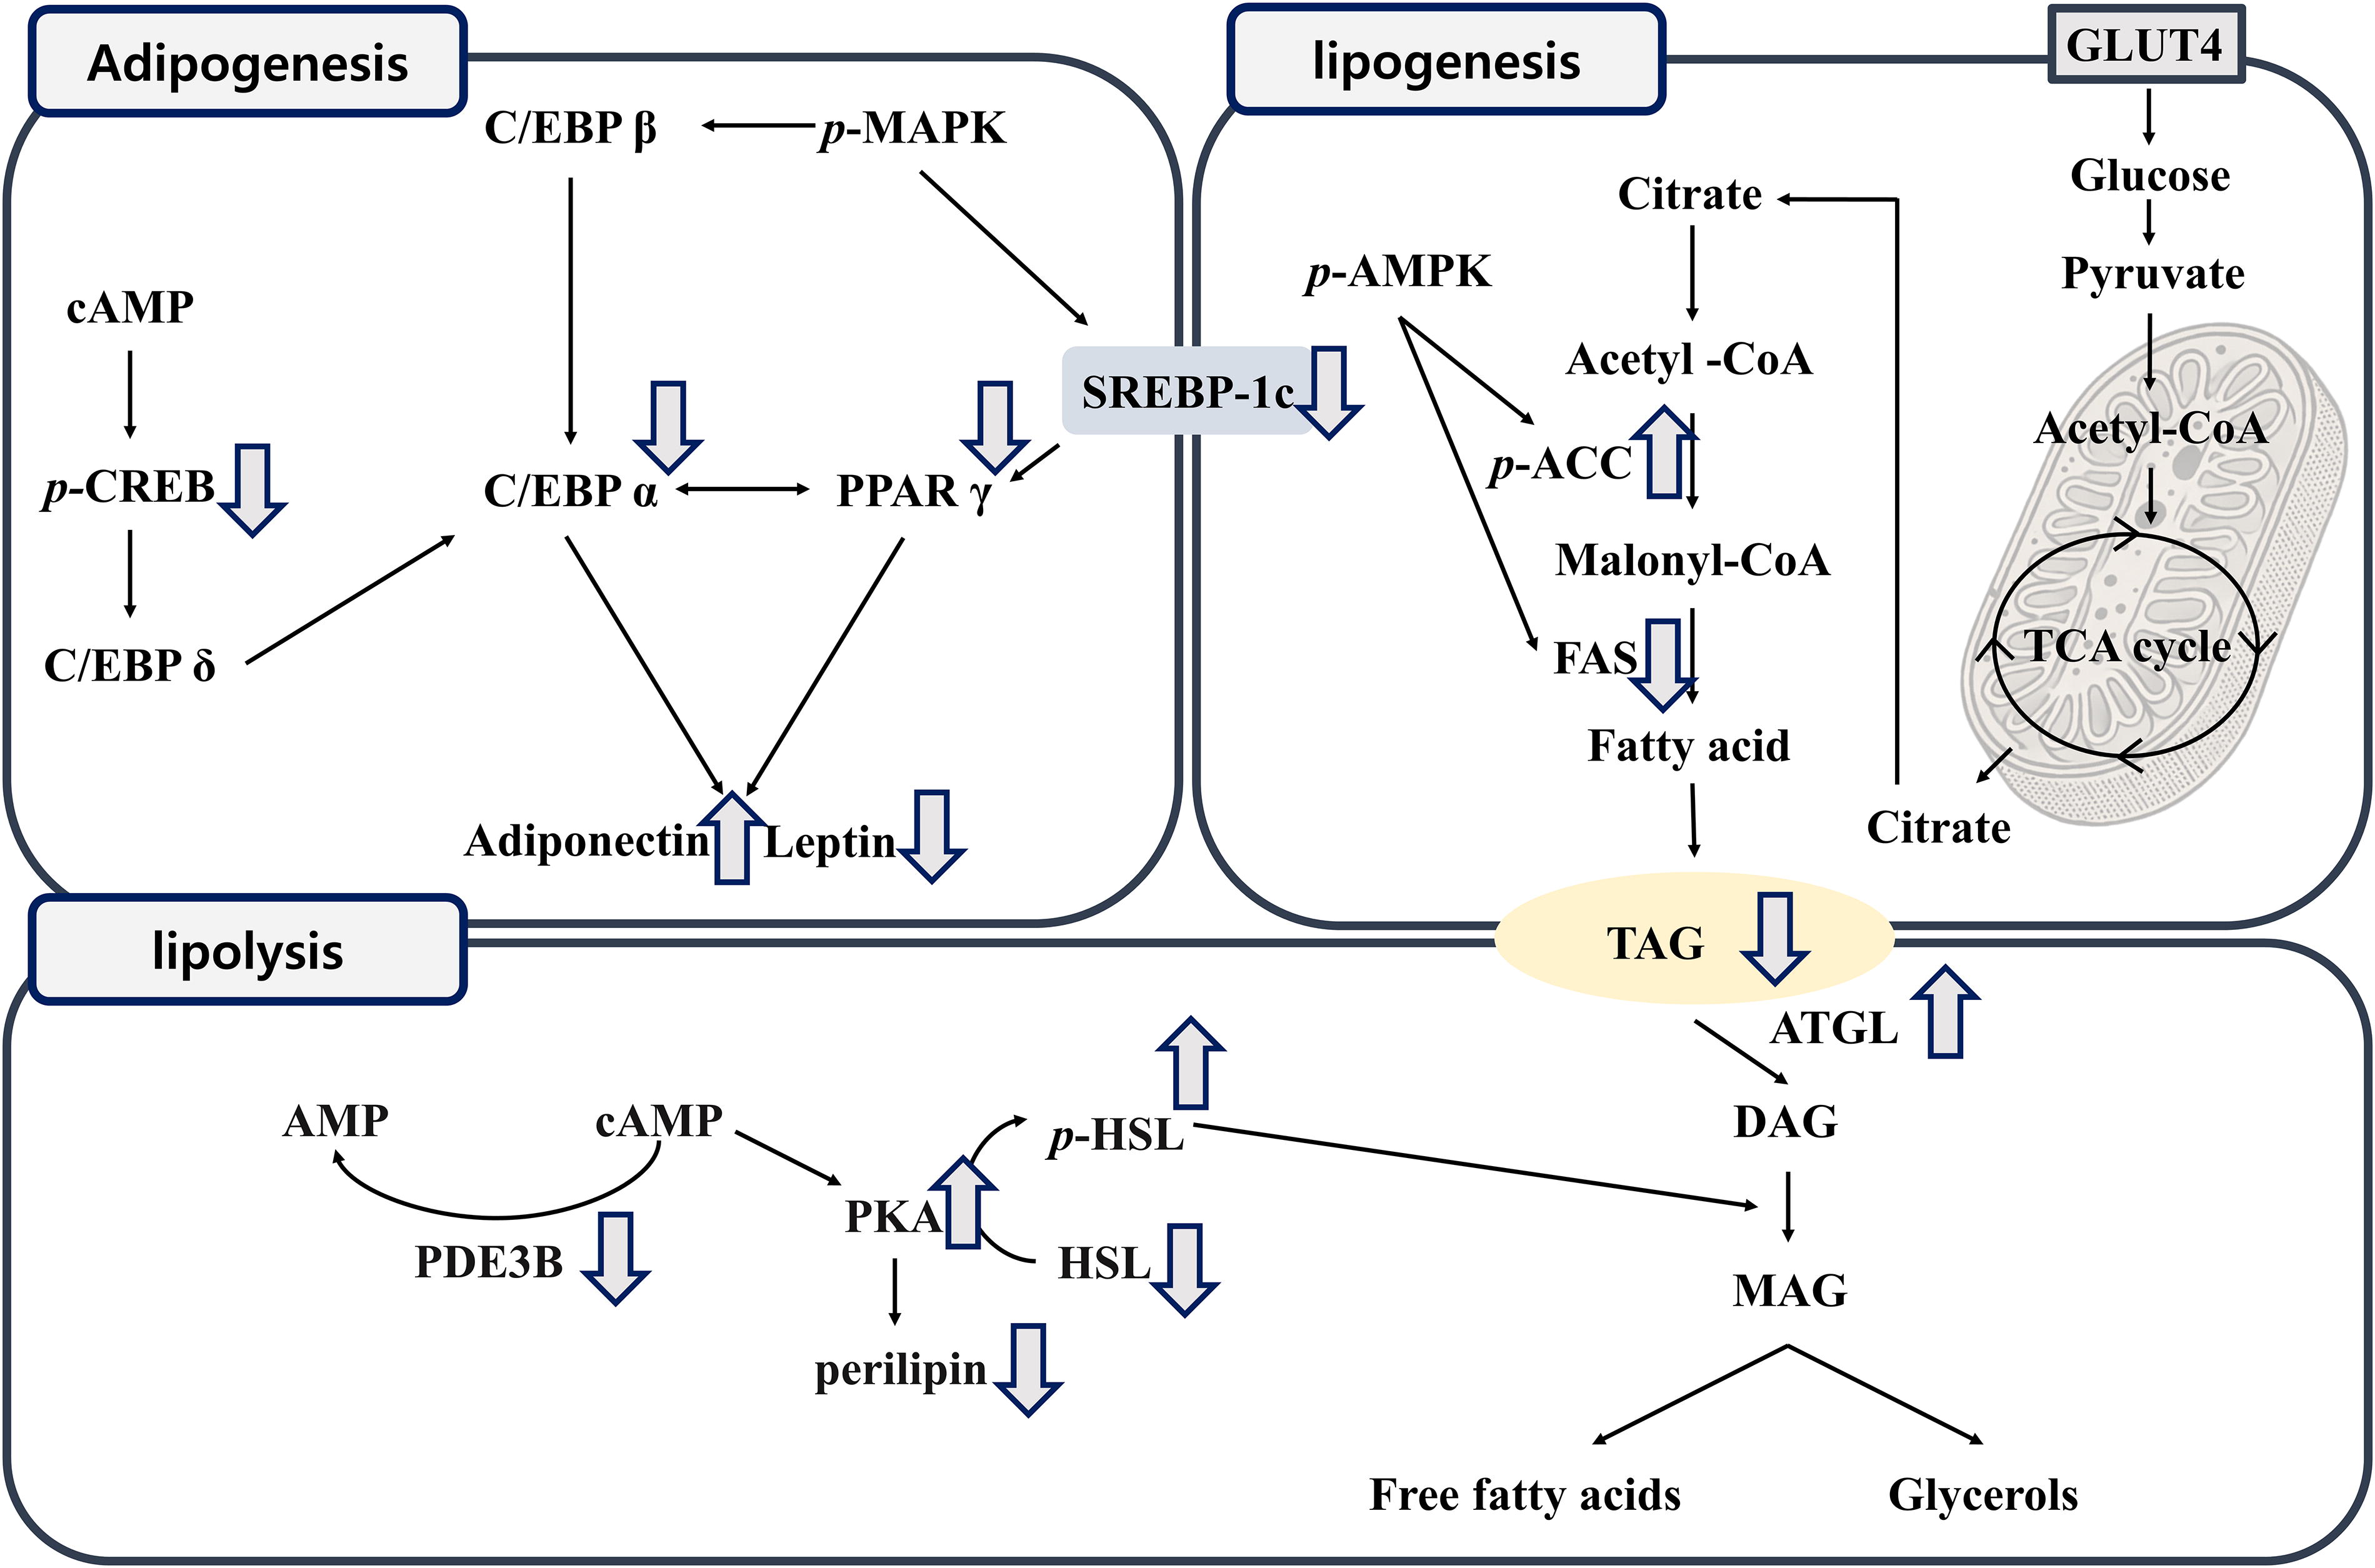
Effects of Fatdizol on adipogenesis, lipogenesis, lipolysis, and energy metabolism in high-fat diet-induced obese C57BL/6J mice. Adipogenesis is the process by which pre-adipocytes differentiate into mature adipocytes, and it is regulated by several key signaling pathways, including PPARγ, C/EBPα, cAMP, MAPK, and CREB. Lipogenesis, the metabolic process responsible for fat accumulation through the conversion of Acetyl-CoA to TG, is heavily influenced by SREBP1c, a key regulator in the Acetyl-CoA pathway. Lipolysis, the breakdown of stored TG, is regulated by enzymes such as ATGL, which catalyze the hydrolysis of TG to diacylglycerol and monoacylglycerol. Mechanistically, Fatdizol inhibited the expression of proteins involved in adipogenesis and lipogenesis, promoted lipolysis, and improved glucose metabolism.
Adipogenesis is the process by which pre-adipocytes differentiate into mature adipocytes, and it is regulated by several key signaling pathways, including cAMP, Mitogen-Activated Protein Kinase (MAPK), and CREB. These mechanisms contribute to the activation of transcription factors like PPARγ and C/EBPα, which are essential for adipocyte differentiation. The early-stage transcription factors C/EBPβ and C/EBPδ play pivotal roles in regulating PPARγ and C/EBPα expression, thereby driving adipogenesis. 39 In this study, TG levels and the expression of key regulatory proteins were significantly elevated in the differentiated control adipocytes, but Fatdizol notably reduced both TG accumulation and the expression of these transcription factors compared to the differentiation-only group. Furthermore, in WAT collected from HFD-fed obese mice, the expression of these transcription factors was markedly increased. However, administration of Fatdizol significantly suppressed their expression, thereby inhibiting adipogenesis. These findings suggest that Fatdizol effectively attenuates adipocytes differentiation both in vitro and in vivo.
Lipogenesis, the metabolic process responsible for fat accumulation through the conversion of Acetyl-CoA to TG, is heavily influenced by SREBP1c, a key regulator in the Acetyl-CoA pathway. During lipogenesis, several changes in metabolic pathways occur, including increased activity of G6PDH and citrate synthase, altered insulin signaling, and the upregulation of ACC and ACL, which collectively contribute to elevated FAS and FA levels, resulting in enhanced TG synthesis. 40 In this study, the Fatdizol-treated groups significantly reduced the protein expression of SREBP1c, FASN, and ACC, which were markedly elevated in both the differentiated control adipocytes and the obesity model induced by HFD feeding.
Lipolysis, the breakdown of stored TG, is regulated by enzymes such as ATGL, which catalyze the hydrolysis of TG to diacylglycerol and monoacylglycerol. 41 The cAMP-PKA pathway is a major regulator of lipolysis and is controlled by PDE3B, an enzyme mainly localized in insulin-sensitive tissues such as adipocytes, hepatocytes, and pancreatic β-cells. 42 PDE3B modulates the cAMP/PKA-mediated signaling activity, which influences the phosphorylation of HSL and the breakdown of lipids. 43 Our findings demonstrated that HFD-induced obese mice exhibited reduced protein expression of ATGL and cAMP levels, diminished HSL phosphorylation and lower PKA protein expression. Conversely, protein expression of PDE3B and perilipin were elevated, suggesting impaired lipolysis. Moreover, Fatdizol treatment notably elevated the protein levels of cAMP and ATGL in HFD-induced obese mice, while also promoting increased phosphorylation of HSL and upregulation of PKA expression. In contrast, treatment with Fatdizol resulted in a significant decrease in the protein levels of PDE3B and perilipin in HFD-induced obese mice.
Energy metabolism is intimately linked to fat accumulation, with the BAT playing a key role in regulating energy balance through FA oxidation. The activation of AMPK, triggered by an AMP/ATP imbalance, inactivates ACC and stimulates FA oxidation. 44 This process is crucial for thermogenesis, which involves the upregulation of UCP1 and CPT1A. 45 In this study, BAT from HFD-induced obese mice display reduced AMPK activity, along with reduced levels of UCP1, CPT1A, ACOX1, and PGC1α, indicating a compromised energy-regulating mechanism. Additionally, we observed increased FABP4 expression, a marker of lipid accumulation, further supporting the link between fat accumulation and disrupted energy metabolism. In this model, treatment with Fatdizol significantly influenced the expression of energy-regulating proteins in HFD-induced obese mice.
The liver serves a critical role in glucose regulation by lowering blood glucose levels after meals and producing glucose via gluconeogenesis and glycogenolysis during fasting. 46 However, dysregulated hepatic glucose metabolism is a hallmark of diabetes, characterized by hyperactivation of glucose production pathways that elevate blood glucose levels and exacerbate hepatic insulin resistance. 47 Insulin binding to its receptor (IR) typically enhances IRS-1/−2 expression and activates the phosphatidylinositol 3-kinase/protein kinase B (PI3K/AKT) pathway, leading to the suppression of gluconeogenesis-related genes, including G6Pase and PEPCK. PI3K functions as a key secondary messenger in cellular signaling and consists of a regulatory subunit (p85) and a catalytic subunit (p110); disruptions in the balance of these subunits can induce insulin resistance. 48 In this study, the obese state exerted a significant inhibitory impact on the PI3K/AKT signaling pathway in mice with HFD-induced obesity compared to the normal controls, but treatment with Fatdizol elevated the PI3K/AKT signaling pathway.
Additionally, our study found reduced circulating GLP-1 concentrations in these mice, consistent with findings from some previous studies on metabolic dysfunction. These changes collectively reflect impaired glucose homeostasis and pancreatic endocrine dysfunction. 49 Administration of Fatdizol improved these metabolic parameters by decreasing blood glucose and insulin levels while enhancing GLP-1 secretion. Collectively, these results suggest that Fatdizol may improve glucose metabolism not only through regulation of hepatic metabolism but also through modulation of incretin hormone secretion and restoration of insulin signaling pathways, indicating its potential value as a candidate treatment for metabolic syndrome.
The administration of Fatdizol resulted in a notable decrease in blood lipid levels and an increase in TG and TC levels in the feces. These findings suggest that Fatdizol facilitates the excretion of these lipids by inhibiting their absorption in the gastrointestinal tract. This hypothesis is further corroborated by the observed reduction in body weight, fat mass, and lipid droplet size, underscoring the anti-obesity efficacy of Fatdizol.
The study provides strong evidence for the anti-obesity effects of Fatdizol, but there are limitations. While the 60% high-fat diet-induced obesity model is commonly used, it does not fully represent insulin resistance, so further research using models like ob/ob or db/db mice is necessary to better understand the effects of Fatdizol on glucose metabolism. Finally, although the study focuses on in vitro and in vivo experiments, further clinical research is needed to confirm the potential of Fatdizol as a functional anti-obesity agent. Overcoming these limitations in future research will improve insights into its underlying mechanisms and potential applications.
In conclusion, our study provides compelling evidence that the combination of R. officinalis L. and M. alba exerts notable anti-obesity effects in both in vitro and in vivo models by reducing lipid accumulation, modulating lipid metabolism, and improving glucose metabolism. While the individual anti-obesity properties of R. officinalis L. and M. alba have been documented in previous studies, 50 –53 this research is the first to demonstrate the synergistic effects of these two compounds in differentiated adipocytes and in an HFD-induced obesity murine model.
The observed effects of Fatdizo are likely attributable to the active compounds RMA and 1-DNJ, which have well-documented efficacies. Specifically, RMA regulates lipid metabolism by inhibiting key adipogenic markers such as SREBP1c and FASN, while promoting the activation of AMPK, ich facilitates lipid breakdown. 54 On the other hand, 1-DNJ enhances glucose homeostasis modulation through the PI3K/AKT signaling cascade and improves insulin sensitivity. 55 Together, these two bioactive compounds create a synergistic effect that addresses both lipid and glucose metabolism, providing a promising strategy for obesity prevention. Our findings not only support the potential of R. officinalis L. and M. alba as functional ingredients in the development of anti-obesity interventions but also reconcile the differences between in vitro and in vivo evidence, offering new perspectives for future research in obesity management.
Footnotes
AUTHOR DISCLOSURE STATEMENT
No competing financial interests exist.
AUTHORS' CONTRIBUTIONS
J.K.: Writing—original draft (lead), Data curation (lead); Validation (lead); Y.L.: Writing—review & editing (equal); Formal analysis (lead), Validation (equal); S.-H.P.: Formal analysis (lead); Methodology (lead); Writing—review & editing (equal); Y.J.: Formal analysis (supporting); Software (lead); Writing—review & editing (equal); J.P.: Visualization (lead); Writing—review & editing (equal); J.L.: Investigation (lead); Formal analysis (supporting); S.-J.P.: Conceptualization (supporting); Writing—original draft (lead); Visualization (lead); Supervision (lead); Y.K.: Conceptualization (lead); Writing—review & editing (lead).
FUNDING INFORMATION
No funding was received for this article.