




Abstract
Abstract
Purpose:
In this report, we characterize the in vitro pharmacokinetic properties of a new antihistamine, alcaftadine. In addition, we report results from phase 1 studies of several ophthalmic formulations of alcaftadine and examine the pharmacokinetic properties of one formulation in detail.
Methods:
In vitro pharmacology employed a human liver microsome assay combined with index substrates or inhibitors for specific cytochromes. Metabolic fate of 14C-alcaftadine was determined by high-performance liquid chromatography–based separation of parent compound from metabolites. Plasma protein binding was determined by equilibrium dialysis using 3H-labeled alcaftadine and 3H-labeled alcaftadine carboxylic acid metabolite. Relative tolerability (comfort) of 4 concentrations and 3 formulations of alcaftadine ophthalmic solution was assessed in 2 double-masked, randomized, placebo-controlled, contralateral studies in which formulations were compared to Tears Naturale II (placebo) in normal adult subjects. Data analysis focused on the mean differences in subject-reported drop comfort scores (within each dose level, at each time point) and compared the study-treatment eye with the placebo eye. Pharmacokinetics of alcaftadine 0.25% ophthalmic solution were determined in an open-label, single-center study after a single bilateral dose and after 7 days of once-a-day bilateral doses in healthy subjects 18–55 years old.
Results:
Alcaftadine is not significantly metabolized by microsomal cytochromes, but it is rapidly converted to the carboxylic acid metabolite by one or more cytosolic enzymes. Neither the parent compound nor its carboxylic acid metabolite displayed significant plasma protein binding. Over a range of formulations and concentrations (0.05%–0.5%), alcaftadine was well tolerated and subjects reported little or no discomfort or taste perversion in any treatment group. Pharmacokinetic studies showed that both the parent compound and the carboxylic acid metabolite reach peak serum levels within minutes of administration and fall below detectable levels within 3 h of dosing.
Conclusions:
Based upon pharmacokinetic and phase 1 studies, the novel antihistamine alcaftadine is an appropriate drug for use as an ophthalmic formulation for prevention and treatment of ocular allergic conditions such as allergic conjunctivitis (alcaftadine ophthalmic solution 0.25% was recently approved for use by the FDA). Topical administration of alcaftadine 0.25% ophthalmic solution was well tolerated and had an acceptable safety profile.
Introduction
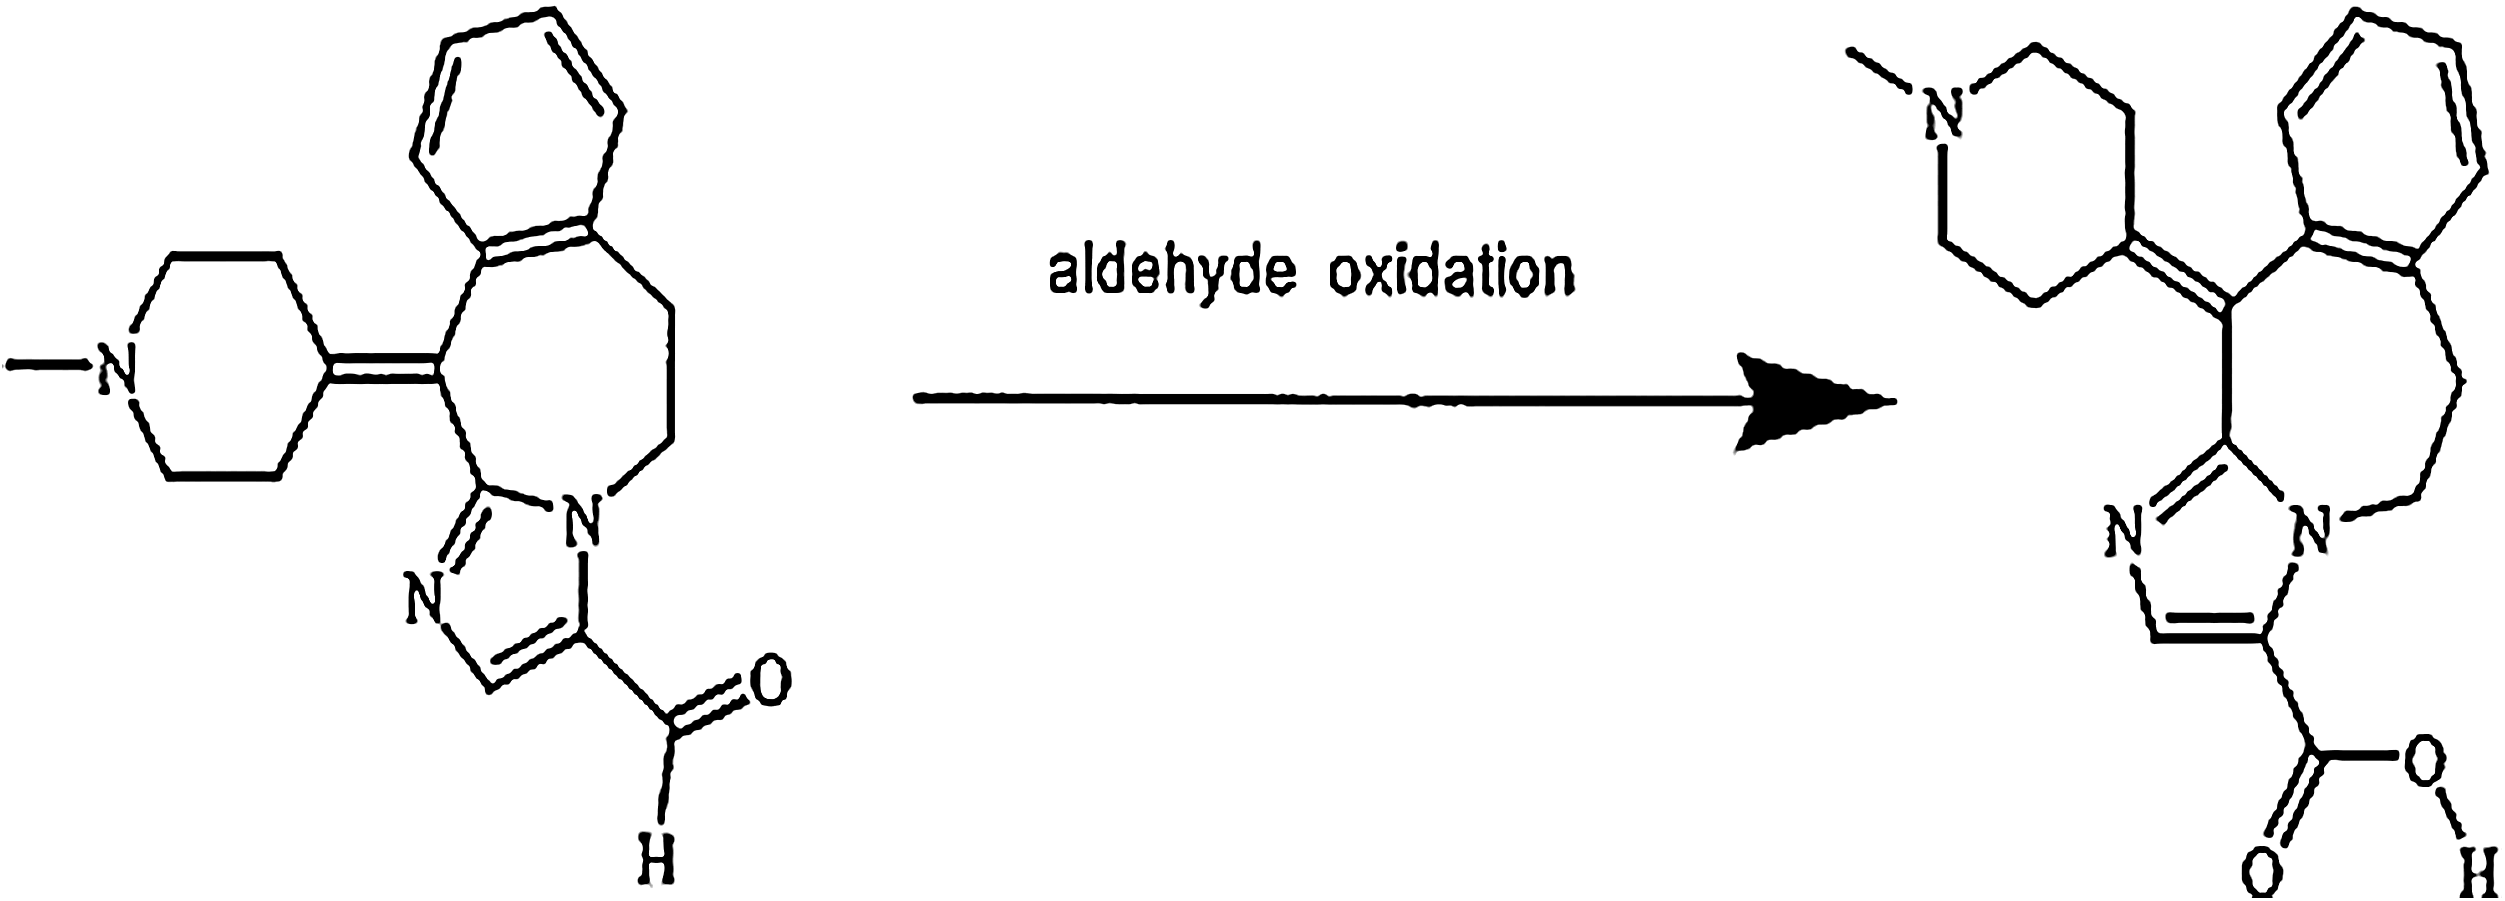
Structure of alcaftadine and its primary metabolic product. The empirical formula for alcaftadine is C19H21N3O and its chemical name is 6,11- dihydro-11-(l-methyl-4-piperidinylidene)-5H-imidazo [2,1-b] [3] benzazepine-3-carboxaldehyde (CAS No. 147084-10-4). The structure shown here (left) was established by single crystal X-ray diffraction structure analysis and confirmed by multiple analytic methods (infrared spectroscopy, 1H-nuclear magnetic resonance spectroscopy, 13C-nuclear magnetic resonance spectroscopy, ultraviolet, and liquid chromatography–mass spectroscopy). The aldehyde is converted to a carboxylic acid in vivo to form the primary metabolite shown on the right.
Preliminary studies of the pharmacokinetics and safety of oral preparations of alcaftadine tested both single-dose and multiple-doses ranging from 0.05 to 8 mg (Groen, 1996). These studies suggested that the drug was well tolerated over this range. They also led to the identification of a major carboxylic acid metabolite of alcaftadine (Fig. 1), which displays significant antihistamine activity in the in vivo assays used to test alcaftadine.
Receptor binding studies were conducted to test alcaftadine affinity for histamine receptors and other clinically relevant binding sites (Gallois and Thurmond, in preparation). Alcaftadine displays high affinity for the H1 and H2 histamine receptors [inhibitory dissociation constant (Ki) of 3.1 and 58 nM, respectively] and a lower affinity for H4 receptors (Ki 2.9 μM). Alcaftadine also displays a moderate affinity for the cholinergic muscarinic receptors measured in rat striatum (Ki 1.1 μM). It exhibits a lower affinity for several other receptor subtypes (Ki > 10 μM), including human α2A adrenergic receptors, human 5HT1A, human 5-HT2A, pig 5-HT2C, guinea pig 5-HT4, and the human melanocortin MC4 receptors. Displacement experiments also show that at concentrations up to 10 μM, alcaftadine did not interact with other any receptor, transporter, or ion channel binding site (including the h-ERG channel). The in vivo pharmacology, together with receptor binding data, demonstrates that alcaftadine is a potent and specific ligand for histamine H1 and H2 receptors.
Based upon its pharmacological profile, alcaftadine was a candidate compound for use in ophthalmic preparations as a therapy for allergic conjunctivitis (alcaftadine ophthalmic solution 0.25% was recently approved for use by the FDA). Given the bioactivity of the carboxylic acid metabolite, a more extensive characterization of the metabolism of alcaftadine was conducted using an in vitro system of human liver microsomes and diagnostic cytochrome P450 (CYP) substrates. In vitro human plasma protein binding and red blood cell distribution of alcaftadine and the acid metabolite were also evaluated. In addition, results from phase 1 clinical studies conducted to support selection of the optimal ophthalmic formulation of alcaftadine are presented. The first 2 of these studies assessed the tolerability of several different formulations and concentrations of alcaftadine, whereas the third evaluated the pharmacokinetics of alcaftadine and its acid metabolite after ocular administration of a 0.25% formulation of alcaftadine.
Methods
Biotransformation of alcaftadine in vitro
Human liver microsomes were prepared as described according to standard protocols 5 and stored at −75°C before use. Metabolism experiments were done with alcaftadine 14 C-labeled in the benzylic bridgehead carbon (in the tricyclic system). Assay mixture of 1 mL contained microsomes (0.75 mg protein), 14 C-alcaftadine (5 μM; specific activity, 590 MBq/mmol), glucose-6-phosphate (0.25 mg), glucose-6-phosphate dehydrogenase (0.125 U), NADP (0.062 mg), MgCl2 · 6H2O (0.25 mg), and phosphate buffer (0.25 M, pH 7.4). After incubation, 14 C-alcaftadine was separated from metabolites by high-performance liquid chromatography. Radioactivity was detected in duplicate aliquots of reaction mixtures using a Berthold Radioactivity Monitor (Berthold Technologies U.S.A., Oak Ridge, TN) equipped with a flow-through cell. The extent of metabolic transformation was expressed as a percentage of total 14 C-alcaftadine.
Identifying CYPs involved in alcaftadine metabolism
To identify microsomal enzymes involved in metabolism of alcaftadine, reactions were conducted in the presence of a series of compounds known to interfere with specific CYPs. 6 The inhibitors used were as follows: 7,8-benzoflavone (CYP1A2), phenacetin (CYP1A2), furafylline (CYP1A2), coumarin (CYP2A6), tolbutamide (CYP2C8/9/10), phenytoin (CYP2C8/9/10), sulfaphenazole (CYP2C8), mephenytoin (CYP2C19), quinidine (CYP2D6), p-nitrophenol (CYP2E1), aniline (CYP2El), gestodene (CYP3A4), and troleandomycin (CYP3A4). The nomenclature of the CYP families classifies each into super families (the first number) families (letter) and isoform (second number). 7 Microsomal samples were preincubated with inhibitors 5 min before addition of cofactor mixture or 14 C-alcaftadine to initiate the assay. Incubates with troleandomycin were preincubated with an NADPH-generating system for 10 min at 37°C, before addition of 14 C-alcaftadine.
Assessment of alcaftadine effects on CYP activity
Potential effects of alcaftadine or alcaftadine acid metabolite on CYP activity were tested using the microsomal assay in the presence of varying alcaftadine concentrations. Microsomes (with or without added alcaftadine) were incubated with substrates for specific CYP isoforms as follows (references describe protocols to measure biotransformation for each substrate): caffeine 8 (CYP1A2), coumarin 9 (CYP2A6), cyclosporine A 10 (CYP3A4), chlorzoxazone 11 (CYP2E1), testosterone 12 (CYP3A4), phenytoin 13 (CYP2C8/9/10/11), tolbutamide 14 (CYP2C8/9/10), debrisoquine 15 (CYP2D6), and lauric acid 16 (CYP4A). Data were expressed as percent inhibition of reactions listed (Table 2) by maximal concentrations of alcaftadine (100 ng/mL) or alcaftadine acid metabolite (1,000 ng/mL).
Plasma protein binding and distribution of alcaftadine and its acid metabolite in blood
The plasma protein binding of 3 H-alcaftadine and of its 3 H-acid metabolite (both were tri-tritiated at the N-methyl function) were studied by equilibrium dialysis of plasma samples from male healthy adults, male beagle dogs, male and female Wistar rats, female Cunistar-MDL rabbits, and male Swiss mice. The distribution of alcaftadine and the acid metabolite between plasma and red blood cells was also determined.
The drug solutions of 3 H-alcaftadine were prepared in ethanol and the solutions of 3 H-acid metabolite were prepared in deionized water, both at total (i.e., radio-labeled plus unlabeled drug) concentrations 200 times higher than those to be achieved in blood, plasma, or protein solutions. Plasma was prepared by centrifugation of blood at 1,700 g for 10 min at room temperature. Drug stock solutions were added (5 μL 3 H-alcaftadine or 3 H-acid metabolite) to 1 mL of either plasma or whole blood before dialysis.
For equilibrium dialysis, sample cells were mounted in a Dianorm system (a total of 20 identical macro-1 Teflon cells) and rotated at 20 rpm in a Heto thermostat bath at 37°C. Duplicate samples were dialyzed against a 0.067 M Sörensen phosphate buffer pH 7.17, resulting in a final pH of 7.4 in the plasma compartment at the end of the dialysis. The protein binding of alcaftadine and of the acid metabolite were determined in individual human plasma samples and in individual or pooled plasma samples from animals.
Tissues used for in vitro studies were obtained following the guidelines in the ARVO Statement for the use of animals in ophthalmic and vision research.
Relative tolerability of alcaftadine ophthalmic solutions (comfort study)
A single-center, double-masked, randomized, placebo-controlled, contralateral study was conducted to evaluate the relative safety and comfort of 4 concentrations of alcaftadine ophthalmic solution compared to Tears Naturale II (placebo) in male and female subjects 18–50 years old with normal ocular health. Equal numbers of subjects were randomly assigned to receive a single drop of 1 of 4 concentrations of alcaftadine (0.05%, 0.1%, 0.25%, and 0.5%) in 1 eye and a single drop of placebo in the contralateral eye. Drop comfort, taste perversion, and safety assessments [adverse events (AEs) and ophthalmic examinations] were performed after drop instillation.
Subjects reported drop comfort ratings on a numeric scale, ranging from 0 (very comfortable) to 10 (very uncomfortable), immediately after drop instillation and at 30 s, 1, 2, 5, and 10 min after instillation. Drop comfort descriptors (comfortable, cool, refreshing, smooth, soothing, burning, filmy, sticky, irritating, gritty, stinging, and thick) were assessed 3 min after drop instillation, and taste perversion ratings (4-point scale) and descriptors (bitter, metallic, pleasant, salty, sour, or sweet) were assessed at 15 and 30 min after drop instillation.
Analytical methods
The primary analysis focused on the mean differences in subject-reported drop comfort scores (within each dose level, at each time point) and compared the study-treatment eye with the placebo eye.
Relative tolerability 0.25% alcaftadine ophthalmic solutions (formulation study)
A second clinical study was designed to evaluate the relative safety and comfort of 3 formulations of alcaftadine 0.25% ophthalmic solution as compared to Tears Naturale II (placebo) in subjects with normal ocular health. This was a single-center, double-masked, randomized, placebo-controlled, contralateral study in adult subjects with normal ocular health. The study consisted of a single visit per subject. Equal numbers of subjects were randomly assigned to receive a single drop of 1 of 3 formulations of alcaftadine 0.25% [Formulation A = original; Formulation B = reduced buffer, or Formulation C = Formulation B plus hydroxy propyl methyl cellulose (HPMC)] in 1 eye and a single drop of placebo in the contralateral eye. Drop comfort, taste perversion, and safety assessments (AEs and ophthalmic examinations) were performed after drop instillation.
Subjects reported drop comfort ratings on a numeric scale again ranging from 0 (very comfortable) to 10 (very uncomfortable) immediately after drop instillation and at 30 s, 1, 2, 5, and 10 min after instillation. Drop comfort descriptors (comfortable, cool, refreshing, smooth, soothing, burning, filmy, sticky, irritating, gritty, stinging, and thick) were also assessed 3 min after drop instillation, and taste perversion ratings (4-point scale) and associated descriptors (bitter, metallic, pleasant, salty, sour, or sweet) were assessed at 15 and 30 min after drop instillation.
Analytical methods
The primary analysis was subject-reported drop comfort score at the 6 time points (immediately after drop instillation, 30 s, 1, 2, 5, and 10 min after drop instillation) and focused on the mean differences in comfort scores (within each formulation of alcaftadine 0.25% at each time point) comparing the study treatment eye with the placebo eye.
Pharmacokinetics after single, and multiple once-daily dosing in healthy volunteers
An open-label, single-center, phase 1 study was conducted to characterize the plasma pharmacokinetics and safety profile of alcaftadine 0.25% ophthalmic solution after a single bilateral dose and after multiple bilateral once-a-day doses in male and nonpregnant females between 18 and 55 years of age with normal ocular health. Plasma pharmacokinetic parameters were assessed for alcaftadine and the primary metabolite of alcaftadine based on blood samples collected on days 1 and 7. The dosing regimen consisted of daily morning administration of a single drop (∼34 μL) of alcaftadine 0.25% ophthalmic solution in each eye beginning on day 1 and ending on day 7.
Analytical methods
Plasma concentrations of alcaftadine and the acid metabolite were determined using a liquid chromatography–mass spectroscopy assay with a lower limit of quantification of 0.01 ng/mL for alcaftadine and 0.10 ng/mL for the acid metabolite. Noncompartmental analysis was used to estimate key pharmacokinetic parameters, including maximal plasma concentration (Cmax), Tmax, and AUC0-last, as well as drug elimination rate constant (Ke), and drug half-life (t1/2) for subjects with plasma concentrations above the lower quantification limit at a sufficient number of time points. Descriptive statistics of plasma concentration versus time data and of pharmacokinetic parameters were calculated for days 1 through 7 of dosing, and compared with data from oral dosing studies (Groen, 1996).
Safety
Safety evaluations consisted of querying for ocular and nonocular AEs (reported, elicited, or observed), ophthalmic evaluations, physical examination, vital sign measurement, hematology, blood chemistry, urinalysis, and pregnancy tests.
Informed consent
The clinical protocol and informed consent for all clinical studies (Protocol 05-003-09, 04-003-09, and 05-003-04) followed the tenets of the Declaration of Helsinki for medical research involving human subjects. The protocols were reviewed and approved by the Coast Institutional Review Board.
Results
Metabolism of 14 C-alcaftadine in human liver microsomes in vitro
The metabolism of alcaftadine was tested in several different batches of human liver microsomes to determine if the process exhibited any degree of individual heterogeneity. One major metabolite, which accounted for 4.25% ± 2.24% (n = 10) of the initial radioactivity, was present in all incubates. This in vitro bio-transformation was the aldehyde oxidation of alcaftadine to the carboxylic acid metabolite (Fig. 1).
Several approaches were used to assess the importance of specific CYP isoforms in alcaftadine metabolism. First, the correlations between the rate of alcaftadine metabolism (i.e., formation of acid metabolite) and the rates of metabolism of various isoform-specific CYP substrates in 10 different batches of human liver microsomes were calculated by linear regression and the Spearman rank correlation analysis 17 (not shown). Although this analysis indicated a correlation between the CYP2A6 activity and the overall metabolism of alcaftadine, the correlation coefficients obtained after Spearman rank correlation analysis showed no significant correlation between the CYP probe substrates and the metabolism of alcaftadine or the formation of the acid metabolite.
A second approach was to test a series of isoform-specific CYP inhibitors for their ability to interfere with metabolism of alcaftadine (Table 1). This method shows that alcaftadine metabolism is most sensitive to inhibition by mephenytoin (CYP2C19), gestodene (CYP3A4), and troleandomycin (CYP3A4). The involvement of CYP in the metabolism of alcaftadine is probably of minor importance, since the cytosolic enzymes present in the 12,000 g supernatant are involved in the biotransformation of alcaftadine, resulting in rapid oxidation to the acid metabolite (see below).
CYP, cytochrome P450.
Alcaftadine effects on microsomal P450 isoform activity
Although microsomal enzymes such as CYP3A4 do not appear to be critical in the metabolism of alcaftadine, it is possible that the drug interacts with one or more CYPs in ways that are clinically significant. Table 2 shows data on a series of “index reactions,” or biotransformations considered diagnostic of specific P450 isoforms 6 conducted in the presence or absence of high levels of alcaftadine or its acid metabolite. The concentrations used represent a 200-fold molar excess over peak serum values obtained from ophthalmic preparations (see data below). None of the CYP reactions tested were significantly inhibited by either alcaftadine or the acid metabolite.
The metabolism of 14 C-alcaftadine was slow in human liver microsomes and led to the formation of the carboxylic acid metabolite. The acid metabolite was the only significant product detected and represented 6.33% ± 0.35% of the injected radioactivity after the 30-min incubation. In contrast, after incubation with the 12,000 g human liver supernatant fraction, the formation of the acid metabolite was rapid and complete within 30 min. These results suggest that the metabolism of alcaftadine occurs primarily via non-CYP enzymes, most likely involving one or more soluble enzymes such as aldehyde dehydrogenase or aldehyde reductase.
Biotransformation of alcaftadine to the acid metabolite in human liver microsomes or in human liver 12,000 g supernatant was not inhibited by coincubation with a number of compounds, including adrenaline, beclomethasone, budesonide, codeine, diphenhydramine, albuterol, terfenadine, carboxyterfenadine, or theophylline (not shown). Interaction studies with human liver 12,000 g supernatant demonstrated 25%–33% inhibition of the alcaftadine metabolism by erythromycin, loratadine, and ketotifen at in vitro concentrations of 5–8 times the therapeutical plasma level. These drugs were included in screening because of their likelihood of coadministration with alcaftadine.
Protein binding and partitioning of alcaftadine and its metabolites in blood
Drug binding to plasma proteins or the partitioning of drugs into red cells can effect drug metabolism, clearance, or interactions with other drugs. 18 Plasma protein binding of alcaftadine and alcaftadine acid was therefore measured using 3 H-labeled alcaftadine and 3 H-labeled alcaftadine acid, equilibrium dialysis, and radio-high-performance liquid chromatography quantification. The results of these experiments are shown in Table 3; 2 findings emerged from these studies. First, there were species-specific differences in the stability of alcaftadine. In human, dog, and mouse plasma as well as in human and dog blood, modest amounts of the 3 H-alcaftadine (i.e., ≤15%) were oxidized to the acid metabolite after (30 min of incubation in whole blood or 240 min incubation in plasma at 37°C). In rat blood and plasma, and in mouse blood, rabbit blood, and rabbit plasma, a greater degree of oxidation (28%–95%) of alcaftadine to the either acid metabolite or to the alcohol was observed. The most complete conversion (89%–95%) to the acid metabolite occurred in rabbit plasma and blood. In contrast, the acid metabolite was stable in all species. Unlike the variability observed in stability, protein binding was uniform and modest (Table 3). Of note, the protein binding of alcaftadine in rat and in rabbit plasma could not accurately be determined because of the instability of drug.
m, male; f, female; NA, not analyzed; SD, standard deviation.
Table 4 summarizes blood to plasma concentration ratios for alcaftadine and the acid metabolite in each species. As in studies of protein binding, the rapid conversion of alcaftadine to its metabolites (in rat, mouse, and rabbit blood), prevented an accurate determination. The plasma protein binding of alcaftadine and the acid metabolite was low to moderate in all species. In dog and mouse, the plasma protein binding of alcaftadine was higher than that of the acid metabolite; in human plasma, it was the reverse. The difference between man and animals was not due to a concentration effect, because in dog plasma, there was no difference in the plasma protein binding of alcaftadine at 5 and 100 ng/mL or of the acid metabolite at 20 and 1,000 ng/ml (not shown). The data indicate that alcaftadine has an affinity for red blood cells, but that the acid metabolite is largely concentrated in the plasma.
Relative tolerability of alcaftadine ophthalmic formulations
A total of 128 subjects completed the study of alcaftadine comfort as a function of drug concentration (the comfort study). Alcaftadine was well tolerated in this population and subjects reported all concentrations of alcaftadine to be relatively comfortable. A dose-dependent increase in eye discomfort immediately after drop instillation was noted (Table 5). The greatest difference in comfort scores (3.5 U, P < 0.001) occurred immediately after drop instillation in the 0.5% treatment group. The descriptors chosen by subjects who received the 0.05% and 0.1% concentrations of alcaftadine in 1 eye were comparable to those selected by these subjects for their placebo-treated eyes.
Treatment eye score minus placebo eye score. Drop comfort assessed on a scale of 0 to 10, where 0 = very comfortable and 10 = very uncomfortable.
P value of <0.05 based on within group one-sample paired t-test comparing eyes treated with alcaftadine to placebo.
There were no statistically significant differences in the incidence of taste perversion among the treatment groups at either assessment point (15 or 30 min). Overall, taste perversion scores were favorable (low score) with the mean score generally below 2 (occasional, mild taste). The incidence of AEs was low and similar across treatment groups. All AEs were self-limiting, resolved without treatment, and were judged by the investigator as mild in severity. The most commonly reported AEs were conjunctival hyperemia and conjunctival edema, reported by 3%–6% of alcaftadine-treated subjects, and in ∼2% of the vehicle-treated subjects.
A total of 93 subjects completed the second study to evaluate the comfort of 3 different formulations of alcaftadine 0.25% solution (the formulation study). Overall, alcaftadine was found to be safe and well tolerated in this population, and subjects reported all formulations to be relatively comfortable. The mean comfort scores for this study are provided in Table 6. Using the 10-point scale (lower score indicating greater comfort), subjects rated the 3 formulations (A = original; B = reduced buffer; C = HPMC) overall as “comfortable,” with the highest mean score of 3.2 obtained immediately after drop instillation of the original formulation. The mean comfort score of the Reduced Buffer formulation immediately after drop instillation was 2.2. This one point difference was the greatest separation noted throughout the study among the 3 formulations. The majority of mean subject ratings were <2 and many were 1 or lower, indicating that all formulations were relatively comfortable and acceptable. All 3 formulations had similar comfort scores within a few minutes of instillation. Although all subjects rated all treatment groups to be relatively comfortable, the Tears Naturale II (placebo) eyes were consistently scored lower (more comfortable) by subjects as compared with the 3 active treatment groups. Mean comfort scores decreased over time in all treatment groups and they did not differ significantly among treatment groups at any time points. On average, subjects receiving the Reduced Buffer formulation were more likely to select desirable descriptors of comfort (comfortable, cool, refreshing, smooth, and soothing), whereas those who received either the original formulation and HPMC formulation of alcaftadine 0.25% were more likely to select less desirable comfort descriptors.
Drop comfort assessed on a scale of 0 to 10, where 0 = very comfortable and 10 = very uncomfortable.
P value based on one-way analysis of variance for treated eyes only.
HPMC, hydroxy propyl methyl cellulose.
Overall, few subjects reported any taste perversion across formulation groups. The incidence of taste perversion ranged from 13% to 23% at 15 min after drop instillation and from 3% to 13% at 30 min after drop instillation. There were no statistically significant differences in the incidence of taste perversion among the formulation groups at either time point and scores were generally “1” (sensation, but no noticeable taste) and “2” (occasional mild taste).
The incidence of AEs was low, ranging from 1% to 3%, with the incidence being similar across formulation groups. All of the events were ocular in nature and most occurred upon instillation of the drops. All AEs occurring in the active treatment groups were self-limiting and judged by the investigator as mild in severity.
Clinical pharmacokinetics of alcaftadine after single and multiple once-daily dosing
A total of 13 subjects completed the study. Plasma concentrations of alcaftadine reached Cmax rapidly and declined to below the lower limit of quantification by 3 h postdosing (Fig. 2 and Table 7). The Cmax values were low, with maximum plasma concentrations of <0.12 ng/mL for all subjects (for comparison, peak plasma values for acid metabolite were 2–3 ng/mL). The AUC0-last values ranged from 0.01 to 0.11 ng · h/mL, reflecting rapid elimination of the parent drug. After ophthalmic administration, alcaftadine appeared rapidly in the systemic circulation, reaching peak concentrations with a median time of 15 min. For approximately half of the subjects, there were too few time points with quantifiable plasma concentrations to allow reliable estimation of a terminal Ke or t1/2. For those subjects with sufficient time points above the lower limit of quantification, the terminal t1/2 was short, ranging from 0.40 to 2.6 h. Similar alcaftadine plasma concentration–time curves were obtained for each subject after single or multiple doses (Fig. 2A). The primary acid metabolite reached maximum plasma concentrations by the 1.5 h time point for all subjects (Fig. 2B and Table 8). Plasma concentrations declined rapidly and were near or below the quantitation limit of 0.1 ng/mL by 12 h after dosing for all subjects after single or multiple dosing.
The descriptive statistics for each parameter are based on the total number of subjects with samples from which pharmacokinetic parameters could be calculated.
All values are reported as mean (SD) except Tmax, which is given as median and range.
For alcaftadine, the terminal elimination rate constant Ke was estimated. For acid metabolite Ke was estimated for the initial dominant phase, which carried the majority of the AUC.
AUC, area under the time vs. concentration curve; Cmax, maximal plasma concentration; Ke, drug elimination rate constant; t1/2, drug half-life.
Total daily ophthalmic dose = 0.17 mg.
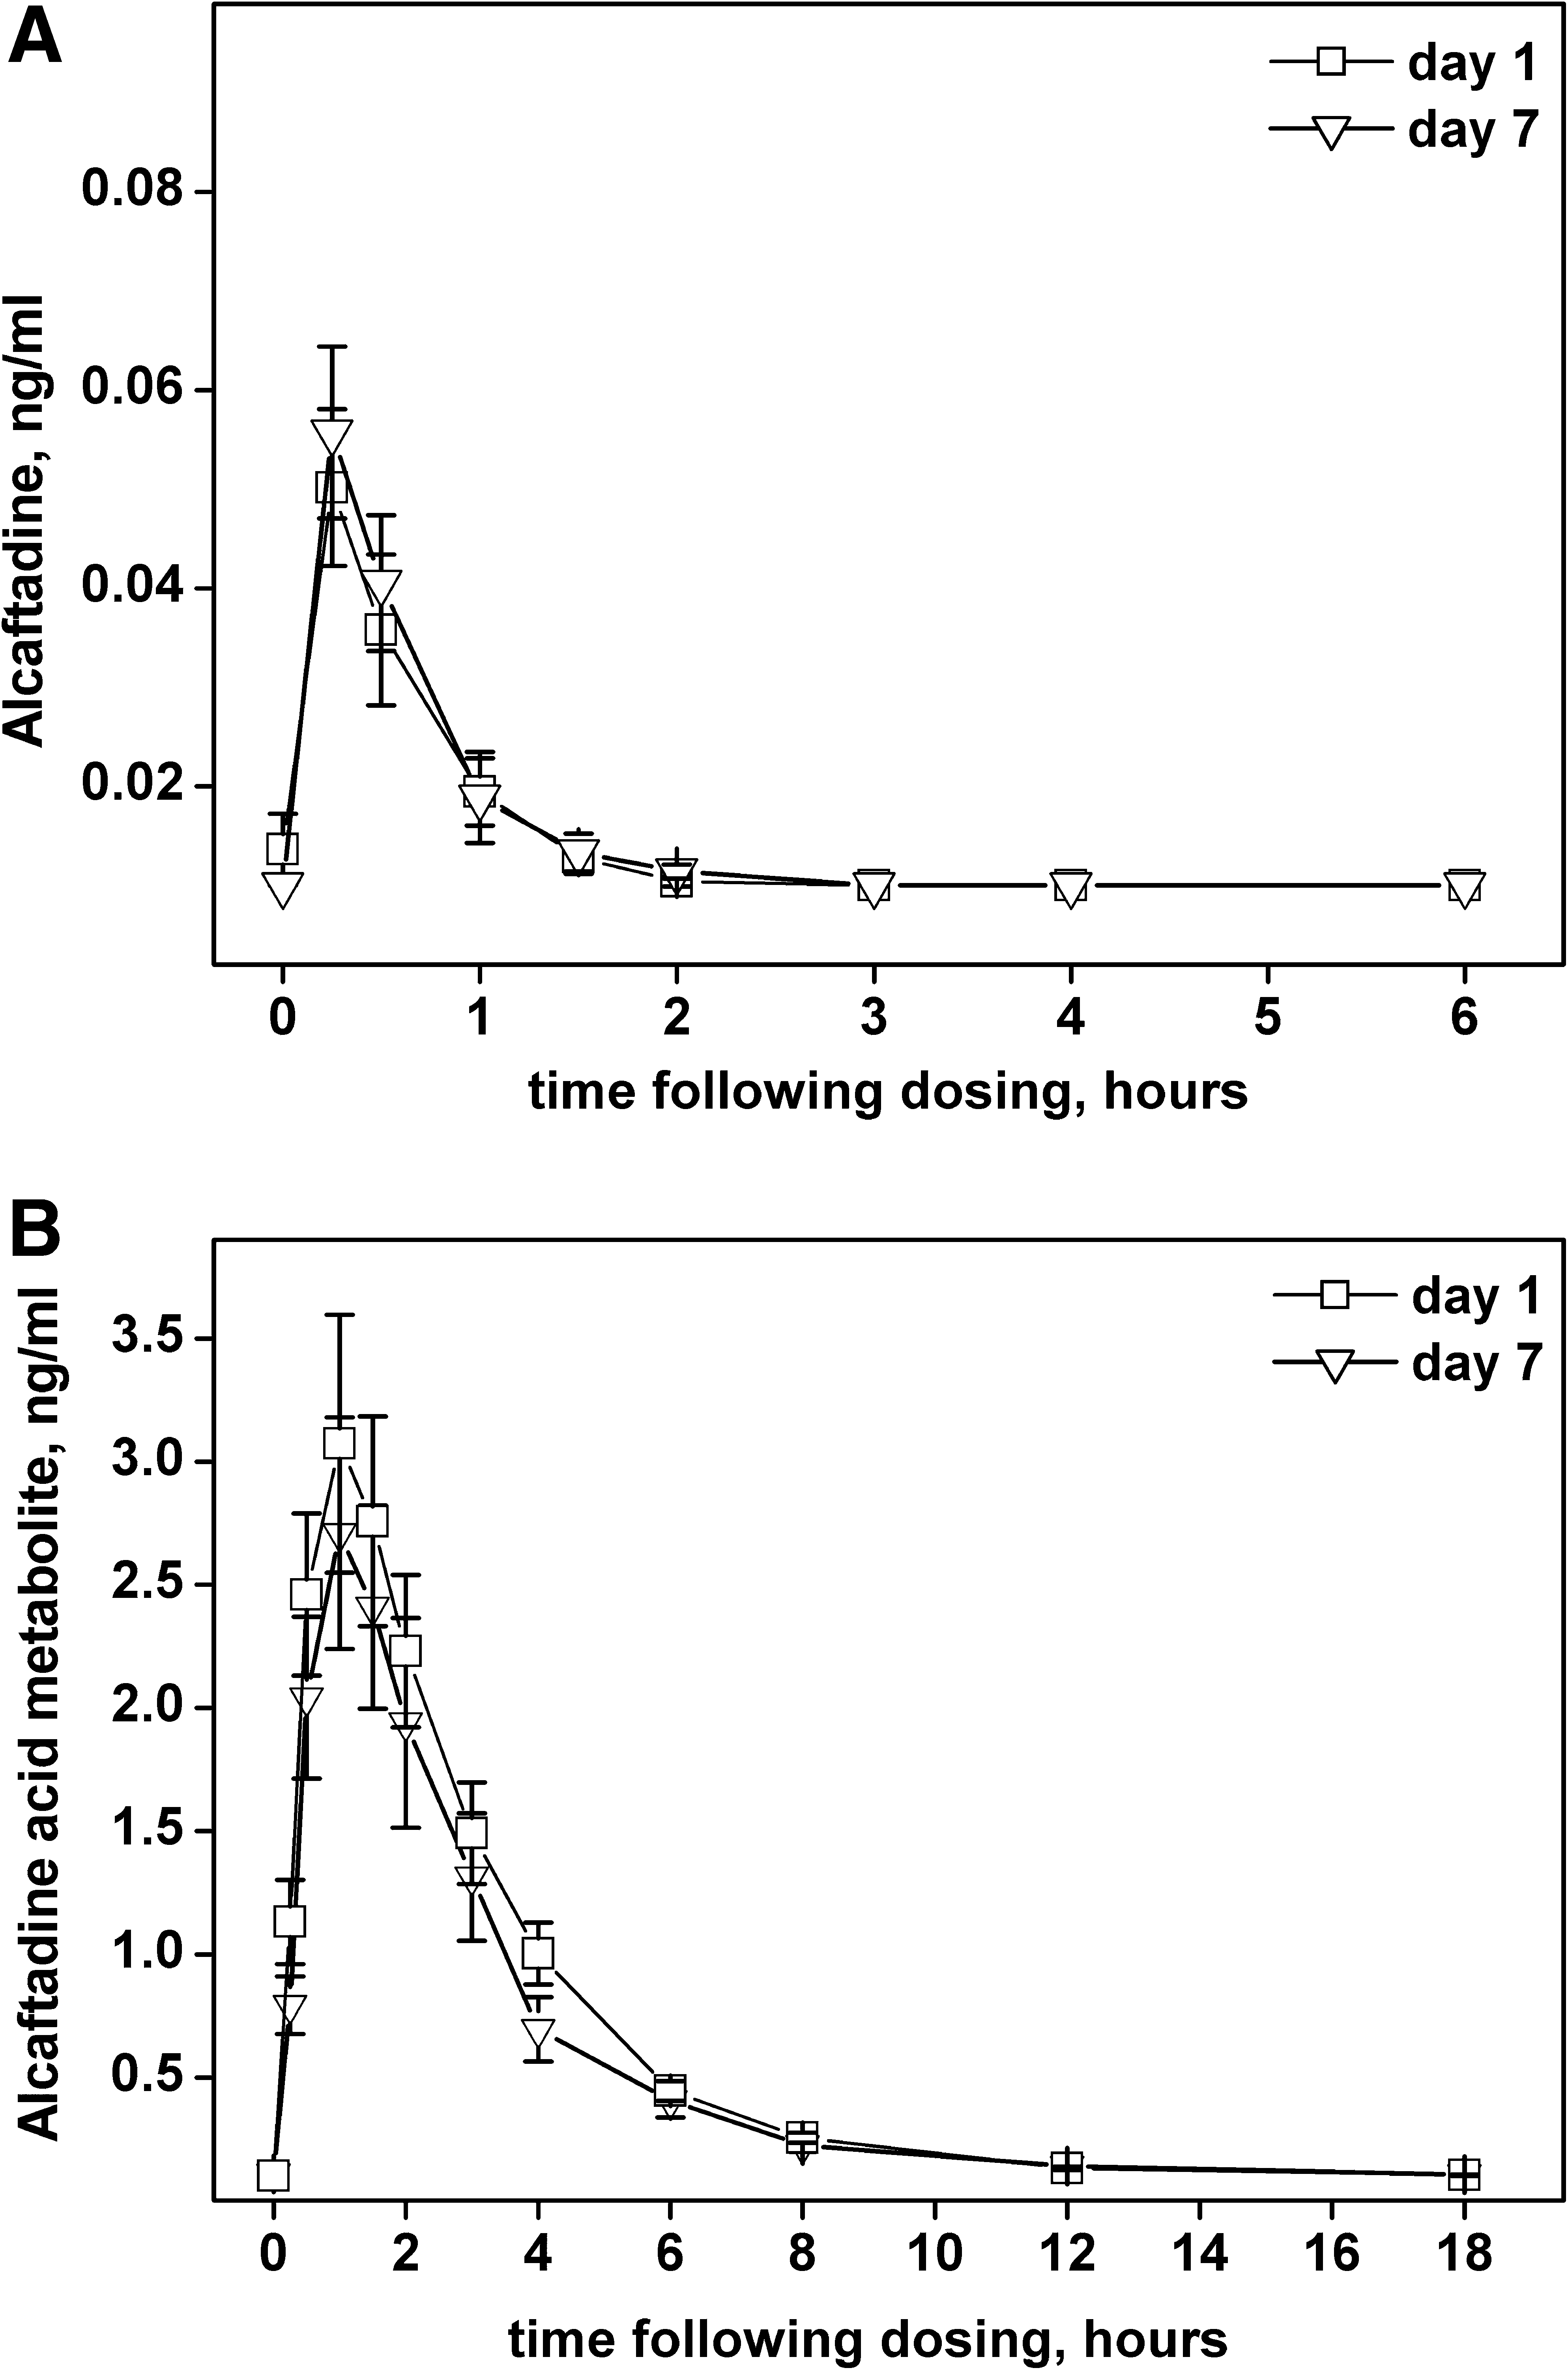
Plasma levels of alcaftadine or acid metabolite. Alcaftadine
The acid metabolite plasma concentrations curves showed a biphasic decline. Ke and t1/2 were estimated for the initial dominant phase, which had a half-life of ∼2 h and carried the majority of the area under the time vs. concentration curve (AUC). There were too few time points with quantifiable plasma concentrations in the terminal phase of the acid metabolite curves to allow reliable estimation of the terminal t1/2, so AUC0-inf could not be calculated. The AUC0-last values were low, ranging from 3.13 to 22.57 ng · h/mL, and were comparable after single and multiple dosing. There was no accumulation and the acid metabolite plasma concentration–time curves were similar for each subject after single or multiple doses.
Two subjects reported AEs during the study (viral pharyngitis and rash). Both were considered by the investigator as mild and unrelated to study medication.
Discussion
This report examines pharmacological and pharmacokinetic properties of the novel antihistamine alcaftadine. In vitro metabolism was examined to assess the mechanisms of alcaftadine biotransformation and to identify possible drug interactions. In addition, studies on the tolerability of various alcaftadine concentrations and formulations were used to characterize the drug in an ophthalmic formulation. Clinical pharmacokinetics of the ophthalmic formulation were analyzed and compared with data on pharmacokinetics of oral preparations. Results suggest that the potential for drug interactions are low and the ophthalmic formulation is generally well tolerated.
The microsomal CYP enzymes are responsible for ∼60% of all bio-transformation of xenobiotics, 6 but data from this study suggest that they play a minor role in metabolism of alcaftadine. This is evident from the observation that while alcaftadine is rapidly converted to its acid metabolite in vivo, <5% of the drug undergoes this conversion when incubated with liver microsomes in vitro. Inhibition studies suggest that isoforms such as 2A6, 3A4, and 2C19 may be minor participants in the oxidation of alcaftadine to the acid metabolite, whereas metabolism appears to be readily reconstituted by soluble enzyme fractions (12,000 g supernatant) of liver homogenates. The likely enzymes mediating the aldehyde oxidation of alcaftadine are aldehyde dehydrogenase and aldehyde reductase, which are cytosolic enzymes.19,20 This metabolic pathway is unique among antihistamines that are typically oxidized by CYP3A4 or excreted from the body without biotransformation.
The potential for significant drug interaction was examined by testing whether alcaftadine could inhibit CYP enzymes. Neither alcaftadine nor its primary metabolite substantially inhibited the major CYP isoforms, even at the highest concentrations of alcaftadine (100 ng/mL) and the acid metabolite (1,000 ng/mL) tested. Therefore, no clinically relevant drug interactions based on inhibition of the CYP isoenzymes would be expected for either alcaftadine or its acid metabolite. Similarly, in vitro studies of serum protein binding of alcaftadine or its acid metabolite suggest that no drug interactions based on this aspect of drug pharmacokinetics are likely to be of clinical significance.
In the comfort study, 1 drop of ophthalmic solution was well tolerated and had an acceptable safety profile in the population studied. Concentrations up to 0.5% demonstrated a reasonable degree of comfort with rapid resolution of any initial discomfort. All 3 formulations (original, reduced buffer, and HPMC) in the formulation study demonstrated a high degree of comfort. The reduced buffer formulation demonstrated a clinically meaningful benefit in comfort scores beyond that seen with either of the other formulations. Based on these data, a reduced buffer formula of alcaftadine 0.25% was selected for the phase 3 program.
Pharmacokinetic assessment of alcaftadine after ocular administration shows that this formulation has properties similar to oral dosing. Bioavailability of alcaftadine is very low after either route of administration. There is very limited systemic exposure to alcaftadine after ophthalmic administration of the 0.25% ophthalmic formulation, with plasma concentrations falling below 0.01 ng/mL within 2 h of dosing in all but 1 patient. This is primarily due to conversion of the parent drug to the active carboxylic acid metabolite of alcaftadine, which appears rapidly in the systemic circulation, reaching peak concentrations 1–2 h after dose administration.
No systemic accumulation of acid metabolite was observed after either ocular dosing or oral dosing, even at the highest doses tested. On a dose-adjusted basis, the bioavailability of the acid metabolite after multiple daily ophthalmic administration of alcaftadine was approximately half of that obtained after multiple daily oral administration of alcaftadine. The urinary excretion of the acid metabolite was determined in the oral dose studies. After single oral doses of 0.5 to 2 mg of alcaftadine, the renal excretion of the acid metabolite ranged from 55% to 60% of the alcaftadine dose, with no significant dose-dependent differences. These results are consistent with animal studies (Sebesta, 1997) that indicated over 90% of the circulating radioactivity was the acid metabolite. In that study the majority of the radioactivity was excreted via the kidney; however, a small fraction of the dose was excreted in the feces, suggesting that conjugation and excretion into the bile may be a potential minor route of elimination.
These nonclinical investigations of the in vitro metabolism and protein binding of alcaftadine and the acid metabolite were conducted to support the oral administration alcaftadine and were performed at higher concentrations than are achieved after ophthalmic administration. Even at these higher concentrations, the results demonstrate that systemic exposure to alcaftadine and the metabolite is unlikely to result in any drug–drug interactions based on either protein binding or competitive or noncompetitive inhibition of the CYP isoenzymes.
After ocular administration of alcaftadine 0.25% ophthalmic solution, alcaftadine appears rapidly (median Tmax = 15 min) and briefly in the systemic circulation, falling below quantifiable plasma concentrations by 3 h after dosing. Maximum plasma concentrations achieved were below 0.12 ng/mL. The primary route of elimination of alcaftadine, an aldehyde, is metabolism to the active carboxylic acid metabolite, which occurs predominately via cytosolic enzymes. The acid metabolite reaches peak plasma concentrations of ∼3 ng/mL by 1 h after dosing and plasma concentrations fall below or near the minimum quantification limit by 12 h after dosing. The acid metabolite has a dominant t1/2 of ∼2 h and, based on data after oral administration, is primarily eliminated unchanged in the urine. There was no indication of accumulation or changes in pharmacokinetics with multiple dosing.
The selection of the final formulation for alcaftadine 0.25% ophthalmic solution was based on comparisons of comfort results across multiple concentrations and formulations. Topical administration of alcaftadine 0.25% ophthalmic solution was well tolerated and had an acceptable safety profile. Plasma concentrations of the drug were quite low and declined rapidly. Alcaftadine 0.25% ophthalmic solution has been approved for prevention of itching in the United States.
Footnotes
Acknowledgment
The authors wish to thank James McLaughlin for assistance in preparation of the article.
Author Disclosure Statement
The authors acknowledge the following commercial associations: H. Bohets acknowledges stock assets in Johnson & Johnson, Inc. C. McGowan acknowledges stock assets in Johnson & Johnson, Inc. G. Mannens: acknowledges stock assets in Johnson & Johnson, Inc. N. Schroeder confirms that no competing financial interests exist. K. Edwards-Swanson acknowledges stock assets in Johnson & Johnson, Inc. A. Shapiro confirms that no competing financial interests exist.