
Abstract
Abstract
Purpose:
Raman spectroscopy holds potential for the assessment of intraocular pharmacokinetics. Raman spectra of ocular drugs were acquired, to determine the drug-specific Raman signature. The ability of the Raman technique to quantify drug concentrations was also investigated.
Methods:
The experimental setup was based on a High Performance Raman Module 2500 Raman module, designed for 180° “backscatter” signal detection in the wavenumber range of 400–1,800 cm−1. Excitation source was a diode laser emitting a beam with a wavelength of 785 nm and a power of 10 mW. Laser light was focused in the sample with a long-working-distance microscope objective (25×/0.50). Samples were measured in quartz cuvettes in 10 sequential measurements, with exposure time 30 s. The total number of measured drugs was 49. To determine whether signal intensity and drug concentration correlate, 2 drugs were diluted in water and measured with 120 s exposure time at different concentrations.
Results:
An active ingredient–specific Raman signature was detected in 4 glaucoma drugs, 6 mydriatics, 5 antibiotics, 4 anesthetics, 3 anti-inflammatory drugs, 2 types of artificial tears, and 5 other drugs. In 20 drugs, no specific Raman signature was detected. Linear correlation of drug concentration with signal intensity was high (R2≥0.94).
Conclusions:
Using low laser powers, Raman signatures for 29 commonly used ocular drugs were detected. Correlation of drug concentration with signal intensity is high, which is essential for monitoring drug concentration in ocular media. The presented results encourage the use of Raman spectroscopy to acquire detailed information on the pharmacokinetics of these ocular drugs.
Introduction
Studies on ocular pharmacokinetics are limited by the invasiveness of current techniques. There are currently no methods available to measure the intraocular concentration of ocular drugs other than by invasively sampling aqueous or vitreous humor. This limits the maximum number of measurements and does not allow for real-time monitoring of drug concentration. Real-time monitoring would allow the ophthalmologist to optimize drug treatment efficacy for each individual patient and more precisely determine dosage and optimum time for administration of the drug. An approach capable of continuously quantifying local drug concentration within the eye would allow monitoring of drug concentrations. Further, application of a noninvasive approach is desirable, because it can eliminate the risks involved with invasively acquiring samples. 1
In the biomedical field, Raman spectroscopy can be used to detect the presence of molecules that exhibit unique Raman signatures.1–6 Raman spectroscopy measures the shift in wavelength of incident light as it is scattered by molecules in the tissue or media. This shift is characteristic for the intermolecular and intramolecular vibrational frequencies. 7
The Raman spectroscopic technique has several advantages: a noncontact character, real-time response, both qualitative and quantitative analysis capabilities, a high degree of specificity, and simultaneous multicomponent detection. 8 The possibility of continuously repeating measurements, which allows monitoring of drug concentration, is another major advantage of Raman spectroscopy. The technique is limited by the weak intensity of the Raman scattered light and/or the occurrence of fluorescence. 9
This technique has been already successfully used to monitor the presence of various concentrations of the antiviral drug ganciclovir within the ocular media. 10 In several studies, the local concentration of the antibiotic ceftazidime and the antifungal agent amphotericin B has been quantified in animal models.1,11,12 Further, the antibiotic ciprofloxacin has been quantified in a model system mimicking the anterior chamber of the eye. 13 The feasibility of in vivo application of Raman spectroscopy has been already demonstrated in a pharmacokinetic study. 14
To be able to study the pharmacokinetics of a variety of drugs in the intraocular environment using Raman spectroscopy, their substance-specific Raman signature needs to be determined in vitro. For a number of ocular drugs, Raman signatures have been already investigated.1,10,14–21 In the present experiment, we aim to identify Raman signatures for commonly applied ocular drugs with relatively safe, near-infrared laser light. Availability of the Raman signatures of these drugs is necessary for the detection of these drugs in the more complex environment of the human eye. In exploring the potential of Raman spectroscopy for real-time, noncontact assessment of the pharmacokinetics of these drugs, this experiment is our first step.
Methods
Figure 1 shows a schematic representation of our modular Raman spectroscopy system, prepared for modifications that allow safe in vivo measurements. The excitation source for this in vitro experiment was a diode laser emitting a beam with a wavelength of 785 nm, providing an incident laser power of 10 mW. We recorded Raman spectra using a High Performance Raman Module Model 2500 (River Diagnostics®). The module receives the laser light through a single-mode optical fiber, shapes and conditions the beam through a pinhole, and supplies the laser light to the measurement stage. Here, a long-working-distance microscope objective lens (magnification×25; numerical aperture=0.50; focal length=10 mm; Carl Zeiss) acts as both the focussing device for the incident light and as the collecting lens for the Raman back-scattered light. The back-scattered light is passed back toward the Raman module. The Raman scattered light is projected on a cooled charge-coupled device (CCD) camera (operating temperature: −70°C) for signal detection in the range of 400 to 1,800 relative wavenumbers (cm−1) at a resolution of 2 cm−1.
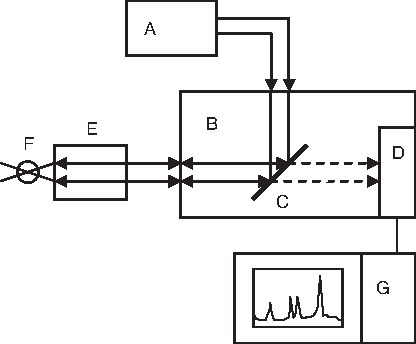
Raman scattering setup consisting of
For the experiment, we selected commercially available ocular drugs, available as water-based eye drops or as a water-soluble substance. We also selected a number of additives commonly present in these drugs. In total, 49 drugs and 8 additives were considered suitable for the experiment.
The laser light interacted with the liquid sample in a sealed quartz cuvette (Sigma-Aldrich). We acquired spectra using exposure times of 30 s. We acquired 10 sequential spectra of each drug. We compared multiple sequentially acquired spectra to be able to recognize and correct for spectral disturbances due to cosmic rays. For each measurement, we measured the spectrum of a sample of purified water using the same exposure time. This spectrum was used as a reference spectrum.
After correction for interference due to cosmic rays, we averaged the data of the ten 30-s spectra of both the experiment substance and its water reference to improve the signal-to-noise ratio. We subtracted the averaged spectrum of the drug by the averaged spectrum of its water reference. This corrected for possible interference of the water signature and resulted in a signature specific for the dissolved or suspended substances in the drug. To facilitate interpretation, we applied a moving average filter of 4 U on the spectral data.
For drug additives such as preservatives, we compiled a Raman spectral library. Spectra of 24 compounds were found in the literature.21–27 For 8 additives, no Raman spectra were available from the literature. Therefore, we dissolved these substances separately in purified water and measured their spectra using the experimental setup and protocol as described earlier.
For each drug measured, we compared the acquired signature to the characteristic Raman signatures of the additives in the drug. This allowed us to distinguish between those peaks in the signatures specific for the active pharmaceutical ingredient (API) and those peaks coinciding with peaks in the signatures of additives in the drug. Spectra were subdivided into categories based on the presence of API-specific peaks. Category 1 includes all signatures in which at least 1 peak is specific for the API in the drug. This means that on comparison of the drug signature with the signature of its additives, at least 1 peak in the drug signature did not coincide with any of the peaks in the signatures of the additives. Category 2 includes the signatures in which all peaks have been designated API nonspecific. When a peak in the measured signature coincided with any peak in the signature of any of the additives, this peak was designated “nonspecific” for the API. Category 3 includes all drugs with no detectable Raman activity, neither from the active ingredient nor from any additive.
To demonstrate the ability of our method to quantify drug concentrations, we selected 2 drugs exhibiting intense API-specific Raman signatures. We diluted these drugs with high-performance liquid chromatography–grade water to concentrations ranging from 0.1% to zero dilution. Using measurements of 120 s exposure time, we plotted the Raman intensity of the highest API-specific peak against sample drug concentration (%) and investigated their relation for linearity.
Results
Figure 2 shows the Raman signatures of Phenylephrine Minims®, Cosopt® Preservative-Free (dorzolamide/timolol), and Trusopt® Preservative-Free (dorzolamide). All contain sharp, high-intensity peaks and have a good overall signal-to-noise ratio. These drugs are 3 of 29 drugs with Raman signatures, in which at least 1 peak is specific for the API (category 1). The positions of the peaks in the Raman signatures are listed in Table 1.
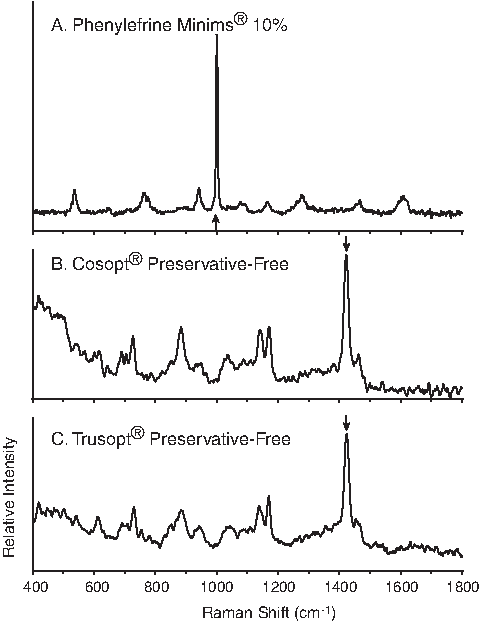
Examples of Raman spectra with, indicated by arrows, active pharmaceutical ingredient–specific peaks:
FNA, Formulary of Dutch Pharmacists.
Table 2 lists the peaks in the signatures of the drugs in category 2. In these 13 signatures, all detected peaks coincide with peaks in the signature of one or more additives in the drug. Table 2 also specifies the name of the additive exhibiting a Raman signature with one or more peaks coinciding with the drug signature. Figure 3A shows the Raman signature of Travatan® (travoprost). It exhibits peaks at 886, 1,028 and 1,466 cm−1, which coincide with the peaks present in the signature of mannitol, one of the additives in this drug (Fig. 3B). Therefore, these peaks are “not specific” for travoprost.

Table 3 lists the 7 drugs in which no Raman activity was detected (category 3).
In Fig. 4 the intensity of the Raman peaks at 1,000 and 1,436 cm−1 is plotted for (A) phenylephrine HCl and (B) acetazolamide, respectively. The intensities (arbitrary units) are shown as a function of the concentration of the drugs in the range 0.1%–10%. We found a good linear correlation between the natural logarithm of the drug concentration and the natural logarithm of the peak intensity (phenylephrine measurements: R 2 =0.94, n=5; acetazolamide measurements: R 2 =0.99, n=7). This correlation supports the validity of the Raman technique method to assess drug concentrations. For phenylephrine and acetazolamine, we found limits of detection with the described experimental conditions, from which the water-corrected spectrum did not change on further dilution. A concentration of 0.5% was the limit of detection for phenylephrine and 0.1% for acetazolamide.

Plots of the relation between Raman intensity and concentration of
Discussion
In this article, we present the peaks in the Raman signatures of a variety of ocular drugs. Referring to available literature, we discuss the most plausible origin for the peaks found in the API-specific drug signatures. 28
Glaucoma drugs
Both Trusopt (dorzolamide) and Cosopt (dorzolamide/timolol), 2 frequently used glaucoma drugs, exhibit a dorzolamide peak near 1,422 cm−1. It is attributed to the ring stretch vibration in the 2-substituted thiophene group and was previously described by Bauer et al. 14 The same peak is found for brinzolamide in Azopt® (brinzolamide), which has structural similarities with dorzolamide. The 1,374 cm−1 peak in Normoglaucon® (metipranolol/pilocarine) can be assigned to pilocarpine, 21 although no reference for the other active ingredient, metipranolol HCl, was available.
Mydriatics
All mydriatics exhibit a peak near 1,000 cm−1. It has been ascribed to the monosubstituted aromatic ring in atropine, scopolamine, and tropicamide and to the meta-disubstituted aromatic ring in phenylephrine. 16 For atropine sulfate, the peak at 980 cm−1 has been ascribed to the sulfate ion. 24
Antibiotics
The positions of all reported chloramphenicol peaks are in accordance with reference material. 21 The peak at 1,356 cm−1 corresponds to the stretching vibration of the NO2 group of chloramphenicol, comparable to results of earlier work.17,21 In the spectra obtained for moxifloxacin and ofloxacin, characteristic features of the quinolones can be observed: the C=C stretching vibration of the aromatic rings around 1,620 cm−1, and the stretching vibration of the quinolone ring system around 1,400 cm−1. 20 We found no publication regarding the gentamicin sulfate spectrum.
Anesthetics
Peaks near 1,604 cm−1 ascribed to the C=C stretching vibration in aromatic rings can be observed in the spectra of both tetracaine and oxybuprocaine. This peak was also observed in pure tetracaine at 1,601 cm−1 by Dennis et al. 19
Other drugs
The peak near 1,000 cm−1 in ketorolac trometamol can be assigned to the monosubstituted aromatic ring “breathing” vibration in the molecule. The positions of the peaks observed in the mannitol spectrum match those presented by Campbell Roberts et al. 18 The spectrum of acetazolamide is comparable to the spectrum of solid-state acetazolamide, recorded by Griesser et al., 15 regarding the peaks near 1,436 and 668 cm−1. Peaks near 1,600 cm−1 ascribed to the stretching vibration in aromatic rings can be observed in the spectra of cromoglicic acid, prednisolone, levocabastine, and ketorolac trometamol. We found no earlier publication regarding the spectra of fluormetholone, polyvidone, and sodium edetate.
Category 2 drugs
In the drugs in category 2, no API-specific Raman signature was detected. This does not mean that these drugs are by definition “Raman inactive.” For instance, we detected no specific signature in timolol (Table 2), whereas in another experiment by Anastassopoulou et al., timolol does exhibit a specific signature. 29 Unique experimental conditions should be noted. The other experiment used a laser power of 100 mW, but we used a power of 10 mW. The other experiment used water solutions with timolol, but we used the commercially available drug with its additives. Probably, with higher laser powers, timolol exhibits more peaks than we were able to detect, with possibly one or more active ingredient–specific peaks. However, we did not detect more peaks with low and relatively safe laser powers. It is possible that the peaks we detected in category 2 drugs arise (in part) from the API. However, these commercially available drugs have additives with signatures coinciding with the drug signatures. This makes them less suitable for Raman detection in vivo, as uncertainty will remain on whether the signal detected arises from the active ingredient, an additive, or both.
Essential for studying pharmacokinetics is being able to follow in time and space the distribution of a drug within the eye on topical application. To perform such measurements safely in eyes of live subjects, we are currently developing an application that prevents the direct exposure of basic cordial tissues of the eye such as the lens and the retina to the laser light. Sideroudi et al. 11 applied a 90° Raman scattering geometry to prevent such exposure, although reflections of the laser beam that traverses the eye or laser scattering within the eye could not be completely avoided.
Using a low-power near-infrared laser setup, which we can modify to allow for safe in vivo measurements, 29 drugs show an API-specific Raman signature. In further in vitro research, the Raman signatures of these drugs, diluted in aqueous and vitreous humor, will need to be studied. At that point, determining the limit of detection of these drugs is needed. Further, these limits of detection will have to be assessed whether they allow for reliable study of pharmacokinetics in vivo.
In in vivo pharmacokinetic studies, we need to distinguish the drug signal from the background signal arising from the various structures and substances in the eye. For the 29 drugs in category 1, we now know at which wavenumber position in the spectrum to expect the drug-specific signal. This knowledge enables us to distinguish the drugs by their Raman signal. Further, as concentration of the substance correlates well with intensity of the signal, we can determine the relative concentrations of these drugs. Bauer et al. 14 have already shown the feasibility of the Raman technique in detecting concentration changes of dorzolamide in vivo in the rabbit cornea. Lastly, we need to follow the distribution of the drugs in the tissue and media of the eye. By focusing the laser in various ocular structures such as the cornea or the anterior chamber, we can compare measurements not only over time but also between different positions. By doing so, we can obtain information on the spatial behavior of the drugs.
Conclusion
Using relatively low laser powers, we detected Raman spectra for 29 commonly used ocular drugs. Further, the concentration of drugs correlates well with signal intensity, which is essential for monitoring drug concentration in ocular media. With the presented results, it is feasible to acquire detailed information on the pharmacokinetics of these ocular drugs with the Raman spectroscopic technique.
Footnotes
Acknowledgments
The authors thank Tramedico BV, Merck Sharp & Dome BV, and Alcon Nederland BV for providing samples of their products.
Author Disclosure Statement
All authors declare that no competing financial interests exist.