
Abstract
Abstract
Purpose:
To evaluate the effect of 24-h peak intraocular pressure (IOP) on the progression of primary open-angle glaucoma (POAG) and the 24 h time points that best predict peak pressure.
Methods:
A retrospective analysis of clinical data evaluating long-term glaucomatous progression in patients with POAG who were previously in a 24-h study of the authors (IOP readings at 2/6/10 A.M. and 2/6/10 PM); had ≥3 treated 10 A.M. (±1 h) IOP measurements over 5-years after an untreated 24-h baseline; and had a treated 24-h curve with a 10 A.M. IOP±2 mmHg within the 10 A.M. mean IOP over 5-years.
Results:
We included 98 nonprogressed and 53 progressed patients with POAG (n=151). The mean 24-h peak IOP (mmHg) was 19.9±2.7 for progressed and 18.3±2.0 for nonprogressed patients (P<0.001). Progressed patients also showed a higher mean 24-h IOP. Generally, patients with a mean or peak daytime (readings at 10 A.M., 2 and 6 P.M.) or 24-h peak IOP of ≤18 remained nonprogressed in 75%–78% of cases. Further, measuring IOP at night found a higher peak in only 20% of cases, which was ≤2 of the daytime peak in 98% of cases. A multivariate regression analysis showed only 24-h peak IOP as an independent risk factor for progression (P=0.002).
Conclusions:
This study suggests that daytime peak IOP may be clinically important in predicting long-term glaucomatous progression. Further, daytime peak IOP may assist, as much as daytime mean IOP and, in most cases, 24-h peak IOP, in helping to guide long-term treatment in POAG.
Introduction
Despite these findings, there is not uniform acceptance regarding the importance of the peak pressure within the ophthalmic community. This is because, at least in part, not all studies have shown peak pressure to be an independent risk factor.4–6
Further, several other problems exist when utilizing peak pressure clinically. First, unlike the mean pressure, we do not have an exact target for the peak pressure to prevent glaucomatous progression; and second, since performing 24-h curves is not practical clinically, which daytime time point(s), or combination of time points, physicians can use to assess the peak has yet to be described. Ideally, 24-h studies might furnish information to clinicians regarding which time points they could monitor themselves to better evaluate pressure control and improve treatment to reduce the rate of glaucoma progression.
The primary purpose of this study was to evaluate the effect of 24-h peak IOP on the progression of primary open-angle glaucoma (POAG) and the 24-h time points that best predict peak pressure.
Materials and Methods
Patients
The design was a retrospective analysis that included 1 center in Greece and 1 in Italy. IRB approval was not required due to the retrospective study design. We included patients in whom POAG had been diagnosed; had been previously included in the database of 24-h studies of the authors (A.G.P.K., W.C.S., L.Q.) and who had been included in published 24-h trials; had 5-years of available follow-up with at least 3 at 10 A.M. (±1 h) IOP measurements on treatment over the first 5-years after the initial untreated baseline; had an available untreated baseline 24-h curve at the beginning of the follow-up phase; had an available treated 24-h study with a 10 A.M. pressure (in at least 1 treated arm) that was ± 2 mmHg within the mean chronic IOP over 5-years (or until progression) in at least 1 eye; and was ≥21 years of age.
Patients were excluded from this trial if they had any abnormality that prevented reliable applanation tonometry in the study eye; intraocular conventional or laser surgery 3 months before the start of data collection; media opacity preventing reliable baseline optic nerve or visual field evaluation; primary, acute, or chronic angle closure or exfoliation glaucoma; secondary or congenital glaucoma; and known occludable angles by gonioscopy or presence of any other clinically significant angle abnormalities. Patients were also excluded who had presence of cataracts that would interfere with the interpretation of the data or the evaluation of the progression.
Procedures
All data were derived from a database of patients included in previous 24-h studies performed by authors over the past 12-years. Data collection began from the first available patient untreated 24-h curve in the database and continued consecutively and chronologically. All prospective 24-h studies had the same 4-h interval between 24-h time points (2/6/10 A.M. as well as 2/6/10 P.M.). All pressures were measured in a masked fashion with Goldmann applanation tonometry. All patients in the databases were reviewed, and all those meeting the inclusion and exclusion criteria were utilized for this analysis. In total, 325 patient records were reviewed for this study from the 24-h pressure curve databases.
To evaluate the influence of the peak pressure, we used the first untreated 24-h pressure curve and the treated 24-h pressure curve (±2 mmHg) that best reflected the mean pressure over the 5-year follow-up that was measured between 9 and 11 A.M. We chose the 10 A.M. pressure, because it generally reflects the highest 24-h pressure over the 24-h curve in Mediterranean countries.7,8 We then matched the 10 A.M. IOPs from the 24-h pressure curves that were closest to the mean 5-year 10 A.M. IOP. This enabled us to approximate a 24-h curve that was roughly similar to the patient's 24-h curve on their routine prescribed treatment.
All 10 A.M. visits during the 5-year follow-up period were analyzed for nonprogressed patients and up to the time of progression for patients in whom progression occurred. Analysis stopped with progression to gain an understanding of the 24-h pressure curve characteristics that led to progression.
During the 5-year follow-up period, progression was determined from the patient records based on clinical interpretation by each individual investigator. Generally, criteria for progression were an increase in thinning of the neural rim or a worsening of glaucomatous visual field loss. In patients with total glaucomatous cupping and diffusely depressed visual fields, worsened visual acuity was also used as a sign of progression. 9 Typical exam techniques were used including both sterioptic Volk lens and disk photograph examinations. Automated threshold techniques were used for the visual field examination. The chronic pressures and medical history collected from patient documents were entered into an Excel spreadsheet.
Statistics
PRN Pharmaceutical Research Network, LLC, analyzed the data. All data analyses were 2-sided and had an α-level of 0.05. The eye with the highest IOP at baseline was selected from the database to be used for this study. If the IOP of both eyes was the same at baseline, then the right eye was selected. All analyses were between progressed and nonprogressed groups of patients.
The primary efficacy variable was the mean 24-h peak IOP, which was analyzed by a 1-way ANOVA test for repeated measures. 10 Secondary efficacy variables, additional mean pressure evaluations, and patient age were also analyzed by a 1-way ANOVA test. 10 Gender and patient history parameters were analyzed with a Chi-square test. Race and the number of patients progressing or nonprogressed at an individual pressure level and the number of patients with a peak pressure at each time point over the 24-h curve were described and not statistically analyzed.
A multivariate regression analysis was performed to access the risk factors associated with glaucomatous progression (JMP, Version 5, Cary, NC). 11 This test was used to explore demographic, clinical, and treatment features as risk factors for progression.
Results
Patients
Patient baseline characteristics for progressed and nonprogressed patients are shown in Table 1. There were no statistically significant differences for any baseline patient characteristic evaluated in this study (P>0.05). In total, 325 patient records were screened for this study from the 24-h pressure curve databases, but 174 were excluded based on criteria specified in the Materials & Methods, thus leaving 151 to be included in the analysis.
Patients (percent).
T-FC, timolol fixed combination.
Peak IOP
The mean 24-h peak pressure was 19.9±2.7 mmHg for progressed and 18.3±2.0 mmHg for nonprogressed patients (P<0.001). Table 2 shows the number of patients who had their peak IOP at each 24-h time point in both progressed and nonprogressed groups. Peak (highest point in the range of pressure curve) occurred most frequently at 10 A.M. However, 31 (20%) of all patients and 9 (17%) of progressed patients had their peak pressure at a time point(s) only outside normal office hours (10 P.M., 2/6 A.M.). For patients with controlled mean pressures ≤18 mmHg, the times of the peak pressure differed little from the entire patient group.
Patients (percent).
Table 3 shows the number of patients with their peak 24-h pressure at 1 of 3 daytime time points, or at a combination of daytime time points (10 A.M., 2/6 P.M.). The table also demonstrates the number of patients who had their 24-h peak pressure measured above their peak daytime pressure. Measuring the pressure at all 3 daytime time points identified approximately 80% of the 24-h peak pressures. Adding 2 mmHg to this peak pressure estimated the highest potential 24-h peak pressure for 98% of all patients and 96% of progressed patients. The percentage of patients who had their 24-h peak identified essentially did not change when only patients were evaluated who had their mean pressures controlled to <18 mmHg.
Patients (percent).
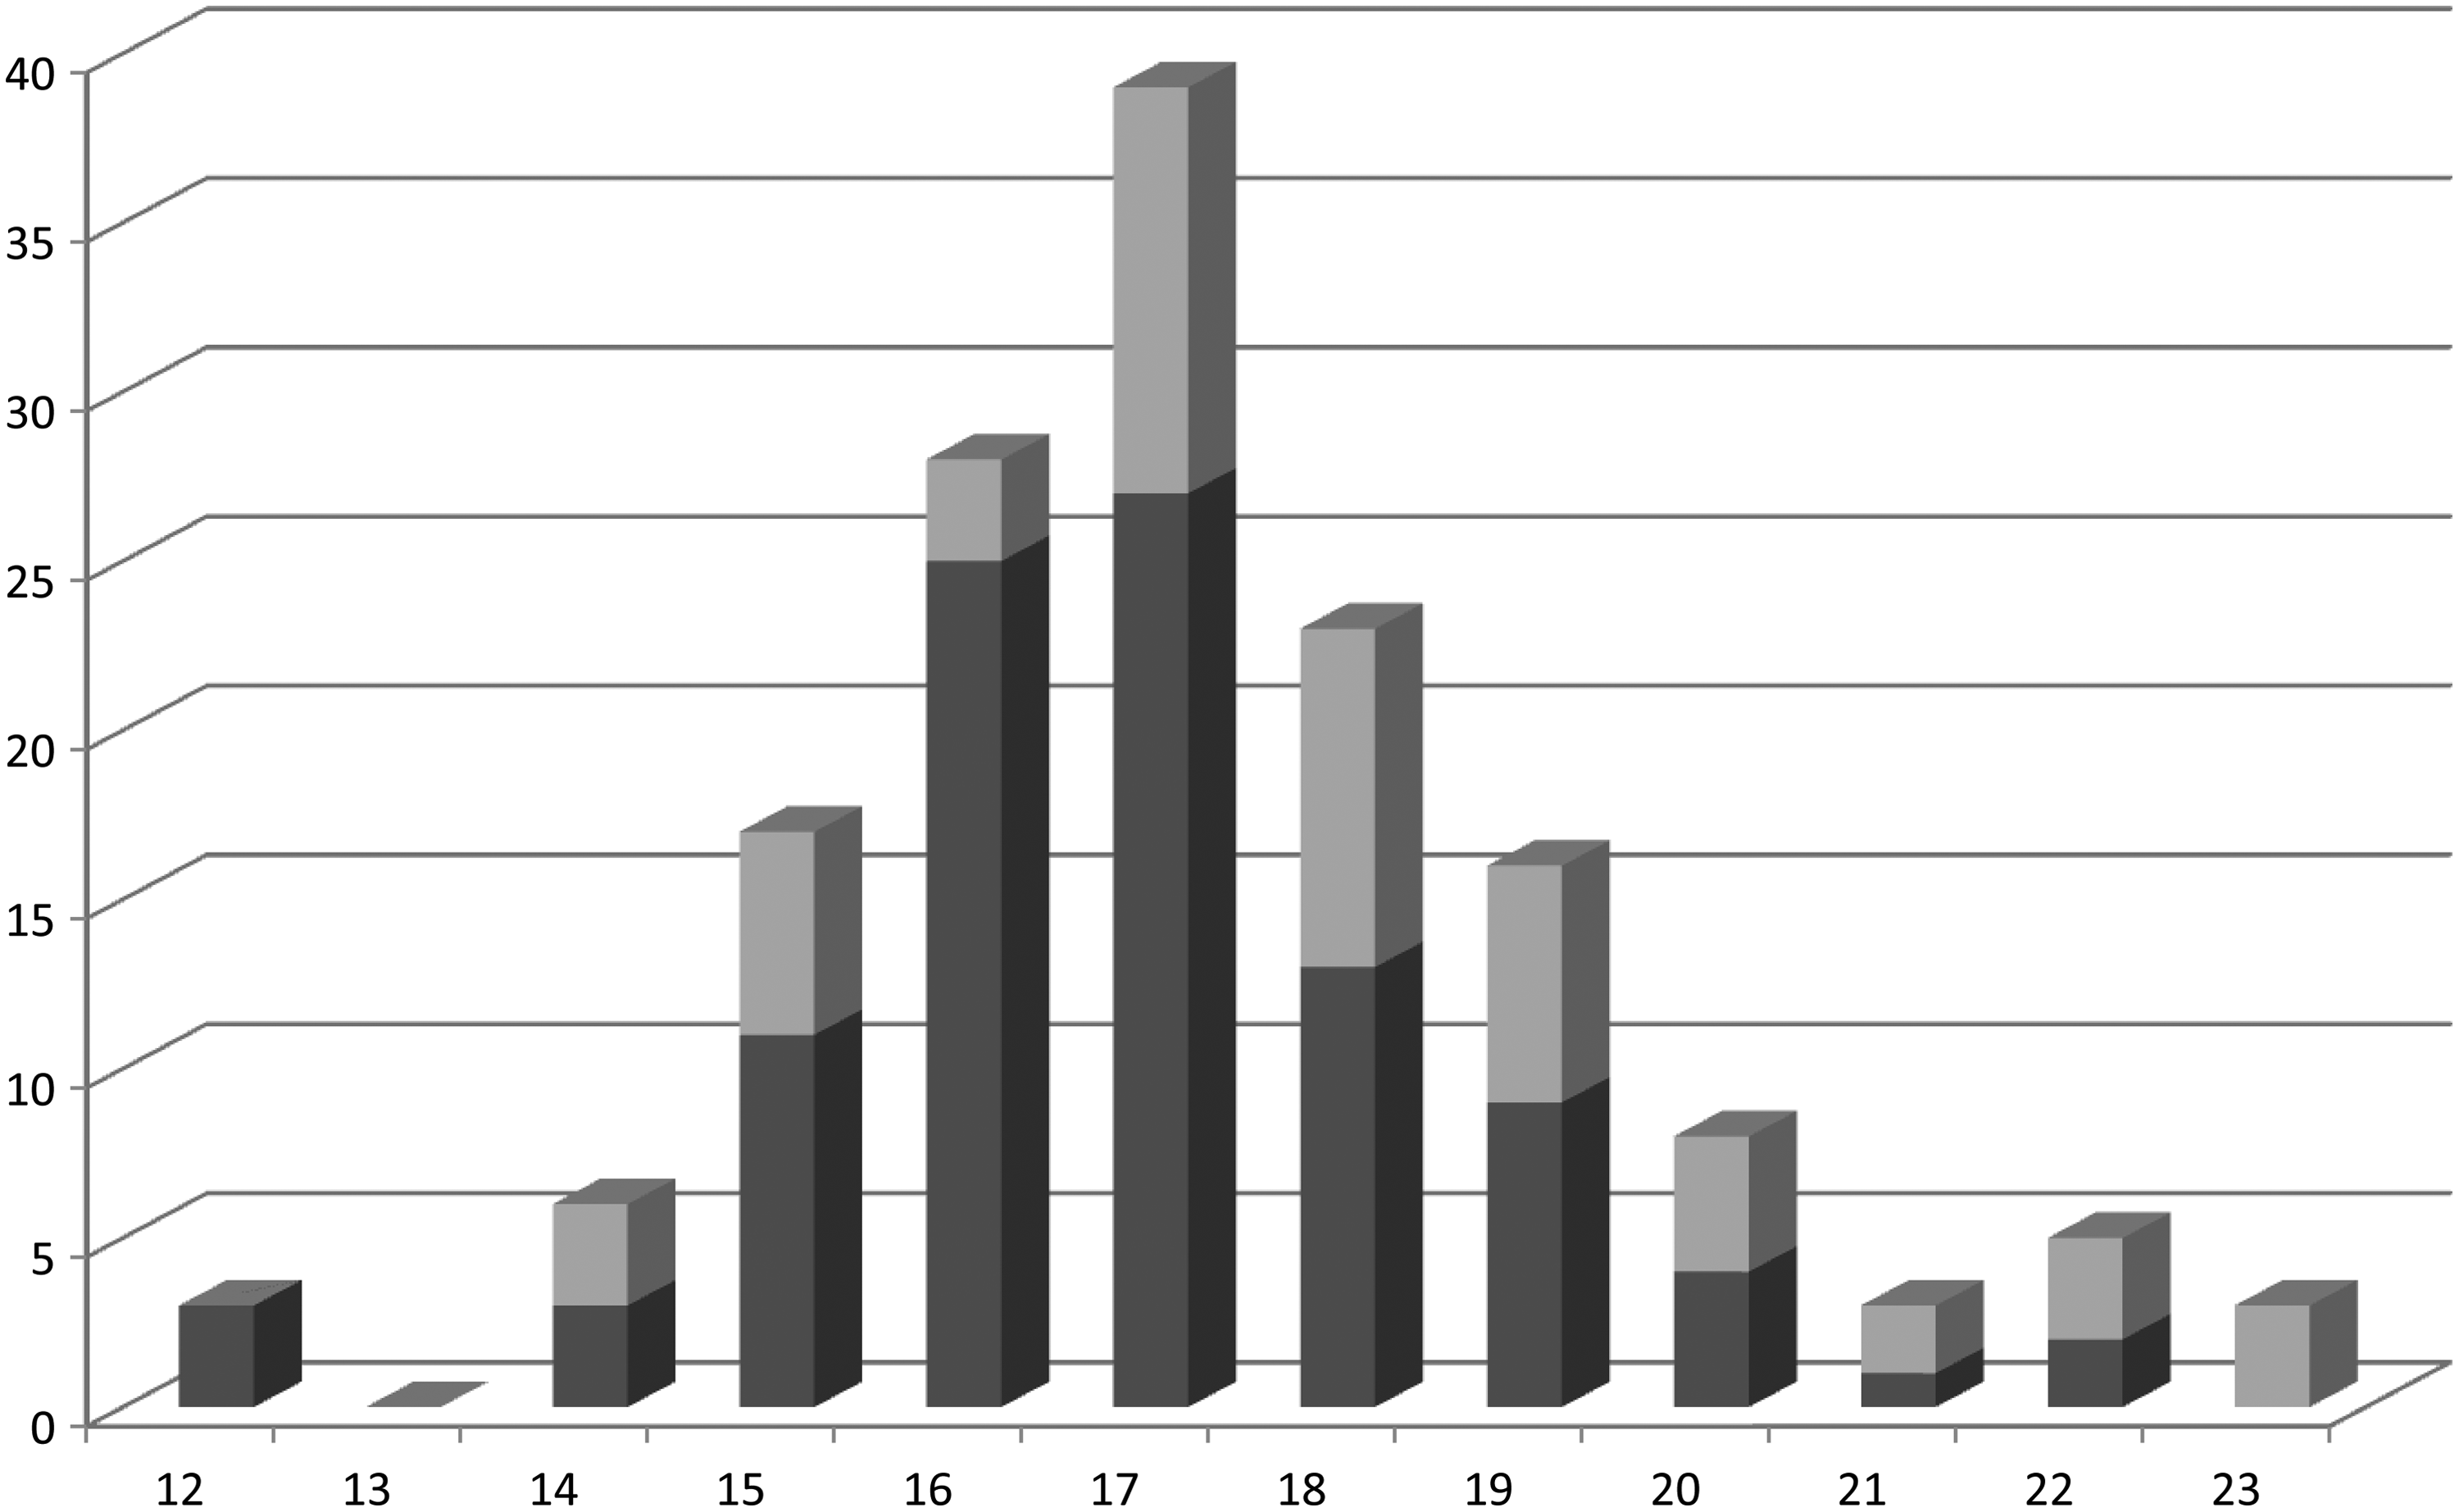
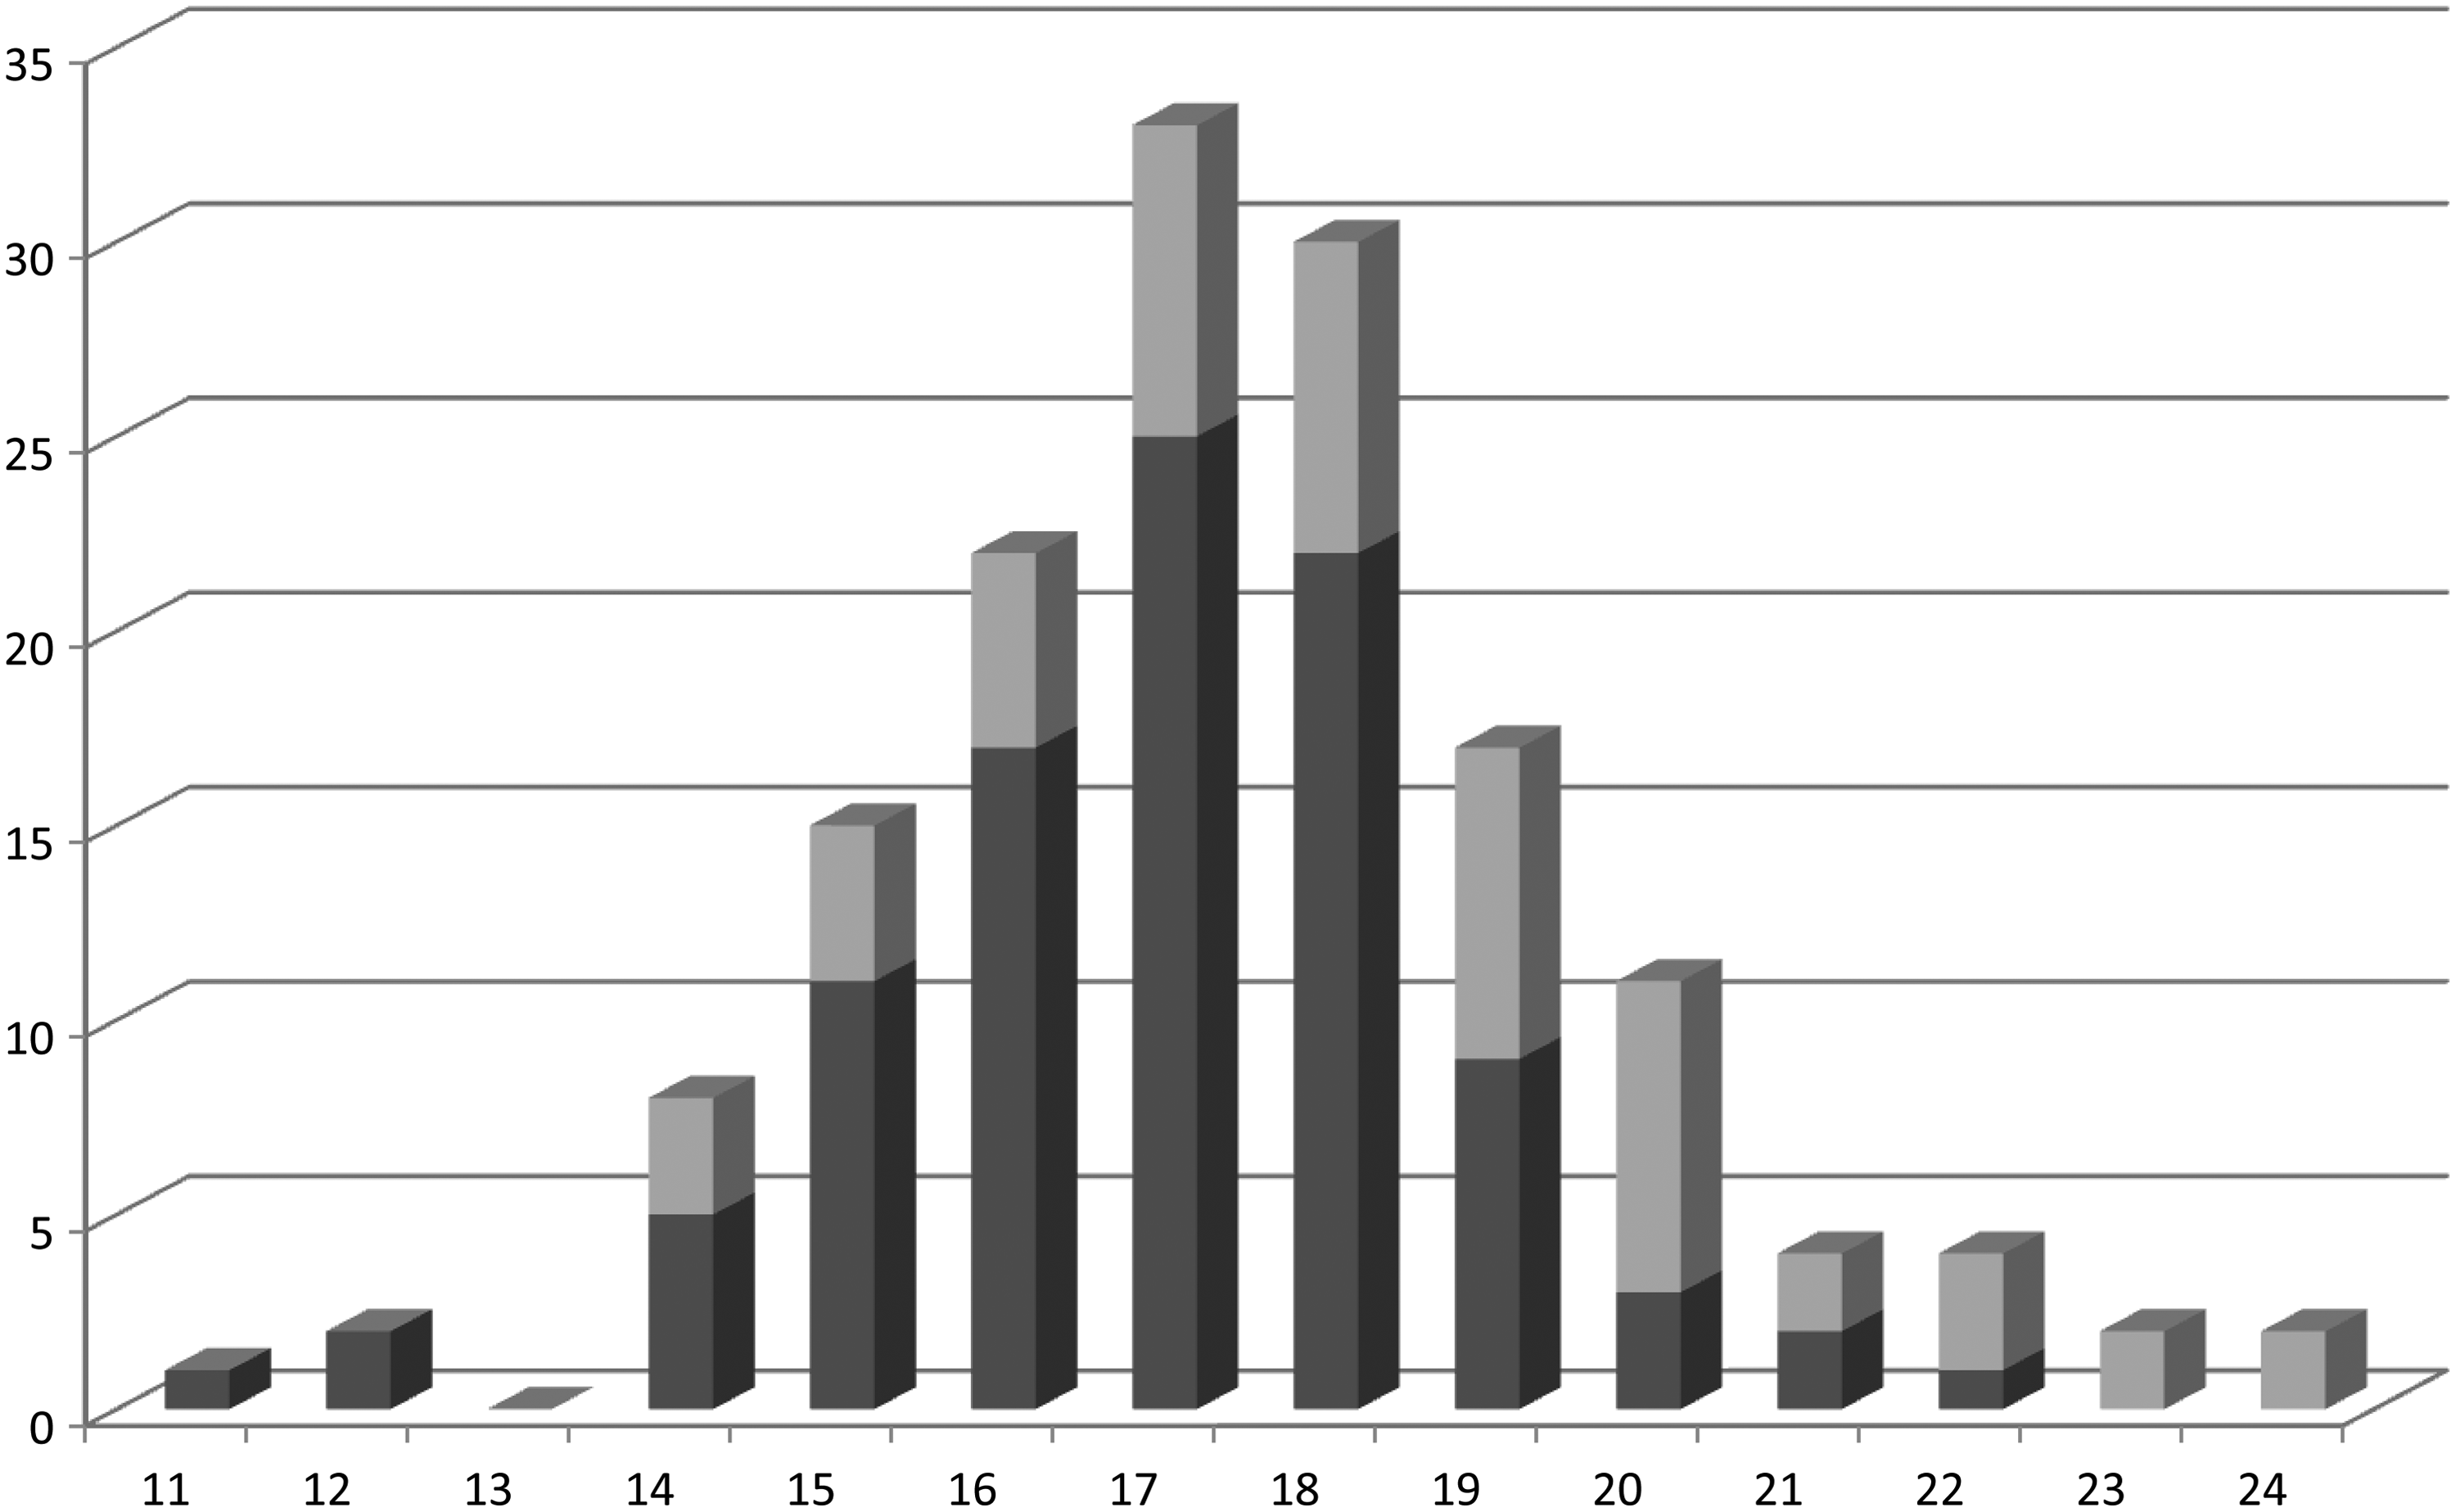
The number of progressed and nonprogressed patients over 5-years at each 24-h peak pressure is shown in Fig. 1 and for daytime peak in Fig. 2. Patients who had a peak 24-h or daytime pressure of ≤18 mmHg generally progressed less (both 78% nonprogression) than those with a higher pressure.

The number of patients who progressed (gray) and nonprogressed (black) over 5-years at each peak pressure for the 24-h curve.

The number of patients who progressed (gray) and nonprogressed (black) over 5-years at daytime time points for the peak intraocular pressure.
Mean IOP
The average IOPs at each time point and for the 24-h pressure curve are shown in Table 4. Progressed patients showed a significantly higher pressure over the complete 24-h curve (P=0.004) and at each time point (P≤0.01) except at the 10 P.M. (P=0.15) and 2 A.M. (P=0.10). The 10 A.M. time point demonstrated the greatest separation between the 2 groups (P<0.001).
mmHg±standard deviation.
The number of progressed and nonprogressed patients at each mean pressure for the 24-h curve is shown in Fig.3 and for the daytime time points (10 A.M., 2/6 P.M.) in Fig. 4. In general, patients with a mean daytime pressure ≤18 mmHg, and 24-h curve pressures of ≤16–17 mmHg demonstrated approximately 75% nonprogression rates over the 5-year follow-up.
The number of progressed (gray) and nonprogressed (black) patients for the mean intraocular pressure for the 24-h curve.
The number of progressed (gray) and nonprogressed (black) patients at each mean pressure as measured from the daytime time points (10 A.M., 2/6 P.M.)
Further, using the daytime peak pressure, together with the daytime mean pressure, to better identify progressed patients added little (78% nonprogression rate) beyond those found by the daytime mean pressure alone (75% nonprogression rate).
Regression analysis
A multivariate regression analysis showed that only 24-h peak IOP was an independent risk factor for progression (P=0.002; Table 5). Nonsignificant variables were age, gender, mean daytime IOP, geographic location, and all individual medicines.
Discussion
The purpose of this study was to evaluate the effect of the 24-h peak IOP in the progression of POAG and the 24 h time points that best predict peak pressure.
This study showed that peak pressure may be an independent risk factor associated with progression. This is consistent with some past research, but not with other studies which have indicated that peak pressure was not an independent risk factor for progression.1,2,4,12,13
Patients with a peak 24-h pressure of ≤18 mmHg had a 78% nonprogression rate. The peak pressure occurred most frequently at the 10 A.M. time point. However, 20% of all patients, and 17% of progressed patients, had their peak pressure at a time point(s) only outside normal office hours (10 P.M., 2/6 A.M.). This is consistent with several past studies, which indicated that peak pressure may fall out of normal office hours.5,14–16
Unfortunately, the 24-h peak pressure has been difficult to use clinically for several reasons including that no treatment goal has been identified for this parameter and measuring pressures over the 24-h curve is logistically difficult. We attempted to make peak pressure more usable by identifying a target pressure for the daytime peak pressure that would assist the physician in using this parameter clinically without having to measure pressures during night-time hours.
To the authors' surprise, in terms of numbers of patients, for those with a with a peak pressure ≤18 mmHg, the peak daytime pressure provided the same nonprogression rate (78%) as the 24-h peak, and essentially the same as the mean daytime pressure (75% nonprogression rate). The narrow difference between the value of 24-h and daytime peak pressures was supported by our finding that if 2 mmHg was added to the daytime peak pressure, then it identified the highest potential 24-h peak pressure for 98% of all patients and 96% of progressed patients (Table 3). In contrast, the narrow difference between the daytime mean and peak pressures was supported by our finding that using these 2 parameters together did not help discriminate further between progressed and nonprogressed patients.
This study also showed, similar to several past investigations, that mean IOP is higher long term in patients with progressed POAG.6,13,17,18 In addition, similar to several previous studies, the daytime mean pressure level that best prevented progression was approximately ≤18 mmHg (75% nonprogression). 6
In contrast, the mean 24-h pressure that best prevented progression was approximately 16–17 mmHg (75% nonprogression). This may have resulted, because daytime pressures are typically higher than night-time pressures, when measured by Goldmann tonometry, and the night-time pressures may have reduced the 24-h average. Interestingly, mean night-time pressures at 10 P.M. and 2 A.M. did not differentiate between progressed and nonprogressed patients. 19
What may our data mean clinically? First; the 24-h and daytime peak pressure (78% nonprogression rates) and for the mean daytime pressure (75% nonprogression rate) that best discriminates between progressed and nonprogressed patients appears to be approximately ≤18 mmHg. Second, using the daytime peak pressure to further refine the daytime mean pressure in patients controlled to ≤18 mmHg adds little in identifying more nonprogressed patients (only 78% nonprogression rate using both the daytime mean and peak pressures together). Third, measuring the pressure during night-time hours finds only a higher peak in 20% of cases than measuring daytime pressures at 10 A.M., 2/6 P.M. Further, the daytime peak pressure generally will be within 2 mmHg of the 24-h peak. Since the 24-h peak pressure that bests discriminates between progressed and nonprogressed patients appears to be approximately the same as the daytime peak pressure, the 24-h pressure curve probably should not be routinely measured unless the physician is suspicious of an unusually high night-time pressure (eg, unexplained progression at seemingly well-controlled daytime pressures). Fourth, although a patient might have their mean daytime pressure controlled to ≤18 mmHg, some patients may not tolerate a peak above 18 mmHg at any daytime time point. These findings are consistent with the AGIS study, which found little progression at approximately a mean pressure of 13 mmHg and a peak pressure below 18 mmHg at all times. 3 Last, even pressures treated to ≤18 mmHg failed to prevent progression in all cases. This indicates that further risk factors most likely remain to be elucidated, or the need for better pressure characteristics (ie, lower mean and peak 24-h pressures), to explain why some patients still progress at seemingly well controlled pressure levels. 3
This study suggests that daytime peak IOP may be clinically important in predicting long-term glaucomatous progression. Daytime peak pressure may assist, as much as daytime mean pressure and, in most cases, 24-h peak pressure, in helping to guide long-term treatment in POAG. An important contribution was recently made by Moodie and coworkers, who compared the value of 24-h pressure monitoring versus daytime pressure monitoring in patients treated for progressing glaucoma. 20 These authors also reported that 24-h monitoring offered little advantage over day time phasing in the identification of IOP fluctuation, or peaks. 20
Although this study utilized the largest 24-h patient data described to date, to our knowledge, the sample size still was relatively small. Further, our study did not evaluate mean and peak pressure in a prospective manner. Other risk factors probably still exist (eg, cardiovascular disease, age, and ocular blood flow status) that might further help differentiate patients who will progress, or remain stable long term. Our results examined only POAG and may not apply in exfoliative, juvenile, or closed-angle glaucomas. More research is needed to more fully determine how primary open-angle patients should be treated long term.
Footnotes
Author Disclosure Statement
No authors have proprietary interests to declare. This study was supported in part by a research grant from the Investigator Initiated Studies Program of Merck & Company, Inc., Whitehouse Station, NJ. The opinions expressed in this article are those of the authors and do not necessarily represent those of Merck & Company, Inc.