
Abstract
Abstract
A cataract is a clouded area of the eye, which impairs vision. Cataracts can be caused by a natural hardening of the lens in the elderly, or may be the result of eye injury. However there is a treatment by extracapsular surgery, almost 50% of operations are followed by another posterior capsule opacification. This secondary cataract is due to abnormal cellular proliferation. Pharmacologic inhibition of this cellular proliferation would be a very promising treatment. The objective of our study is to test some antiproliferative drugs, less toxic than those currently used such as 5-FU or mytomycin C. We have investigated the in vitro effects of several molecules (V0 and its derivatives) on a proliferative human lens epithelial cell line (SRA 01/04). During a first step, we have measured the IC50 of each molecule. After this first screening, we have studied the kinetic of the cell growth with or without the molecules at different concentration. Then, flow cytometry was used to determine the phase of the cell cycle at which the proliferation stopped. This study has shown that 3 molecules V19, V1, and A190 have an interesting profile in vitro and were selected to analyze their mechanism of action.
Introduction
One approach to reduce PCO is to inhibit lens epithelial cell proliferation. Several experimental studies have been made by using immunotoxin9–11 or pharmacologic agents like heparin,12–14 daunomycin,15,16 colchicines, 17 mytomycin C, and 5-fluorouracil18–20 being usually used in cancer chemotherapy. 14 The experiment using the pharmacologic agents like heparin has shown that cryo treatment, combined with intracameral administration of heparin during surgery, reduced opacification by 20%.12,13 The experiment with colchicine showed that slow release of colchicine reduces PCO formation in the rabbit but it needs more information and precision. 17 The Fernandez team showed in 2004 that distilled water and 10 mM EDTA treatments were the most efficient in retarding the appearance of PCO. 21 So the actual treatment of PCO is not clear and efficient to prevent PCO. According to the information, new treatment approaches need to be considered.
In this context, the purpose of our study is to investigate the biological activity of 18 new molecules (V0 and its derivatives). These synthetic molecules are obtained after chemical modifications and take place to the triazine family of molecule. One of them is well known to its activity in cancer: A190. This preliminary study has shown 3 molecules that drive cells to mortality. Pathological cells are induced to terminal differentiation state (G1-DT phase); then, the cells die by anoikis.
Methods
Chemical substances
All substances (V0 and derivatives) have been dissolved in water for injection at 1 mg/mL before use.
Cell line and cell culture
Human lens epithelial (HLE) cell line, SRA 01/04, which was established by transfection with large T-antigen of SV40, 22 was cultured in antibiotic-free Dulbecco's modified Eagle's medium (DMEM) (Biochrom KG) supplemented with 4% fetal calf serum (Corning Costar). Incubation was carried out at 37°C in a humidified atmosphere with 5% CO2.
Cytotoxic activity: IC50
The V series were tested for their cytotoxicity against the lens cell line SRA 01/04, maintained an exponentially proliferating culture state, as described previously. Experiments were performed in 96-well microtiter plates (6×10⁴ cells/mL). Cytotoxicity was measured by a colorimetric assay based on conversion of tetrazolium dye [MTT: 1-(4,5 dimethylthiazol-2-yl)-3,5 diphenyltetrazolium bromide] to a blue-black formazan product, using live mitochondria at 570 nm. 23 Optical density was read on a Titertek Multiskan MKII. Cells were exposed to graded/graduated concentrations of drugs for 72 h. Results were expressed as IC50, the concentration required to reduce cell growth by 50%, measured by optical density. Cells were incubated with 3 different concentrations of each substance (30, 10, and 3.3 μg/mL).
Cytostatic determination: continuous drug exposure
Experiments were performed in 96-well microtiter plates (6×10⁴ cells/mL). Cells were incubated in the same culture conditions as described previously, and in the presence of 4 different concentrations of each substance (VO, V1, V6, V12, and V19). Cell growth was evaluated, as described previously, initially and at 24, 48, and 72 h thereafter. Six determinations were performed for each concentration. Percentage cell growth was estimated according to the following formula:
where
OD 570=density optical at 570 nm
X=time of determination
Control=cells not treated by molecules but submitted to each step of the experimentation
Cytostatic irreversible effect: discontinuous drug exposure
In this experiment, cells were incubated for 72 h in 96-well microtiter plates (6×10⁴ cells/mL) in the previously mentioned culture conditions and with or without drug. After removal of medium, cells were washed using a phosphate-buffered saline solution to eliminate any drug traces. Then, 100 μL of fresh culture medium containing no drug was added to cells. Cell growth was evaluated, using the same method as already described, on the same day (considered as day 0) and after 24, 48, and 72 h.
Flow cytometry assay
For DNA staining, 6×10⁴ cells were cultured in 6-well plates with or without the tested products. Determinations were performed after 72 h. DNA staining was carried out using the technique of Vindelov. 24 After removal of the culture medium, 1 mL of Vindelov solution [0.01 M glycine/NaOH (pH 10), 9.6×10⁻⁵ M propidium iodure, 0.1 M Nonidet P40, 700 IU ribonuclease, 0.3M NaCl; diluted 1:2 (v/v) in phosphate buffered saline solution] was added to plates, which were left in darkness at 4°C for 1 h. The cell suspension thus obtained was filtered through a nylon mesh (50 μm) and analyzed. The DNA content of nuclei was measured by FACScan flow cytometer (Becton Dickinson). Propidium iodure was excited (488 nm), and flow resonance was measured at 585 nm. To eliminate doublet nuclei for DNA area histogram analysis, the DNA peak versus the DNA area was selected by gating on the cytogram.
Optical microscopic analysis
For analysis by light microscopy, cells were cultivated in the flask for 72 h in the presence of a molecule and in the presence of an implant impregnated or not with the molecule. The actual analysis is performed using an inverted microscope (Olympus) and followed by a photographic shoot. During this observation, the appearance of cytoplasmic vacuoles in treated cells demonstrates the effect of treatment. The appearance of these vacuoles is accompanied by a decrease in the total number of cells compared with the control that is dose dependent.
Results
Cytotoxic activity
For each tested molecule, the concentration required to reduce cell growth by 50% (IC50) was determined and results are shown in Table 1. Among these 18 substances, only 6 molecules—V0, V1, V6, V12, V19, and A190—have been selected, based on the facts that their IC50 is below 30 μg/mL and that their structures are more original than the others (Fig. 1).
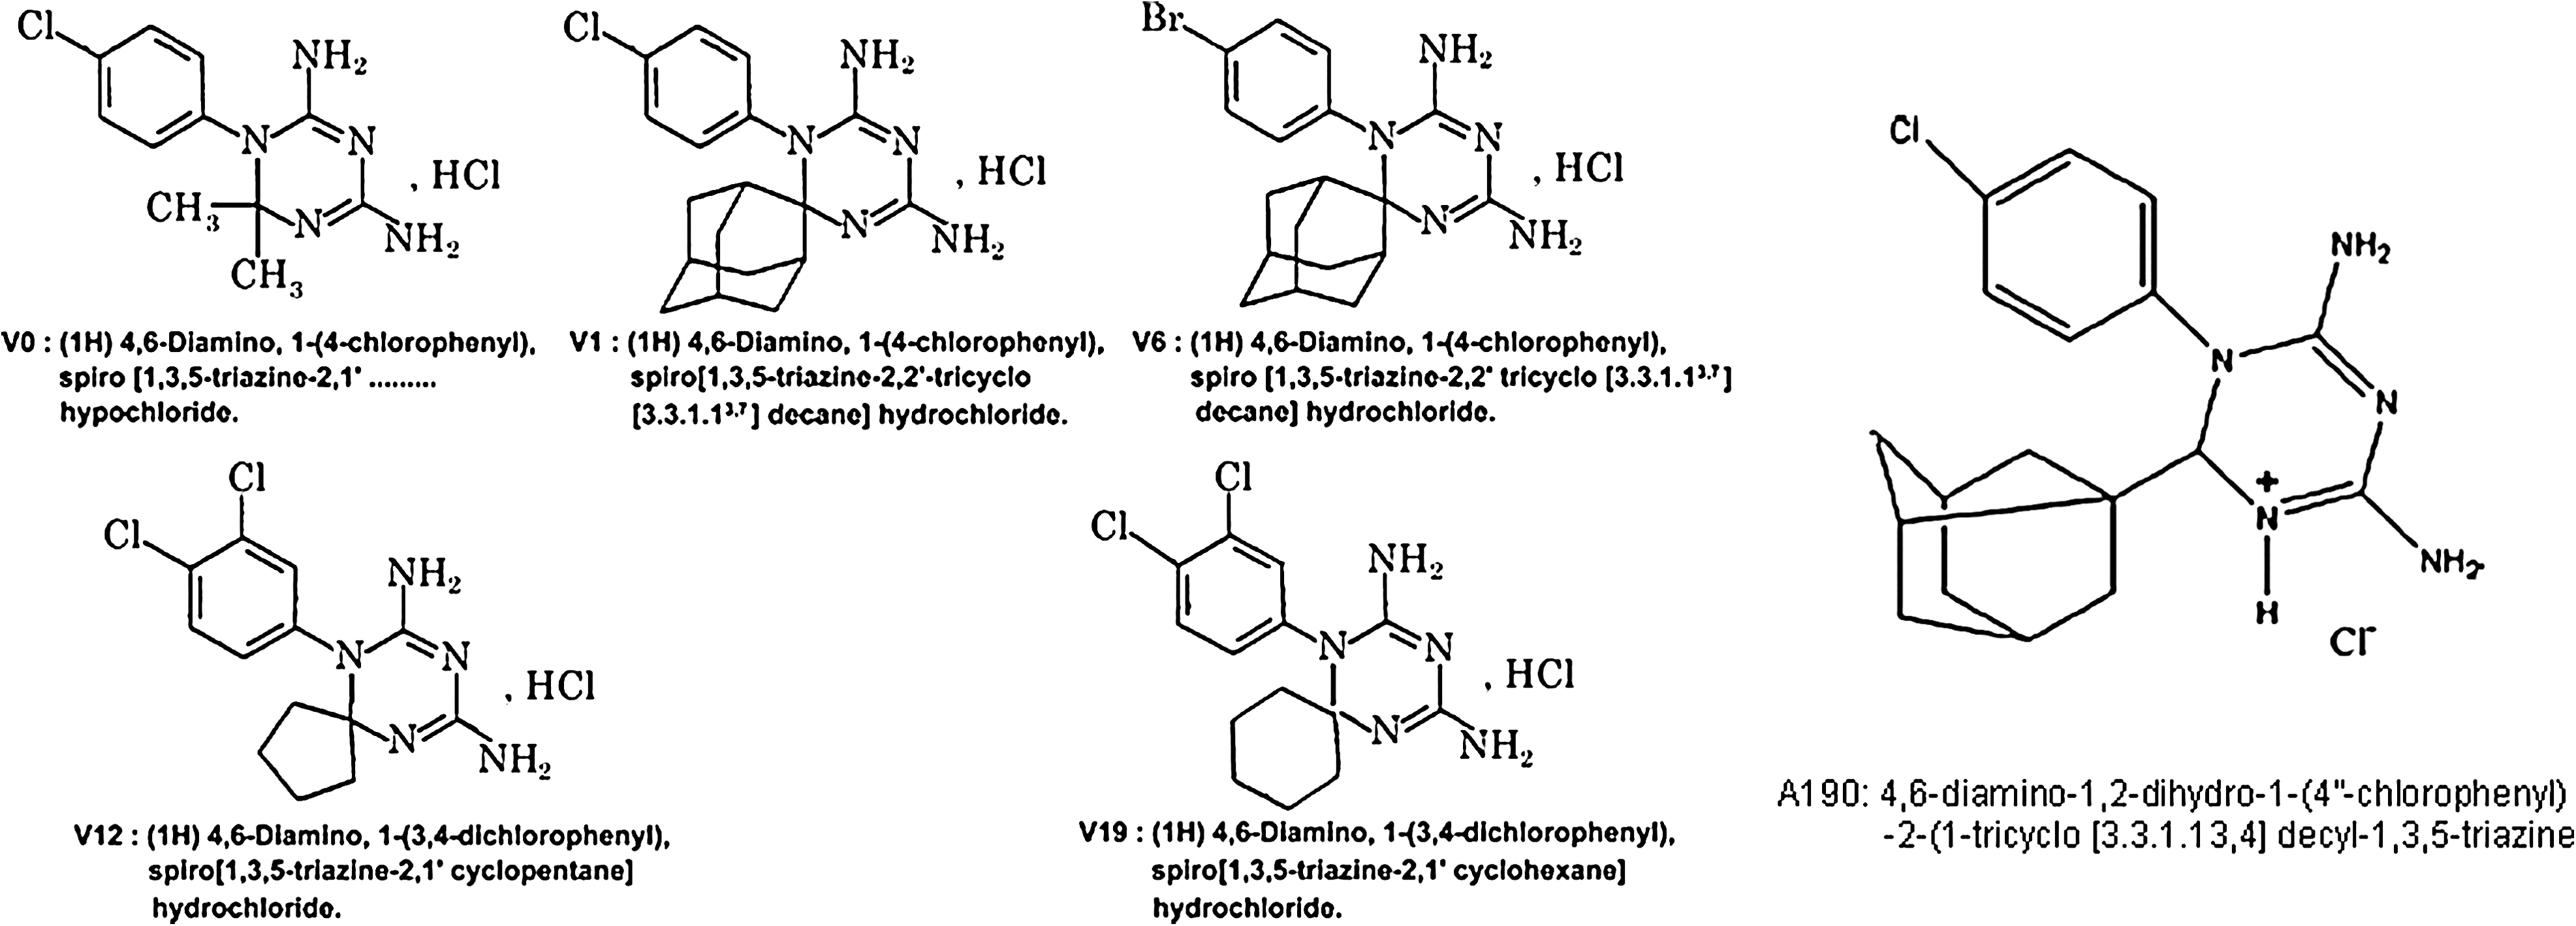
Chemical structure of V0, V1, V6, V12, V19, and A190.
Cells were treated with 3 concentrations of each molecule for 72 h. OD was, then, measured at 570 nm.
Cytostatic determination: continuous drug exposure
The effects of continuous treatment on HLE cell line are shown in Fig. 2. Nontreated cells show a classical kinetic pattern. V0, V1, and V6 treatments provoke a decrease of proliferation after 48 h at all concentrations. Whatever be the applied V12 concentration, the cell growth attains a plateau phase. In the presence of V19 and A190, proliferation slows down, proportionally to applied concentrations. The inhibitory effects of all molecules on SRA 01/04 growth are dose dependent.
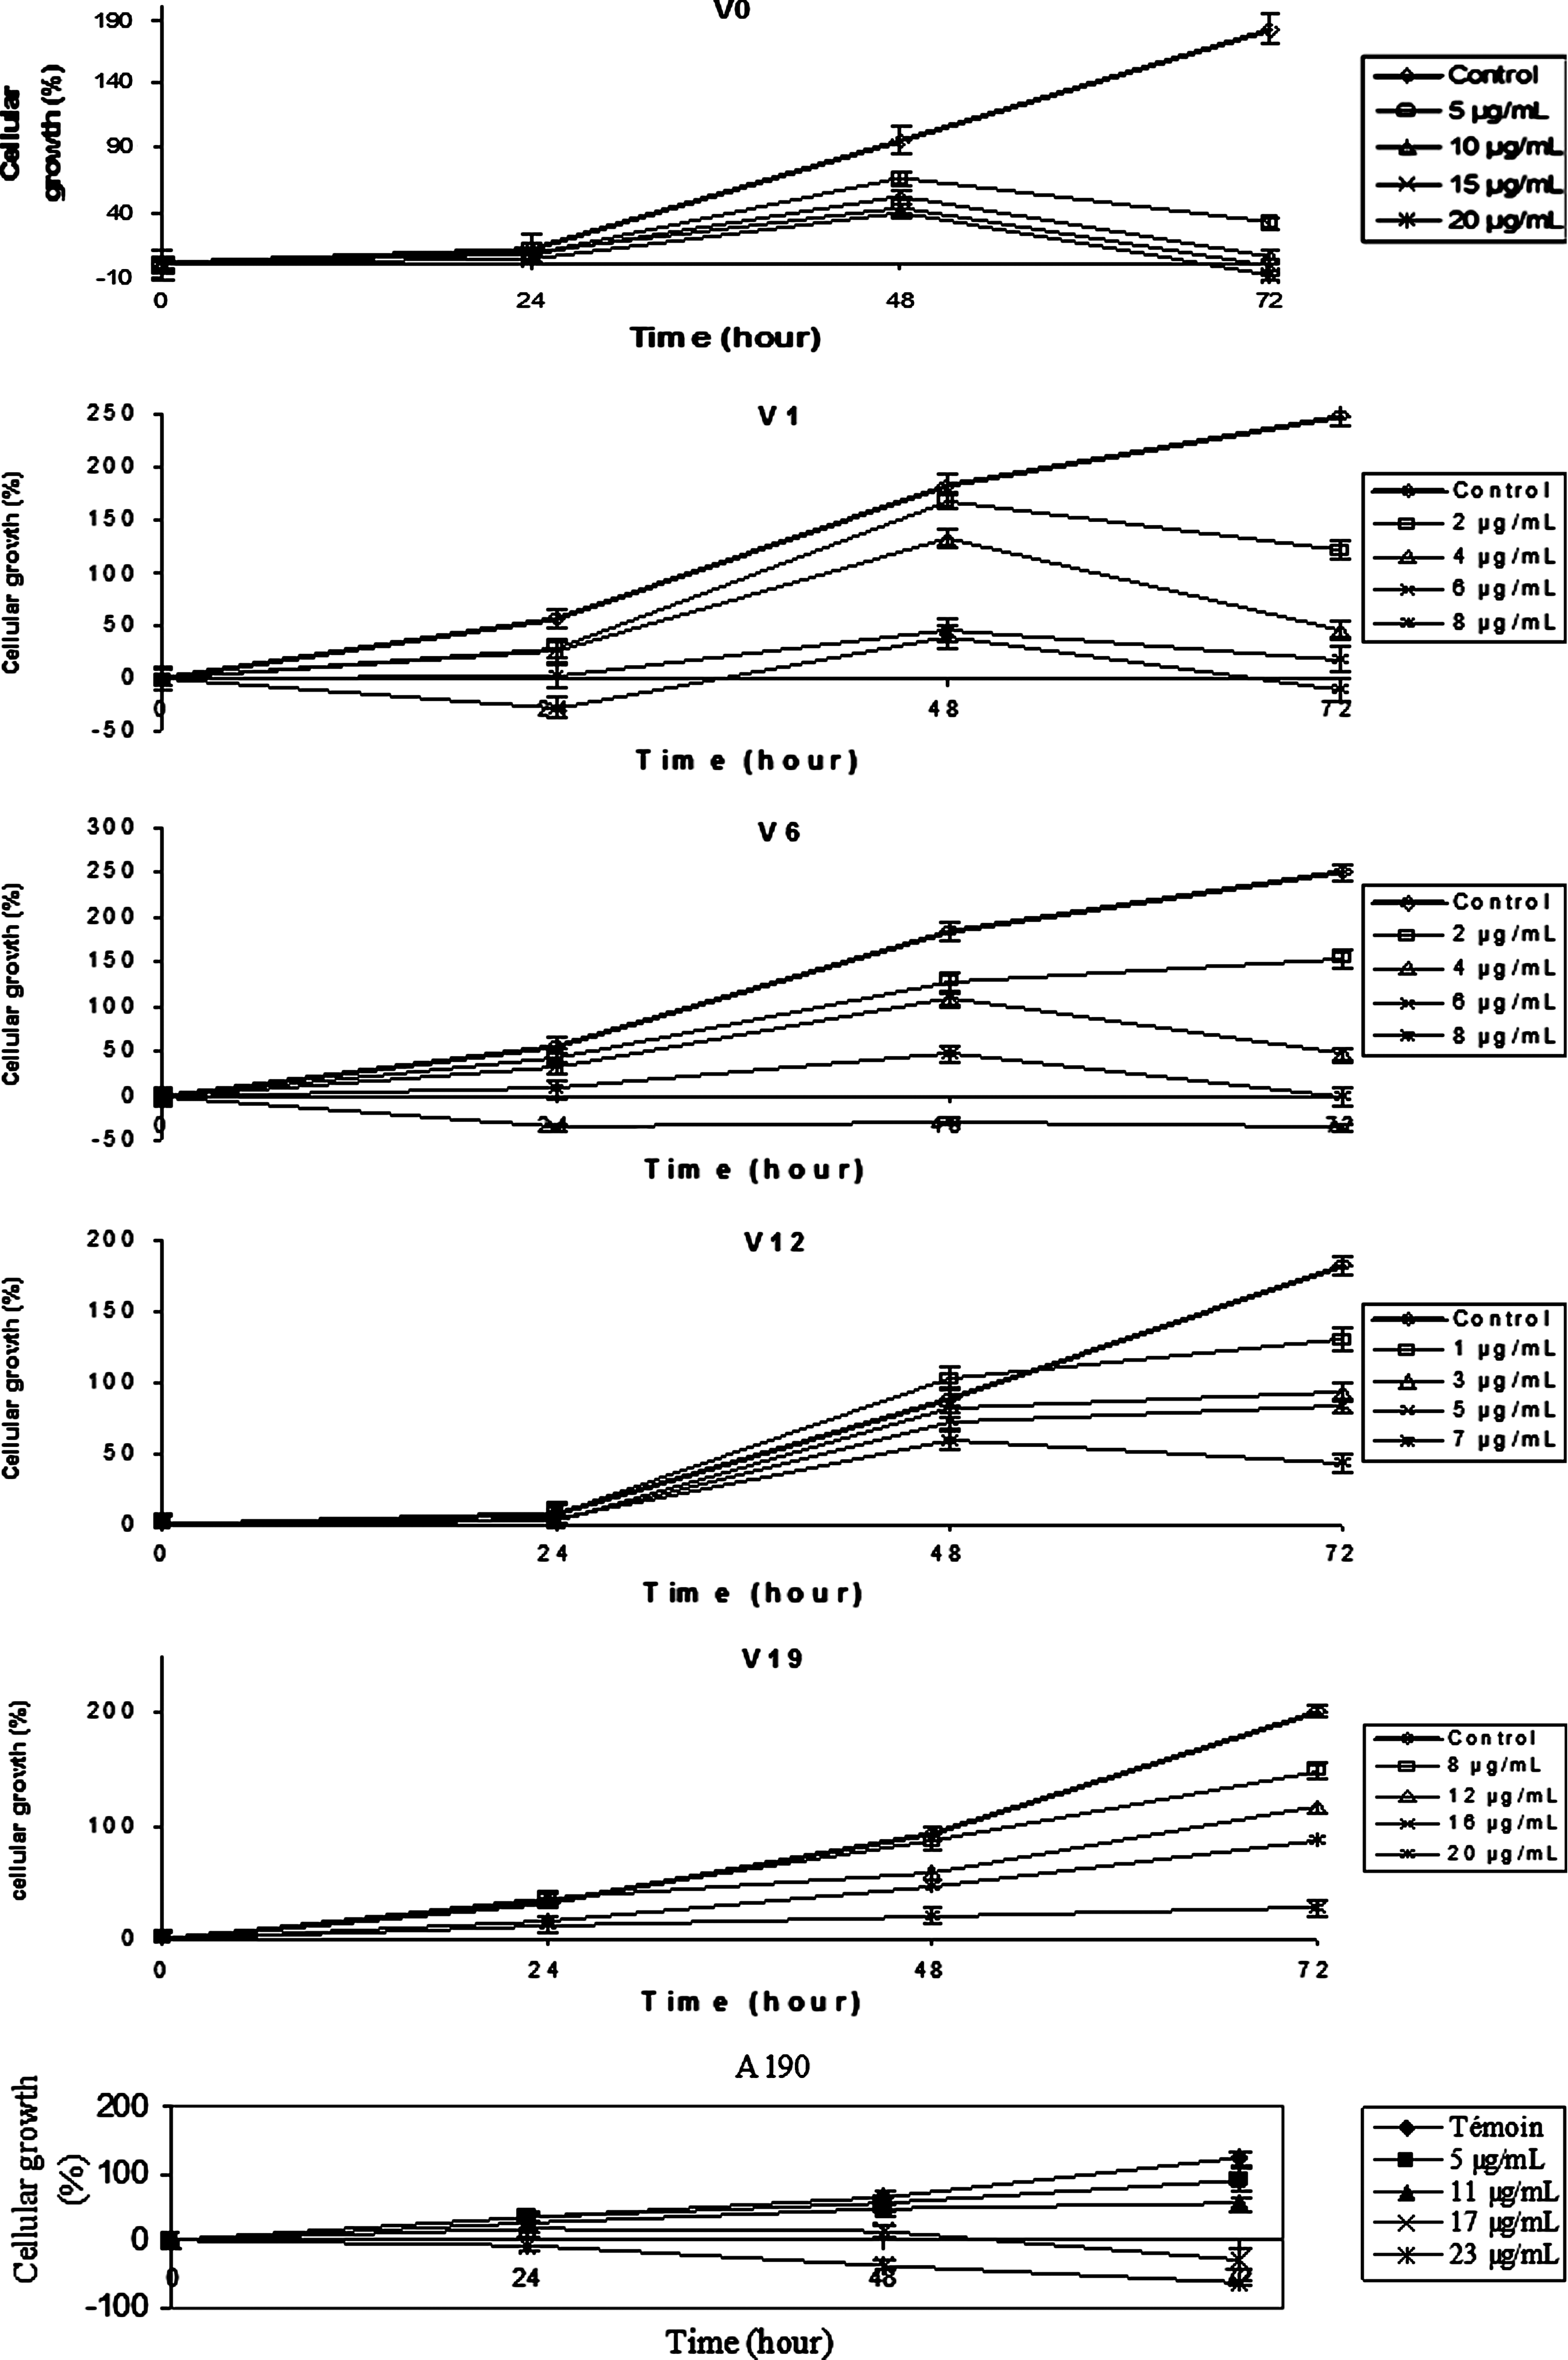
Effect of different drug molecules on SRA 01/04 cell line: growth kinetics after continuous exposure to drug at different concentrations after treatment with continuous drug exposure.
Cytostatic irreversible effect: discontinuous drug exposure
Figure 3 shows that antiproliferative effect was irreversible for V0 at all concentrations (removal of drug after 72 h of treatment did not induce treated cells to recover normal growth) and reversible at all concentrations for A190. Following V1, V6, V12, and V19 treatments, the cells regrow for low concentrations. There is a plateau phase after V1, A190, and V19 treatments at the respective concentrations of 0.77, 5, and 16 μg/mL. After treatment at the highest concentrations, all cells had died. Therefore, we did not observe any cell growth recovery. For further experimentations, we have chosen 3 molecules: the less cytotoxic molecule (V19, IC50: 16.9 μg/mL) and the most cytotoxic molecule (V1, IC50: 2.7 μg/mL) and an intermediate molecule (A190, IC50: 7.1 μg/mL). The majority of cells are phase-dependent blocked and then they cannot return in the cell cycle with these 3 molecules. To verify this, we investigated their action on the cell cycle. But before this, the cells were cultivated with an intraocular implant (Fig. 4). The cells were cultivated for 72 h with an intraocular implant impregnated by A190 molecule at a concentration of 10 μg/mL (Fig. 4). The profile indicated cell destruction in the presence of the implant without A190 after 72 h of treatment. Then the effect was increased by the presence of the molecule.

The graph depicted the growth pattern of SRA 01/04 cell line in a drug-free medium with populations pretreated for 72 h in the presence and absence (control) of drug molecules.
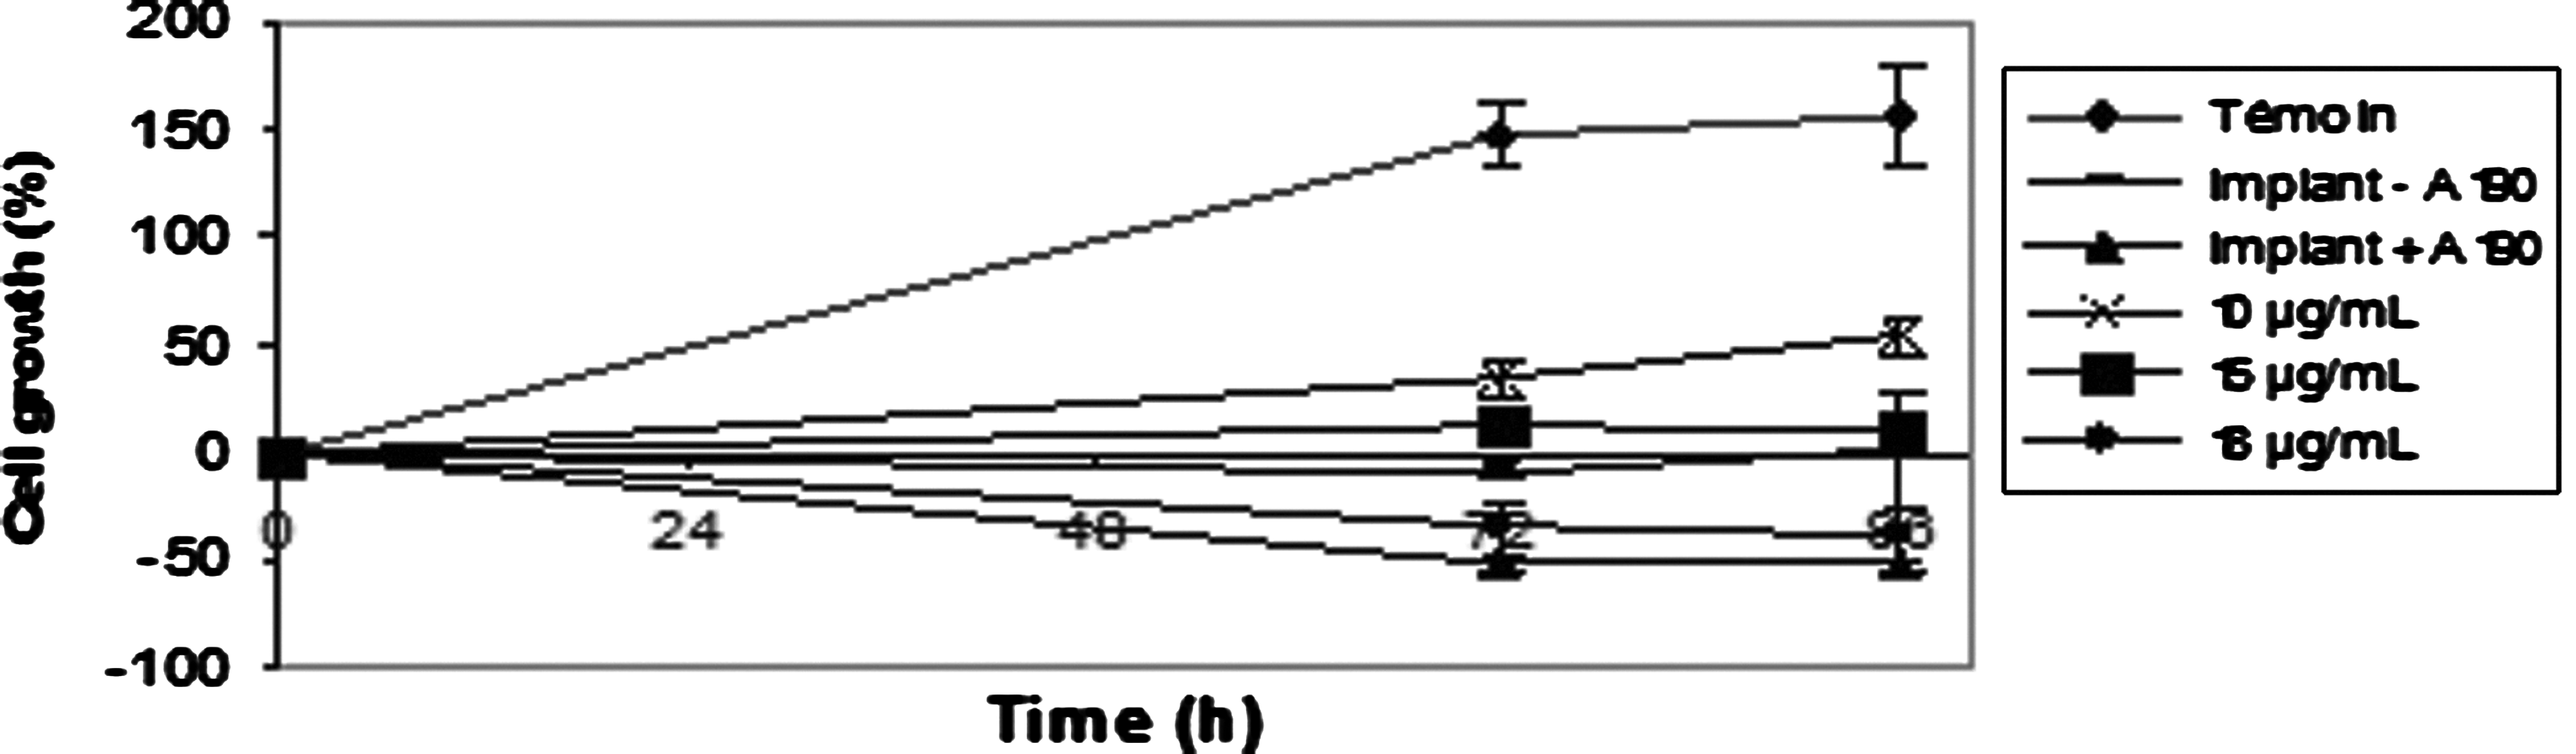
Cytotoxicity determination with continuous drug exposure of A190 and in the presence of an implant impregnated or not with A190 on SRA 01/04 cell line.
Flow cytometry assay
The effects of V1 on cell cycle after 72 h of treatment are shown in Fig. 5. After treatment with V1 molecule at 0.5 μg/mL, cells are blocked in G1 phase of their cycle. Indeed, an increase of cell percentage in G1 phases is observed (55.3%–>58.3%). The increase of percentage of G2/M phase is due to a cell block with 4n chromosomes in G1 phase. The block in G1 phase of cell cycle is less important after treatment at 1.5 μg/mL as cells die due to the cytotoxic effect of the molecule after 72-h treatment, but the remaining cells observed are over the G1 phase. The only cell block observed is at the stage of 4n chromosome cells at G1 phase of their cycle. So, V1 molecule blocks the cell cycle in G1 phase.
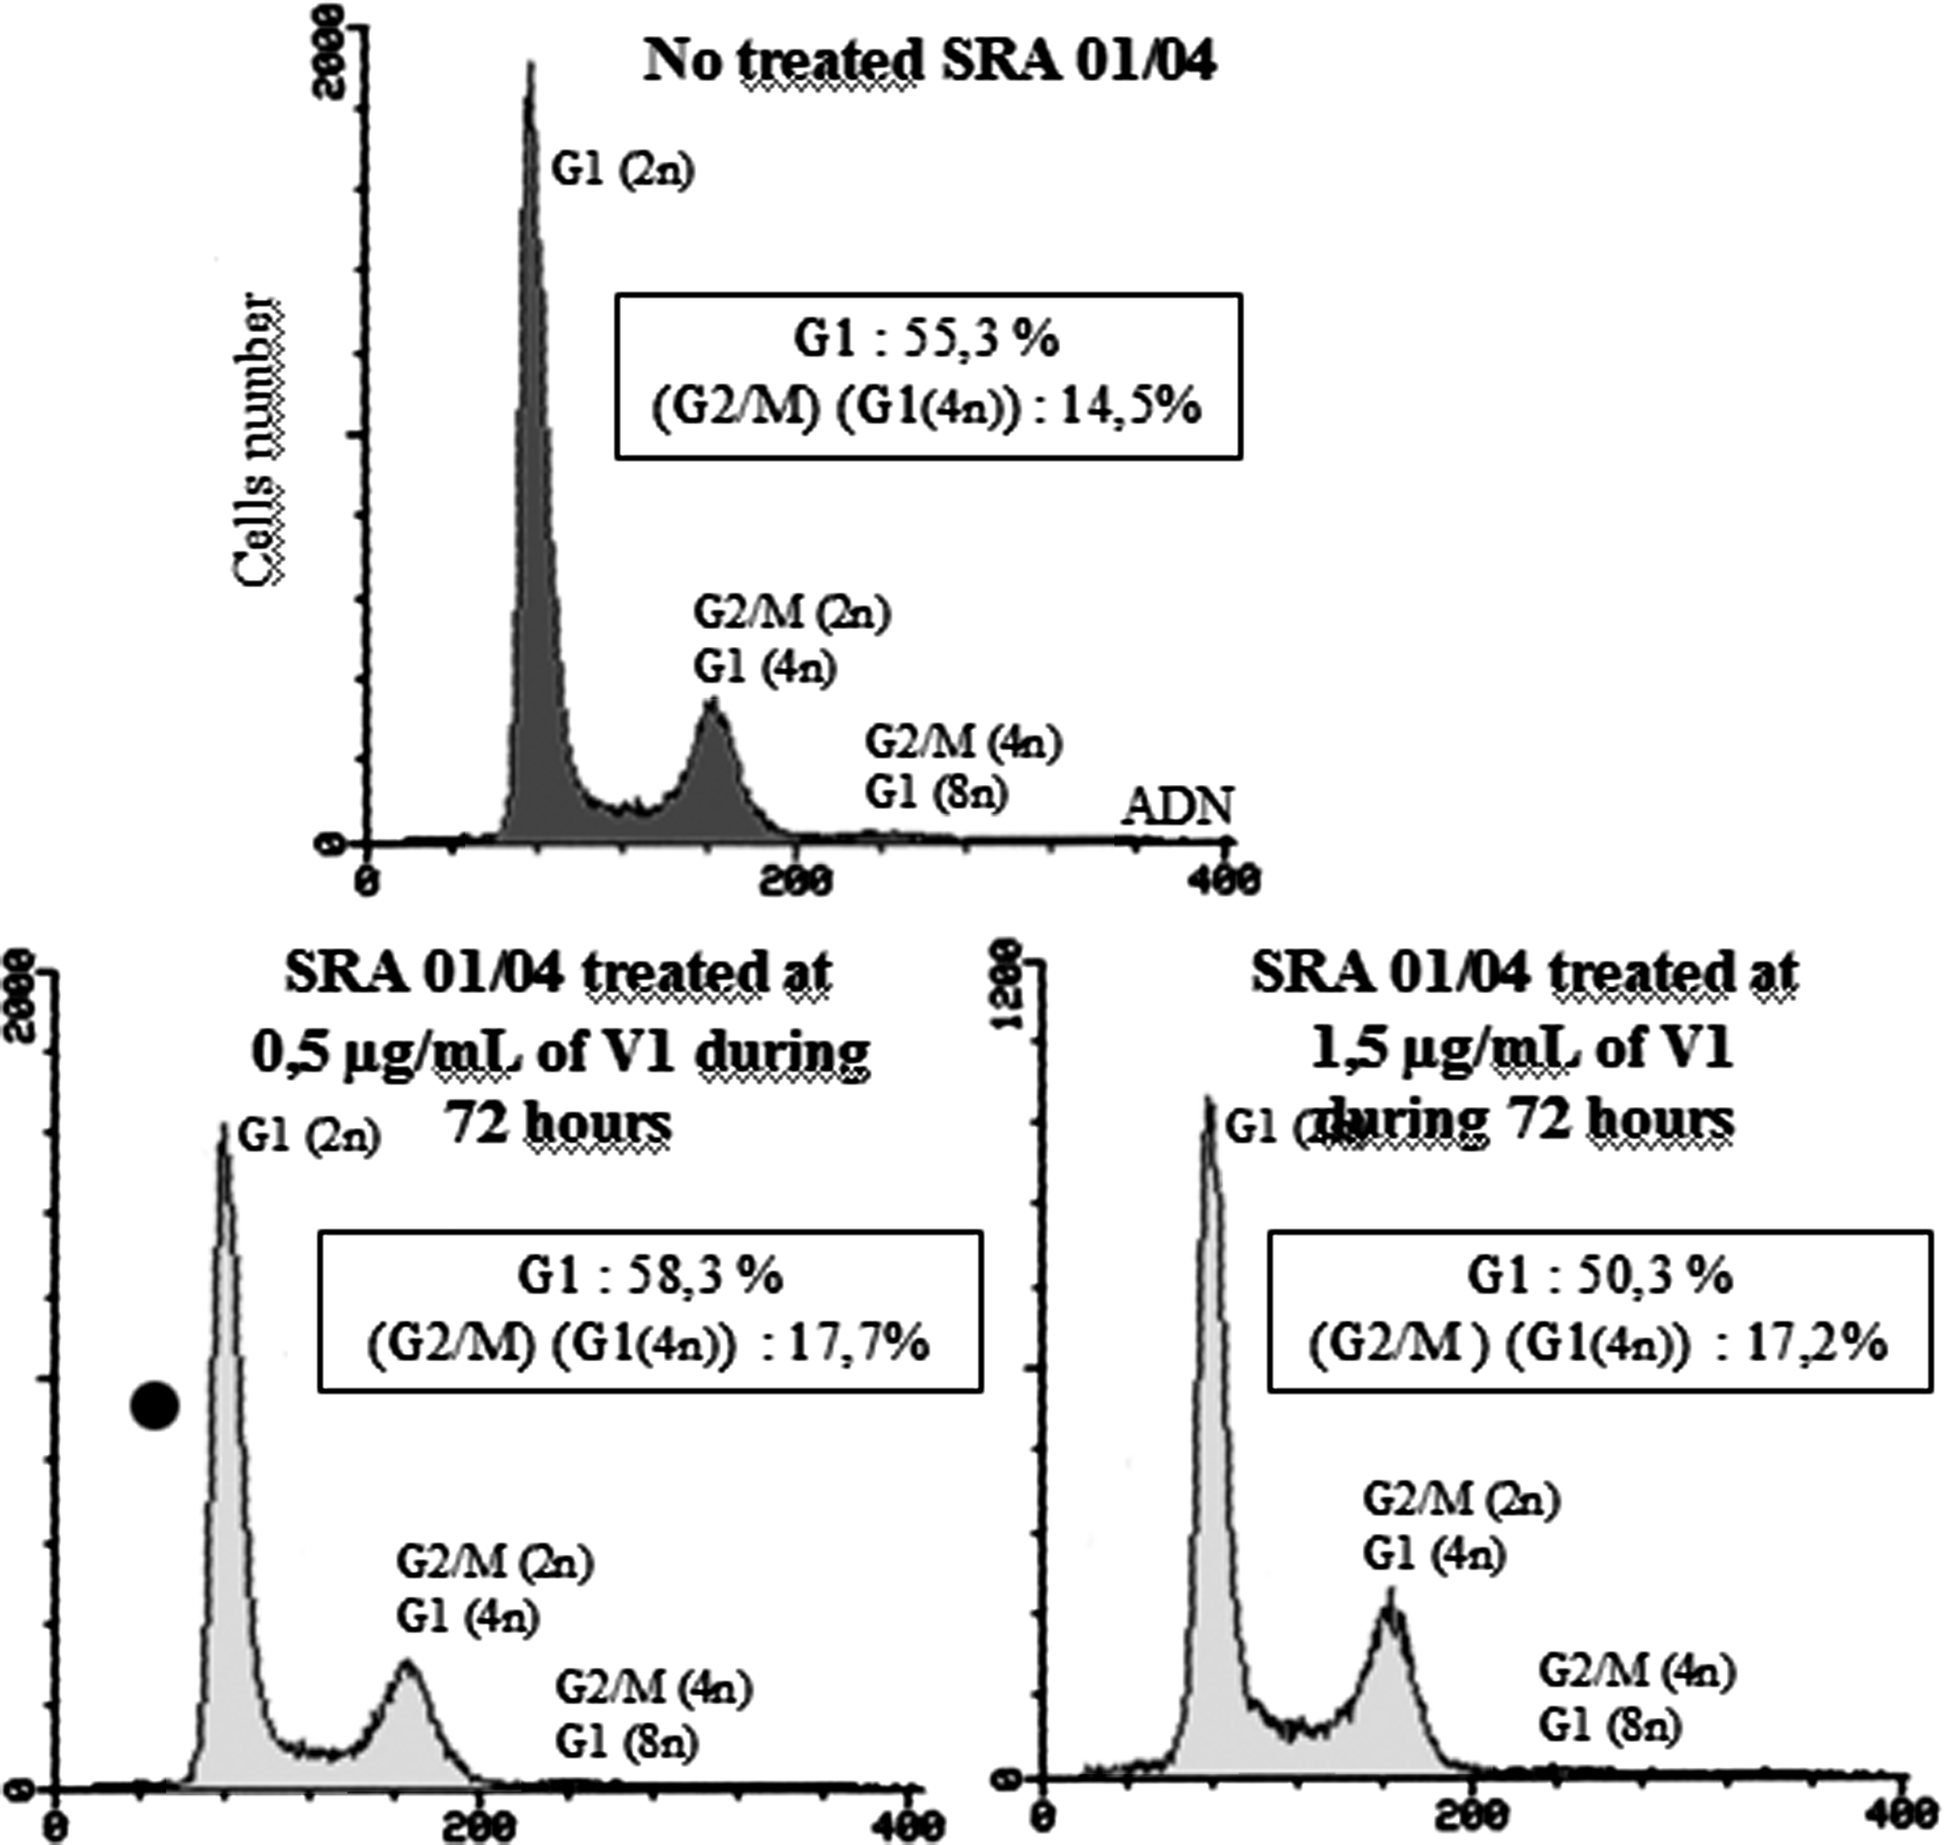
Flow cytometry analysis of SRA 01/04 cells treated at 0.5 and 1.5 μg/mL or not treated by V1 for 72 h. The Table 1 details the cell ratio in each phase of the cell cycle. It shows a blockage of treated cells in G1/G0 phase since 72 h.
The effects of V19 on cell cycle after 72 h of treatment are shown in Fig. 6. This molecule has the same mechanism of action as V1 molecule. After treatment at 22 μg/mL, an important cytotoxic effect is observed because a lot of cell debris are observed prior to G1 peak.
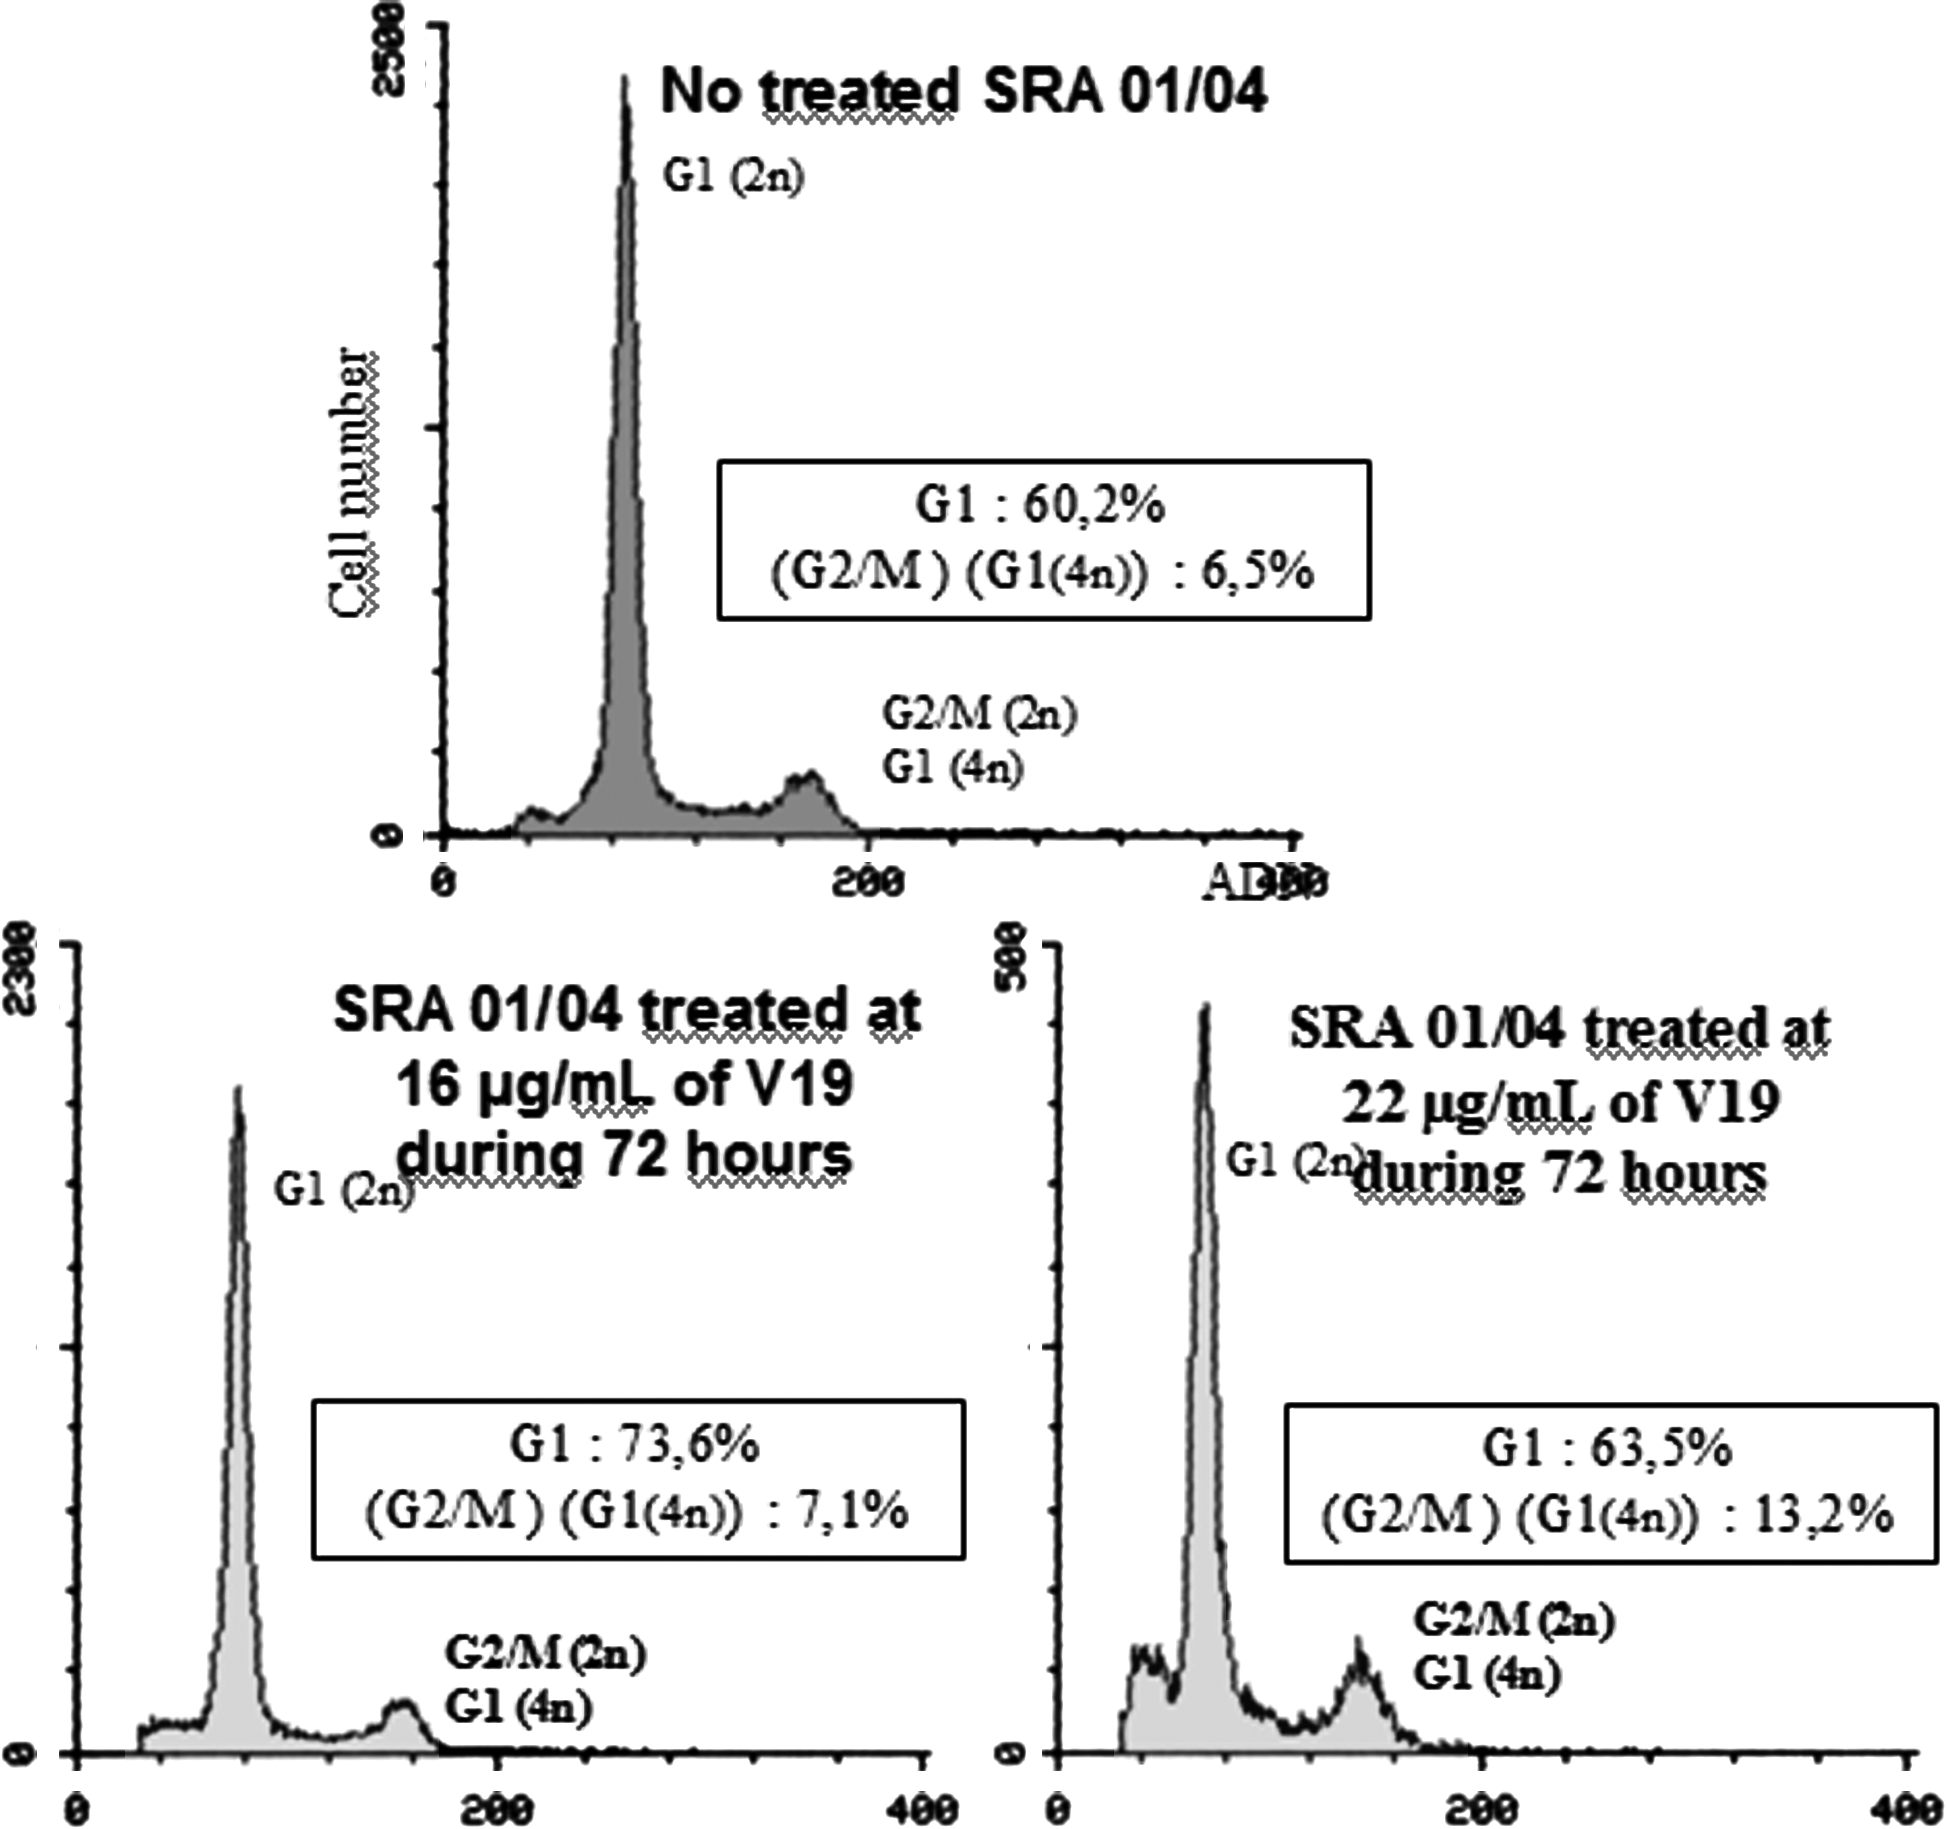
Flow cytometry analysis of SRA 01/04 cells treated at 16 and 22 μg/mL or not treated by V19 for 72 h. The Table 1 details the cell ratio in each phase of the cell cycle. It shows a blockage of treated cells in G1/G0 phase since 72 h.
The activity of A190 on SRA 01/04 cells (Fig. 7) results in a decrease of the G1 peak compared with control. At a concentration of A190 of 4 μg/mL, an increase of the G1-DT peak is observed. This increase is due to the advance in cell cycle phase G1. At intermediate concentrations (9 and 12 μg/mL), the decrease of the G1-DT peak is due to the cell death. The presence of apoptotic body before the G1-DT phase at a concentration of A190 of 17 μg/mL indicates a high mortality of cells. Those cells are the last influenced by the treatment of asynchronous culture. The same experiment was performed with a longer duration of treatment in order to show the apoptotic effect.
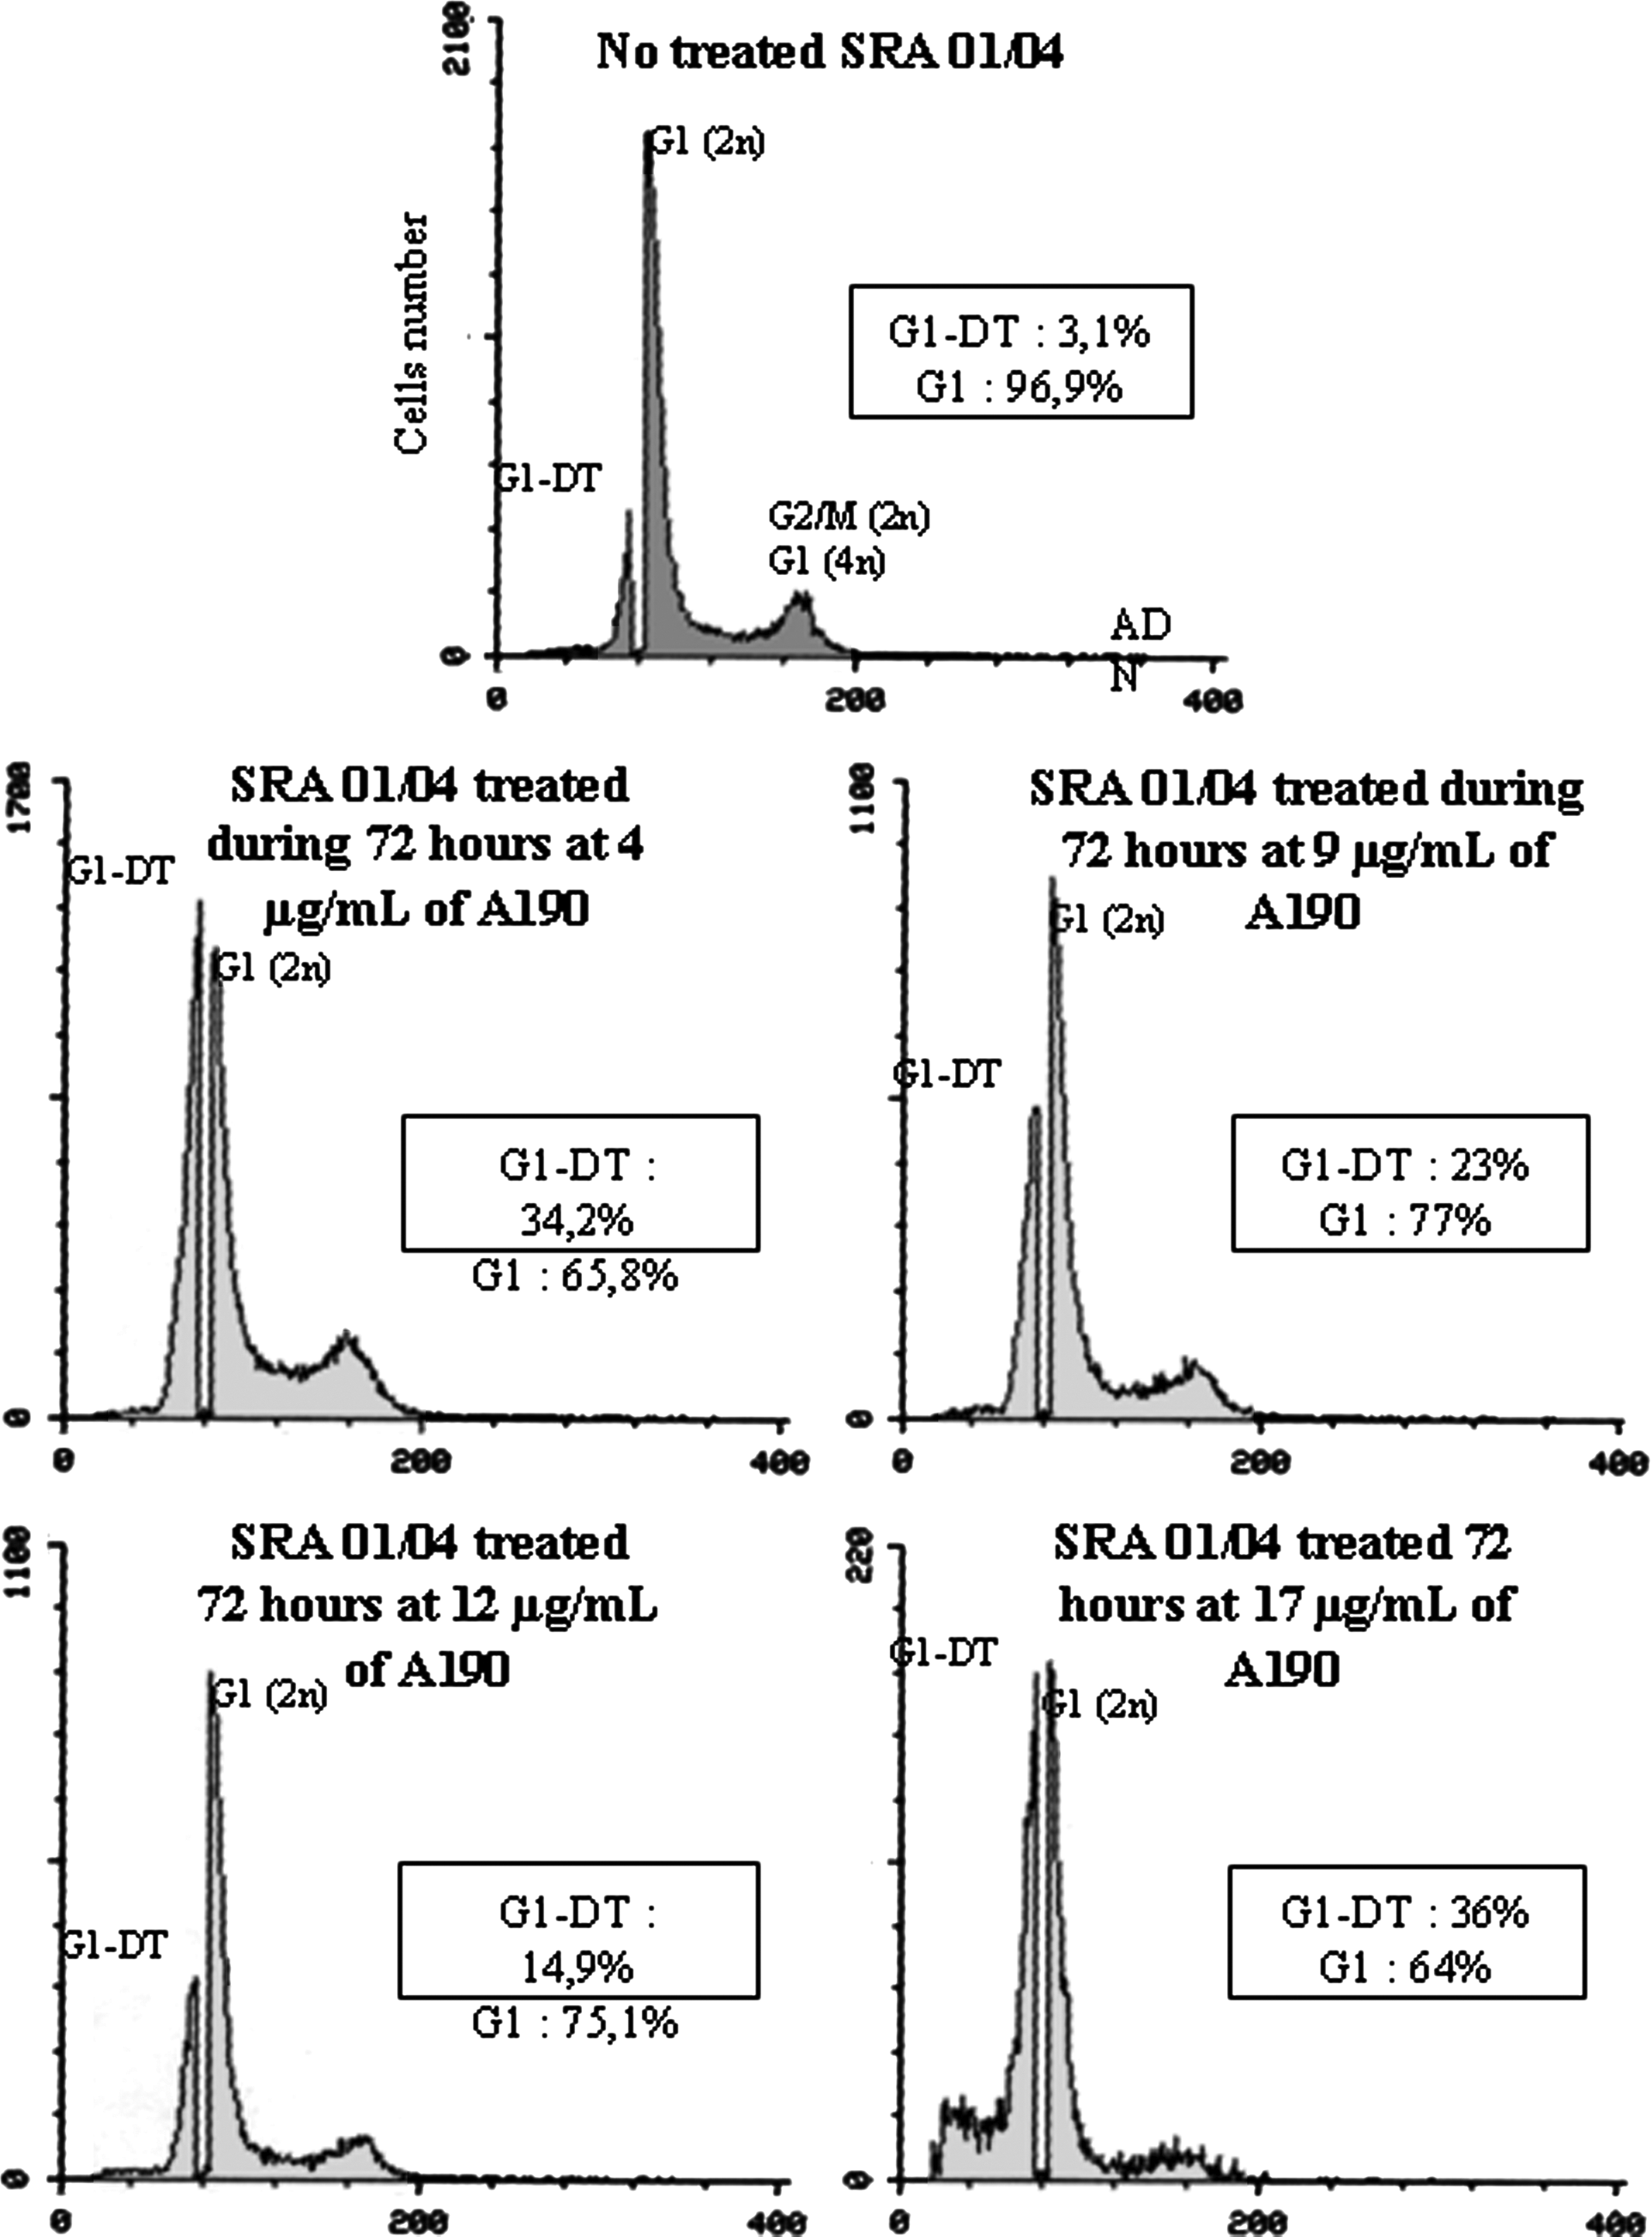
Flow cytometry analysis of SRA 01/04 cells treated or not treated by A190 for 72 h. The Table 1 details the cell ratio in each phase of the cell cycle. It shows a blockage of treated cells in G1/G0 phase since 72 h.
To complete the analysis of the action of A190, we examined the action of this molecule on the cell morphology.
Microscopic optical studies
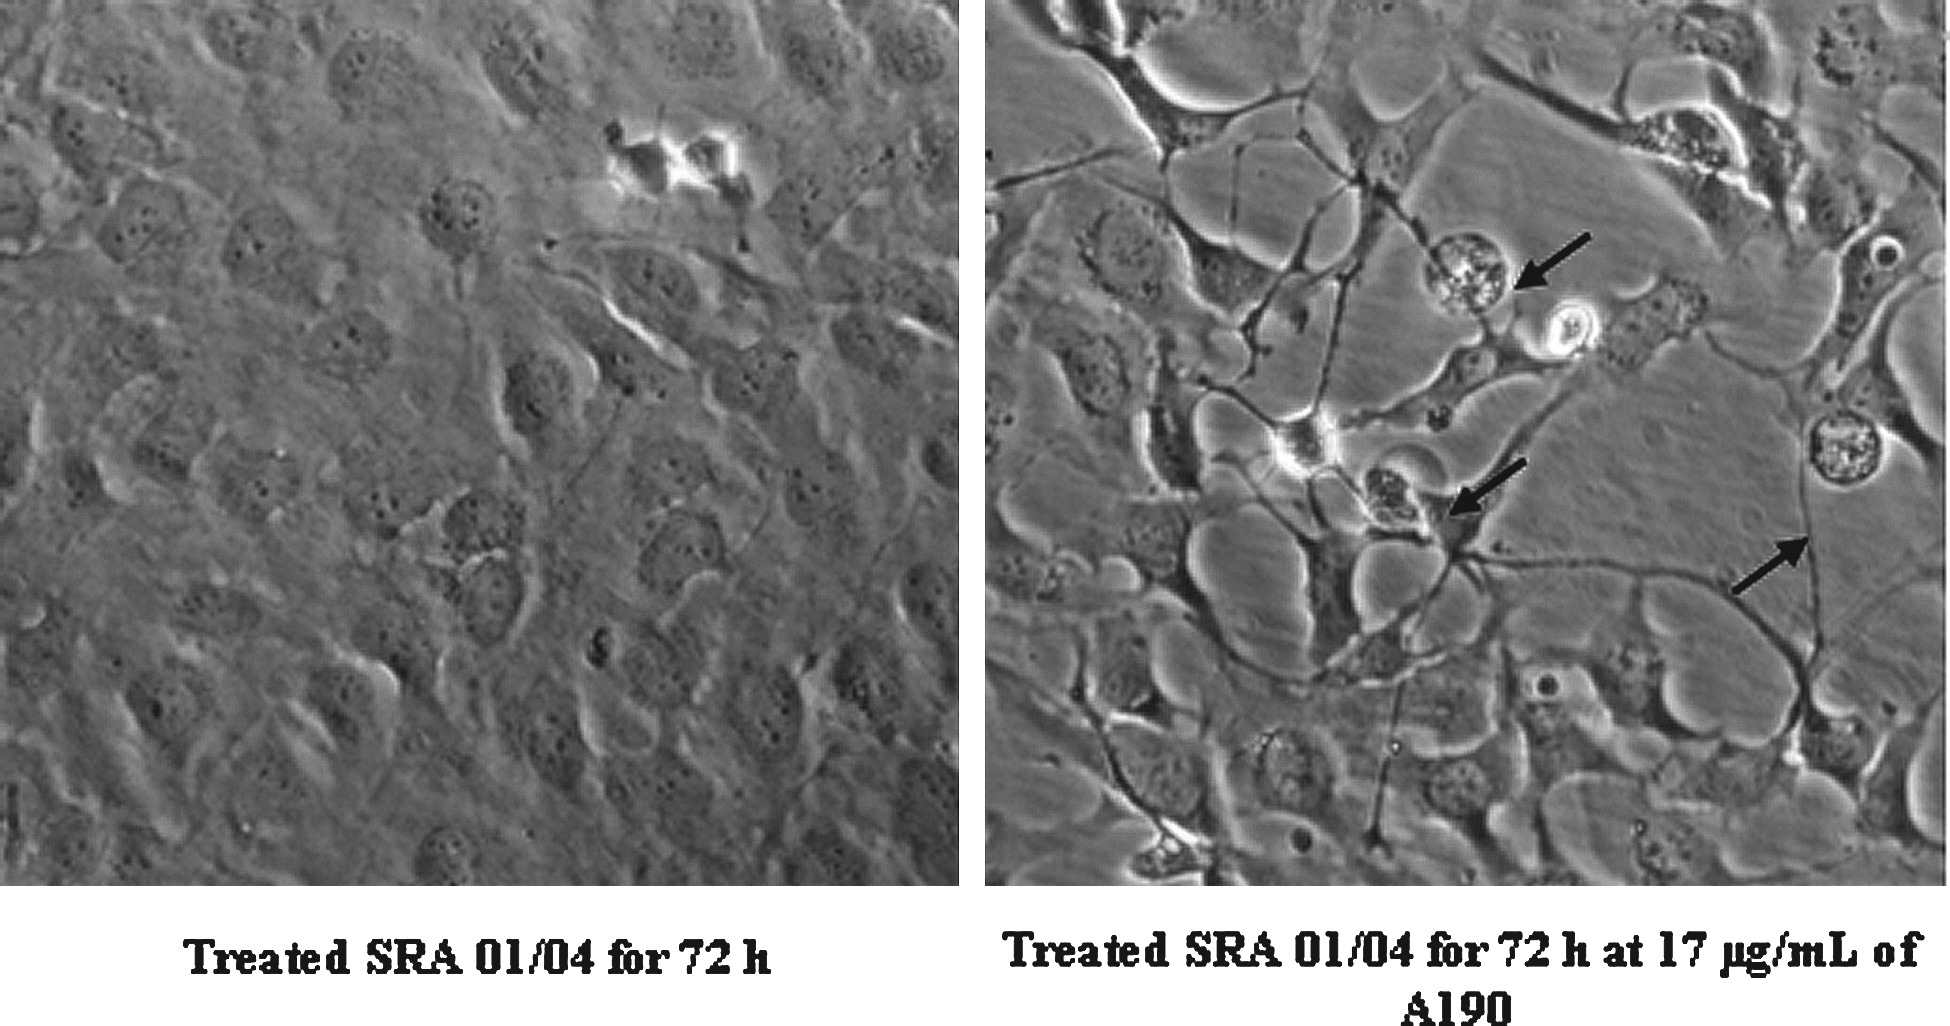
Cells were treated for 72 h at a concentration of A190 at 17 μg/mL. At the end of the treatment, cells were observed by optical microscopy and were subjected to a photo shoot (Fig. 8).
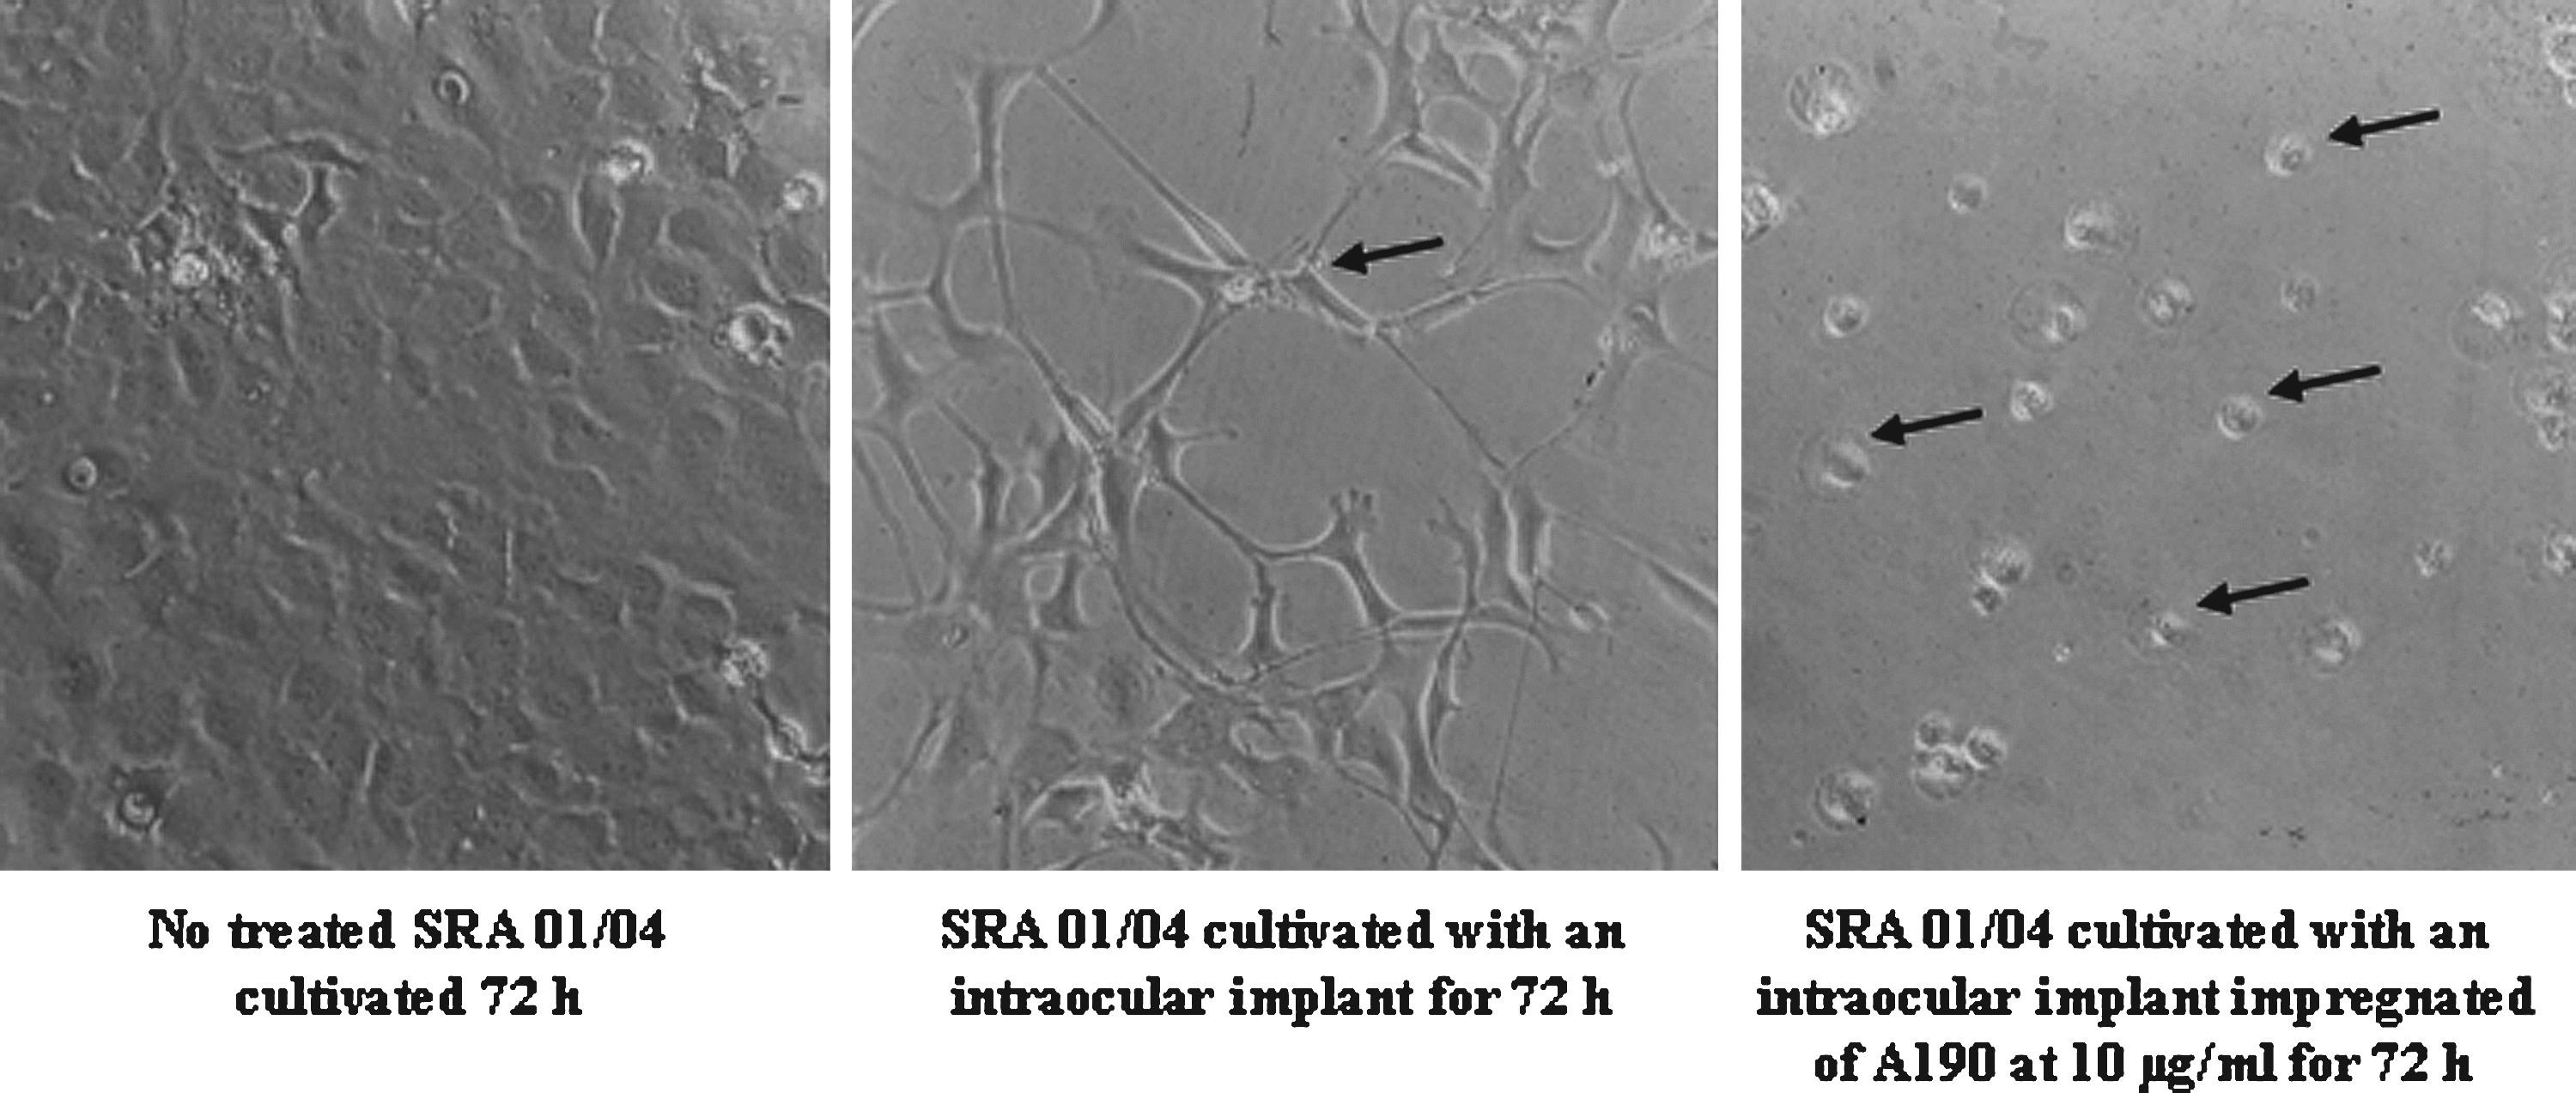
Morphologic analysis of SRA 01/04 by optical microscopy after treatment by A190 (×200). First image: No treated SRA 01/04 cultivated for 72 h. Middle image: SRA 01/04 cultivated with an intraocular implant for 72 h. Third image: SRA 01/04 cultivated with an intraocular implant impregnated of A190 at 10 μg/mL for 72 h. Arrows show apoptotic body.
A190 treatment is accompanied by a decrease of the cell population compared with the control but it induced the appearance of mainly apoptotic body (indicated by arrows in Fig. 8). Moreover, the treated cells appear with a more abundant cytoplasm. A second shot was done in the presence of an implant and an implant impregnated with a solution of 10 μg/mL A190 (Fig. 9). After cell culture for 72 h in the presence of an implant impregnated or not by A190, the number of cells decreased significantly compared with the control. In the presence of the implant alone, cells are transformed and they have an elongated shape. In the presence of the implant impregnated with A190, the cells are more adherent and they have a round shape characteristic of dead cells.
Morphologic analysis of SRA 01/04 by optical microscopy after 72-h treatment by an intraocular implant impregnated or not by A190 (×200). Arrows show apoptotic body.
Discussion
The treatment of cataract is usually surgical, in 2 steps. First, the lens' anterior capsule is extracted after incision by using ultrasounds. Then, an IOL is implanted in the capsular bag. 25
However, this practice can provoke a secondary opacification of the posterior capsule. This secondary cataract is due to abnormal cell proliferation.4,5 It needs a new treatment by surgical capsular break or by use of Nd:YAG laser. However, the latter has many secondary effects like retinal detachment and cystoid macular edema. 26 To prevent these risks and formation of secondary cataract, a lot of approaches have been used such as heparin, 5-Fu, and so on. But all these methods are not sufficient to prevent PCO. Considering all the information, we have tested 18 molecules to study their biological function.
First of all, we have screened 18 tested molecules (V0 molecules and its derivatives V1, V6, V12, and V19, and A190) based on their cytotoxic activity on HLE cell line SRA 01/04. Based on the IC50 of each molecule, we have selected 6 molecules with an interesting IC50, which seem to have a better effect on SRA cells and no immediate cell destruction was observed (Fig. 2).
In the second step of this study, we tested 6 molecules on the cytotoxic assay with SRA cells. The MTT assay done for 72 h gives more information about the cytotoxic or cytostatic effect of the molecules. Considering all the results of the molecules, we have selected A190 for its cytostatic effect and V19 and V1 for their cytotoxic effect to analyze the mechanism of action using the FACS (Fig. 3).
By flow cytometry, we have confirmed the mechanism of cytotoxic activity of the molecules V1 and V19. The V1 effect at 0.5 μg/mL on cell cycle after 72 h of treatment (Fig. 5) shows that cells are blocked in G1 phase of their cycle. The block in G1 phase of cell cycle is less important after treatment at 1.5 μg/mL as cells die due to the cytotoxic effect of the molecule after 72-h treatment but the remaining cells observed are over the G1 phase.
The effects of V19 on cell cycle after 72 h of treatment (Fig. 6) are the same as V1 molecule. After treatment at 22 μg/mL, an important cytotoxic effect is observed as for V1. To conclude, V1 and V19 blocked the cells in G1 phase in an irreversible manner.
The activity of A190 on SRA 01/04 cells (Fig. 7) results in a decrease of the G1 peak compared with the control. At a concentration of 4 μg/mL A190, an increase of the G1-DT peak is observed. This increase is due to the advance in cell cycle phase G1. At intermediate concentrations (9 and 12 μg/mL), the decrease of the G1-DT peak is due to the cell death. The presence of apoptotic body before the G1-DT phase at a concentration of A190 of 17 μg/mL indicates a high mortality of cells. Those cells are the last influenced by the treatment of asynchronous culture. The same experiment was performed with a longer duration of treatment in order to show the apoptotic effect. So the A190 has a cytostatic effect, which is very interesting. To verify these results, we continued the research about these 3 molecules.
With this first results about the A190 molecule, we decide to observed cells treated for 72 h with 17 μg/mL of A190. At the end of the treatment, cells were observed by optical microscopy (Fig. 8). We observed a decrease of the cell population compared with the control and the appearance of mainly apoptotic body (indicated by arrows in Fig. 8). Moreover, the treated cells appear with a more abundant cytoplasm. A second shot was done in the presence of an implant and an implant impregnated with a solution of 10 μg/mL A190 (Fig. 9). After cell culture for 72 h in the presence of an implant impregnated or not by A190, the number of cells decreased significantly compared with the control. In the presence of the implant alone, cells are transformed and they have an elongated shape. In the presence of the implant impregnated with A190, the cells are more adherent and they have a round shape characteristic of dead cells. This preliminary result seems to be very interesting because this molecule could prevent PCO. As A190 have an interesting IcSo, a cytostatic activity and the Implant impregnated with A190 give a good response, we considered that this molecule must be studied more in this context.
But the molecules V1 and V19 must be tested as A190 to observe the effect of cell. To conclude, these 3 molecules drive cells to mortality following the model proposed by Wille and Scott. 27 Pathological cells are induced to terminal differentiation state (G1-DT phase); then, the cells die by apoptosis-type mechanism.
In future studies, we will examine the in vivo effects of these molecules on rabbits suffering from secondary cataract.
Footnotes
Author Disclosure Statement
The authors have no conflicts of interest.