
Abstract
Abstract
Purpose:
α-Lipoic acid (LA) aqueous formulations were studied for nonoral administration, including intravitreal and intraperitoneal preparations and topical eyedrops. The potential retinoprotective effects of these LA preparations were also evaluated in streptozotocin (STZ)-induced diabetic rats for screening better delivery systems of LA.
Methods:
Four LA liquid preparations were prepared and investigated. The short-term accelerated stabilities of LA preparations were investigated at 3 temperatures: 50°C, 70°C, and 90°C. The time courses of LA degradation in the preparations were determined by high-performance liquid chromatography. Furthermore, the potential therapeutic effects of LA preparations in a STZ-induced diabetic rat model were assessed by vitreous fluorophotometry to evaluate the fluorescein leakage from ocular vascular vessels into the vitreous. Capillary lesion in the retina was also examined using hematoxylin–eosin-stained microsections.
Results:
LA in an aqueous solution was rapidly degraded with the activation energy of 10.4 kcal/mol. The 3 LA preparations had shelf lives of ∼1 month at 25°C. These formulations significantly reduced the vitreous fluorescein level in STZ-induced diabetic rats as evaluated by the fluorescein leakage after tail vein injection. Capillary lesions in the retina of the diabetic rats were remarkably reduced by nonoral administration, particularly the intraperitoneal injection (30 mg/kg/day).
Conclusions:
LA could be developed as aqueous preparations with suitable stability for short-term use in nonoral administration. LA preparations could be administered intravitreally or intraperitoneally to reduce ocular microvascular complications, such as retinopathy, in diabetic patients.
Introduction
Although LA is often used in dietary supplements and cosmetics, it is unstable. During storage, LA degradation is associated with an unpleasant odor in the solid dosage form. 8 The oil-in-water emulsion of LA had been investigated as a cosmetic, and vitamin A was incorporated into the dispersed preparation as an antioxidant to reduce LA degradation in the formulation. 9 However, the stability of LA in the aqueous solution, a formulation that would permit parenteral and ocular administration of LA, has not been fully investigated. The development and evaluation of LA aqueous preparations are very important for achieving a stable LA formulation that can be administered via nonoral routes, such as parenterally or topically. Diabetic retinopathy is the most frequent cause of vision loss among adults, and it is closely associated with long-term diabetes. The occurrence of diabetic retinopathy increases with the duration of diabetes, involving more than one-fourth of all diabetic patients.10,11 LA aqueous preparations with suitable stability can be potentially used to slow or prevent the progression of diabetic retinopathy.
Hyaluronic acid is a polysaccharide composed of repeating units of N-acetyl-
Methods
Materials
LA, STZ, sodium fluorescein, and methylcellulose (1,500 cps) were purchased from Sigma-Aldrich (St. Louis, MO). Sodium hyaluronate (HA) was purchased from Xian Medicines (injection grade; Xian, Shaanxi, China). Other chemicals were reagents or analytical grade.
Preparation of LA injection
The LA aqueous solution (3%) was prepared in Milli-Q water containing sodium hydroxide with an equimolar concentration of LA. The solution was adjusted to pH 7.4 using dilute hydrochloric acid. Then, the solution was passed through a 0.22-μm membrane filter, and the filtrate was filled in vials. After nitrogen purging, these vials were sealed and sterilized by autoclaving at 121°C for 15 min.
Preparation of LA stock solution
The LA aqueous solution (4%) was prepared in Milli-Q water containing sodium hydroxide with an equimolar concentration of LA. The pH of the solution was adjusted to 7.4 using dilute hydrochloric acid. The prepared LA solution was used as a stock solution with a concentration of 40 mg/mL.
Preparation of LA eyedrops
The methylcellulose solution (0.6%) was prepared in Milli-Q water containing 0.36% sodium chloride to adjust the tonicity and 0.04% benzalkonium chloride to inhibit bacterial and fungal growth. The solution was mixed with the LA stock solution and Milli-Q water at a ratio of 2:1:1 (v/v). Then, the mixture was passed through a 0.22-μm membrane filter; the filtrate was filled in sterilized plastic bottles to obtain 1% LA eyedrops.
Preparation of LA intravitreal injections
HA solutions were prepared by separately dissolving 100 or 300 mg of HA in 5 mL of Milli-Q water in two 10-mL volumetric flasks. Clear solutions were achieved by removal of entrapped air through sonication. Subsequently, 90 mg of sodium chloride (dissolved in Milli-Q water) was added to each flask. Then, 2.5 mL of the LA stock solution was added to each flask. After mixing, Milli-Q water was added to attain a total volume of 10 mL. LA solutions were separately passed through 10-μm membrane filters and filled in vials. After nitrogen purging, these vials were sealed and further sterilized by autoclaving at 121°C for 15 min to obtain 1% LA intravitreal formulations containing 1% or 3% HA.
Viscosity determination
Different concentrations (0.1%, 0.2%, 0.5%, 1%, and 2%) of HA aqueous solutions (without LA) were also prepared in Milli-Q water and sterilized by autoclaving. The viscosities of these HA solutions and the investigated LA preparations were determined using a cone-plate viscometer (CPE-42, model LVDV-II; Brookfield) at 25°C.
In vitro drug release
LA intravitreal formulations (100 μL) containing 1% LA and 1% or 3% HA were placed in dialysis bags (MWCO 12,000–14,000; Membrane Filtration Products, Seguin, TX), and each dialysis bag was installed in a 50-mL centrifuge tube containing 20 mL of phosphate-buffered saline (Sigma-Aldrich). Release studies were conducted in a shaking water bath at 50 rpm and 37°C. At 0, 1, 2, 3, 4, 5, 6, 12, 24, 30, and 36 h, a 0.5-mL aliquot of the sample was withdrawn and compensated with an equal volume of phosphate-buffered saline. Samples were analyzed by high-performance liquid chromatography (HPLC) to determine their drug release characteristics.
Drug stability studies
The 4 LA preparations (3% LA intraperitoneal injection, 1% LA eyedrops, and 1% LA intravitreal injections containing 1% or 3% HA), were separately added to 5-mL ampoules (each 1 mL). After flame sealing, these ampoules were placed in a constant temperature chamber at 50°C, although the 3% LA intraperitoneal formulation was also investigated at 70°C and 90°C. Samples were withdrawn at preset time points and stored at −20°C until HPLC analysis.
HPLC analysis
A Shimadzu (Tokyo, Japan) HPLC system equipped with a peristaltic pump (LC-10), an autosampler (SIL-9A), a UV detector (SPD-10A), and a photodiode array (SPD-M10AVP) was used to analyze LA in the investigated samples. HPLC analysis was performed on a reverse phase C18 column (Inertsil ODS-80A; 4.6×250 mm) at room temperature using a mobile phase composed of methanol and a 0.01 M acetate buffer (pH 3.4) at a ratio of 70:30 (v/v). The flow rate of the mobile phase was 1 mL/min. The HPLC eluate was monitored by the UV detector at a wavelength of 230 nm. A calibration curve was established using a series of LA concentrations containing the internal standard p-hydroxybenzoic acid butyl ester (PBB). The curve was used to calculate LA concentrations in the investigated samples following HPLC analyses.
STZ-induced diabetic rats
Male and female Wistar rats weighing 200–250 g were obtained from BioLasco (Taipei, Taiwan) and used in the study. The protocol was approved by the Institutional Animal Care and Use Committee, National Defense Medical Center (Taipei, Taiwan). The rats were randomly divided into 2 groups (6 rats in each group) and intraperitoneally injected with 60 mg/kg STZ (STZ-induced diabetic group, STZ freshly prepared in a vehicle of 0.1 M citrate buffer, pH 4.5) or the vehicle alone (control group). At 4 and 7 days after injection, blood samples were withdrawn from the tail veins of rats (fasted for 8 h before blood sampling) using 2-mL syringes with 21-gauge needles and stored in 1.5-mL heparin-rinsed Eppendorf tubes. After centrifugation at 12,000 rpm (Sorvall RT7, Newtown, CT) for 10 min, plasma was obtained from the supernatant to determine blood sugar levels using a glucose analyzer (YSI 2300; YSI, Yellow Springs, OH). Moreover, the body weights of rats were measured 7 days after the injection of STZ or vehicle.
Determination of vitreous fluorescence intensity
Fluorescein injection (1%) was prepared by dissolving sodium fluorescein in Milli-Q water, and the pH was adjusted to 9.0 with 10% sodium hydroxide. The formulation was finally sterilized by autoclaving. Rats were anesthetized intraperitoneally with sodium pentobarbital at a dose of 50 mg/kg (Somnotol® 65 mg/mL; MTC Pharmaceuticals, Cambridge, Ontario). A noninvasive method of vitreous fluorophotometry was used to directly measure the fluorescence intensity in the vitreous of rats using an ocular fluorometer (Fluorotron Master; OcuMetrics, Inc., Mountain View, CA) according to a technique reported previously.15,16
Assessing fluorescein leakage following LA treatment
STZ-induced diabetic rats were used to assess the fluorescein leakage from ocular vascular vessels into the vitreous. Wistar rats were randomly divided into 4 groups (n=5 each). All rats were intraperitoneally injected with 60 mg/kg STZ as described previously. Under anesthesia, these rats were administered 1 of the 4 LA preparations 1 day after STZ injection. The 4 groups included the IP group, once-daily intraperitoneal injection of 3% LA at a dose of 30 mg/kg; the ED group, once-daily 1% LA eyedrop instillation at a volume of 10 μL (administered on the corneal surface using a micropipette); and IV-1 and IV-3 groups, one intravitreal injection of 10 μL of 1% LA (delivered using a microsyringe) containing 1% (IV-1) or 3% (IV-3) HA. Before STZ injection and 8 days after the injection, the investigated rats were injected with 14 mg/kg fluorescein via the tail vein. At 60 min after fluorescein injection, the eyes of the rats were scanned using an ocular fluorometer in a dark room. The fluorometer measured the vitreous fluorescence along the optical axis of the eye. The fluorescence intensity in the vitreous at the minimum region before the crystalline lens was recorded. In addition, 2 control groups, the blank control group (vehicle injection and no LA treatment) and positive control group (with STZ injection and no LA treatment), were also investigated.
Assessing blood vessel lesions
Rats in the treatment and control groups were sacrificed by CO2 inhalation 10 days after STZ or vehicle injections. Then, the entire eyeball was enucleated using enucleation scissors. The excised eyeball was intracamerally injected with 0.1 mL of 4% formaldehyde, and then immersed in 4% formaldehyde. The microsections (6-μm thickness) of retinal tissues near the optic nerve were stained with hematoxylin and eosin and examined by microscopy to determine any lesions.
Statistical analysis
All data are presented as mean and standard deviations. The comparison between 2 groups was analyzed by the Student's t-test. One-way analysis of variance (ANOVA) was used to compare the means across the groups: the control group, IP, ED, IV-1, and IV-3. In addition, after P<0.05 was achieved by 1-way ANOVA, a post hoc (Dunnett t-test) was also conducted. An alpha error P<0.05 was considered statistically significant. SPSS 20 was used for the statistical analysis.
Results
HPLC analysis
A typical HPLC chromatogram of LA and its internal standard PBB is shown in Fig. 1. The retention times of LA and PBB were 6.99 and 9.44 min, respectively. The peak purity of the LA peak was evaluated to be 0.9998 by photo diode array, and no significant interference by LA degradants was observed. The calibration curve of LA was established by plotting the peak area ratio of LA and PBB versus the LA concentration. A linear equation was obtained by the least squares method as follows: y=0.021x+0.0034 (r=0.9999), where y and x are the peak area ratio (LA/PBB) and LA concentration (μg/mL), respectively. Precision and accuracy were evaluated by the coefficient of variation and error to be 1.01%–2.5% and −3.74% to 1.43%, respectively (Table 1). The established analytical method displayed good linearity within a range of 10–100 μg/mL, and HPLC was used to investigate the stabilities and drug release characteristics of the LA preparations.

The chromatogram of high-performance liquid chromatography for α-lipoic acid (LA, retention time: 6.99 min) and its internal standard (p-hydroxybenzoic acid butyl ester, retention time: 9.44 min).
Mean±SD (n=5).
CV, coefficient of variation; SD, standard deviations.
Physicochemical properties of LA preparations
The viscosities of HA aqueous solutions and 4 LA preparations with or without HA were determined using a cone plate viscometer (Table 2). The investigated LA preparations had a pH of ∼7.4 and viscosities of 12.1–42.1 mPa. The viscosity of HA aqueous solutions increased with an increase in HA concentrations. The logarithm of viscosity (y) of the HA solutions displayed good linearity with the HA concentration (x) from 0.2% to 2% (log y=0.531x+1.621, r=0.9989). The LA preparations containing HA formed gelatinous solutions because of their higher viscosities compared with other LA preparations without HA. Figure 2 shows the release profiles of 2 intravitreal injections containing HA that were stored in dialysis membranes for 36 h. The release of LA from the HA-containing formulations appeared to exhibit a 2-phase profile: a fast release rate in the first 2 h and a much slower rate thereafter. The fast release could be attributed to LA on the surface of the gelatinous preparation; a portion of the drug was quickly released and exhausted within the first 2 h. Thereafter, the released drug originated from the inside gel via a diffusion process, including passage through the gelatinous layer; this step contributed the second phase associated with a slower release rate. The fast release rate might allow LA to quickly reach a therapeutic level. Then, the slow release rate of the second phase maintained the drug level to prolong the therapeutic effect of LA. The release characteristics were greatly influenced by the HA concentration in the preparations. The times for 50% release of the 2 LA preparations containing 1% and 3% HA were 31 and 51 min, respectively. The cumulative release of LA for the preparation containing 3% HA was significantly lower than that for the preparation containing 1% HA at 36 h (77.6%±0.56% vs. 86.4%±0.13%; P<0.05).

Release profiles of 1% LA aqueous preparations containing 1% or 3% sodium hyaluronate (HA).
HA, sodium hyaluronate; LA, α-Lipoic acid.
Stability studies
The apparent first-order degradation rate constants of LA in various preparations were determined from the slope by plotting the natural log percent of LA remaining versus time (Table 3). The degradation profiles of 3% LA formulations at the 3 temperatures are shown in Fig. 3. Regarding the results of acceleration studies at 50°C, LA eyedrops and the 1% intravitreal preparation containing 1% HA had the lowest and highest degradation rate constants, respectively. In addition, a higher temperature accelerated LA degradation in the aqueous solution, as the degradation rate constants at 70 and 90°C were ∼3.5- and 6-fold higher than those at 50°C for the 3% LA preparation. An Arrhenius equation was derived to obtain a linear relationship between the logarithm of the rate constant (k) and the reciprocal of the absolute temperature (T) to further determine the activation energy from the slope (log k=−Ea/2.303 RT+log A, as log k=−2283×1/T+log A, r=−0.9795). 17 The activation energy (10,450 cal/mol=2283×1.987×2.303) combined with the degradation rate constant of each preparation at 50°C was used to determine the degradation rate constant of the 4 LA preparations at 25°C (k25). Consequently, the shelf life of the LA preparations was estimated by dividing 0.1 by k25. Except the 1% LA intravitreal formulation containing 1% HA, which had a shorter shelf life of 16 days, the other LA preparations had shelf lives of ∼1 month (Table 3).
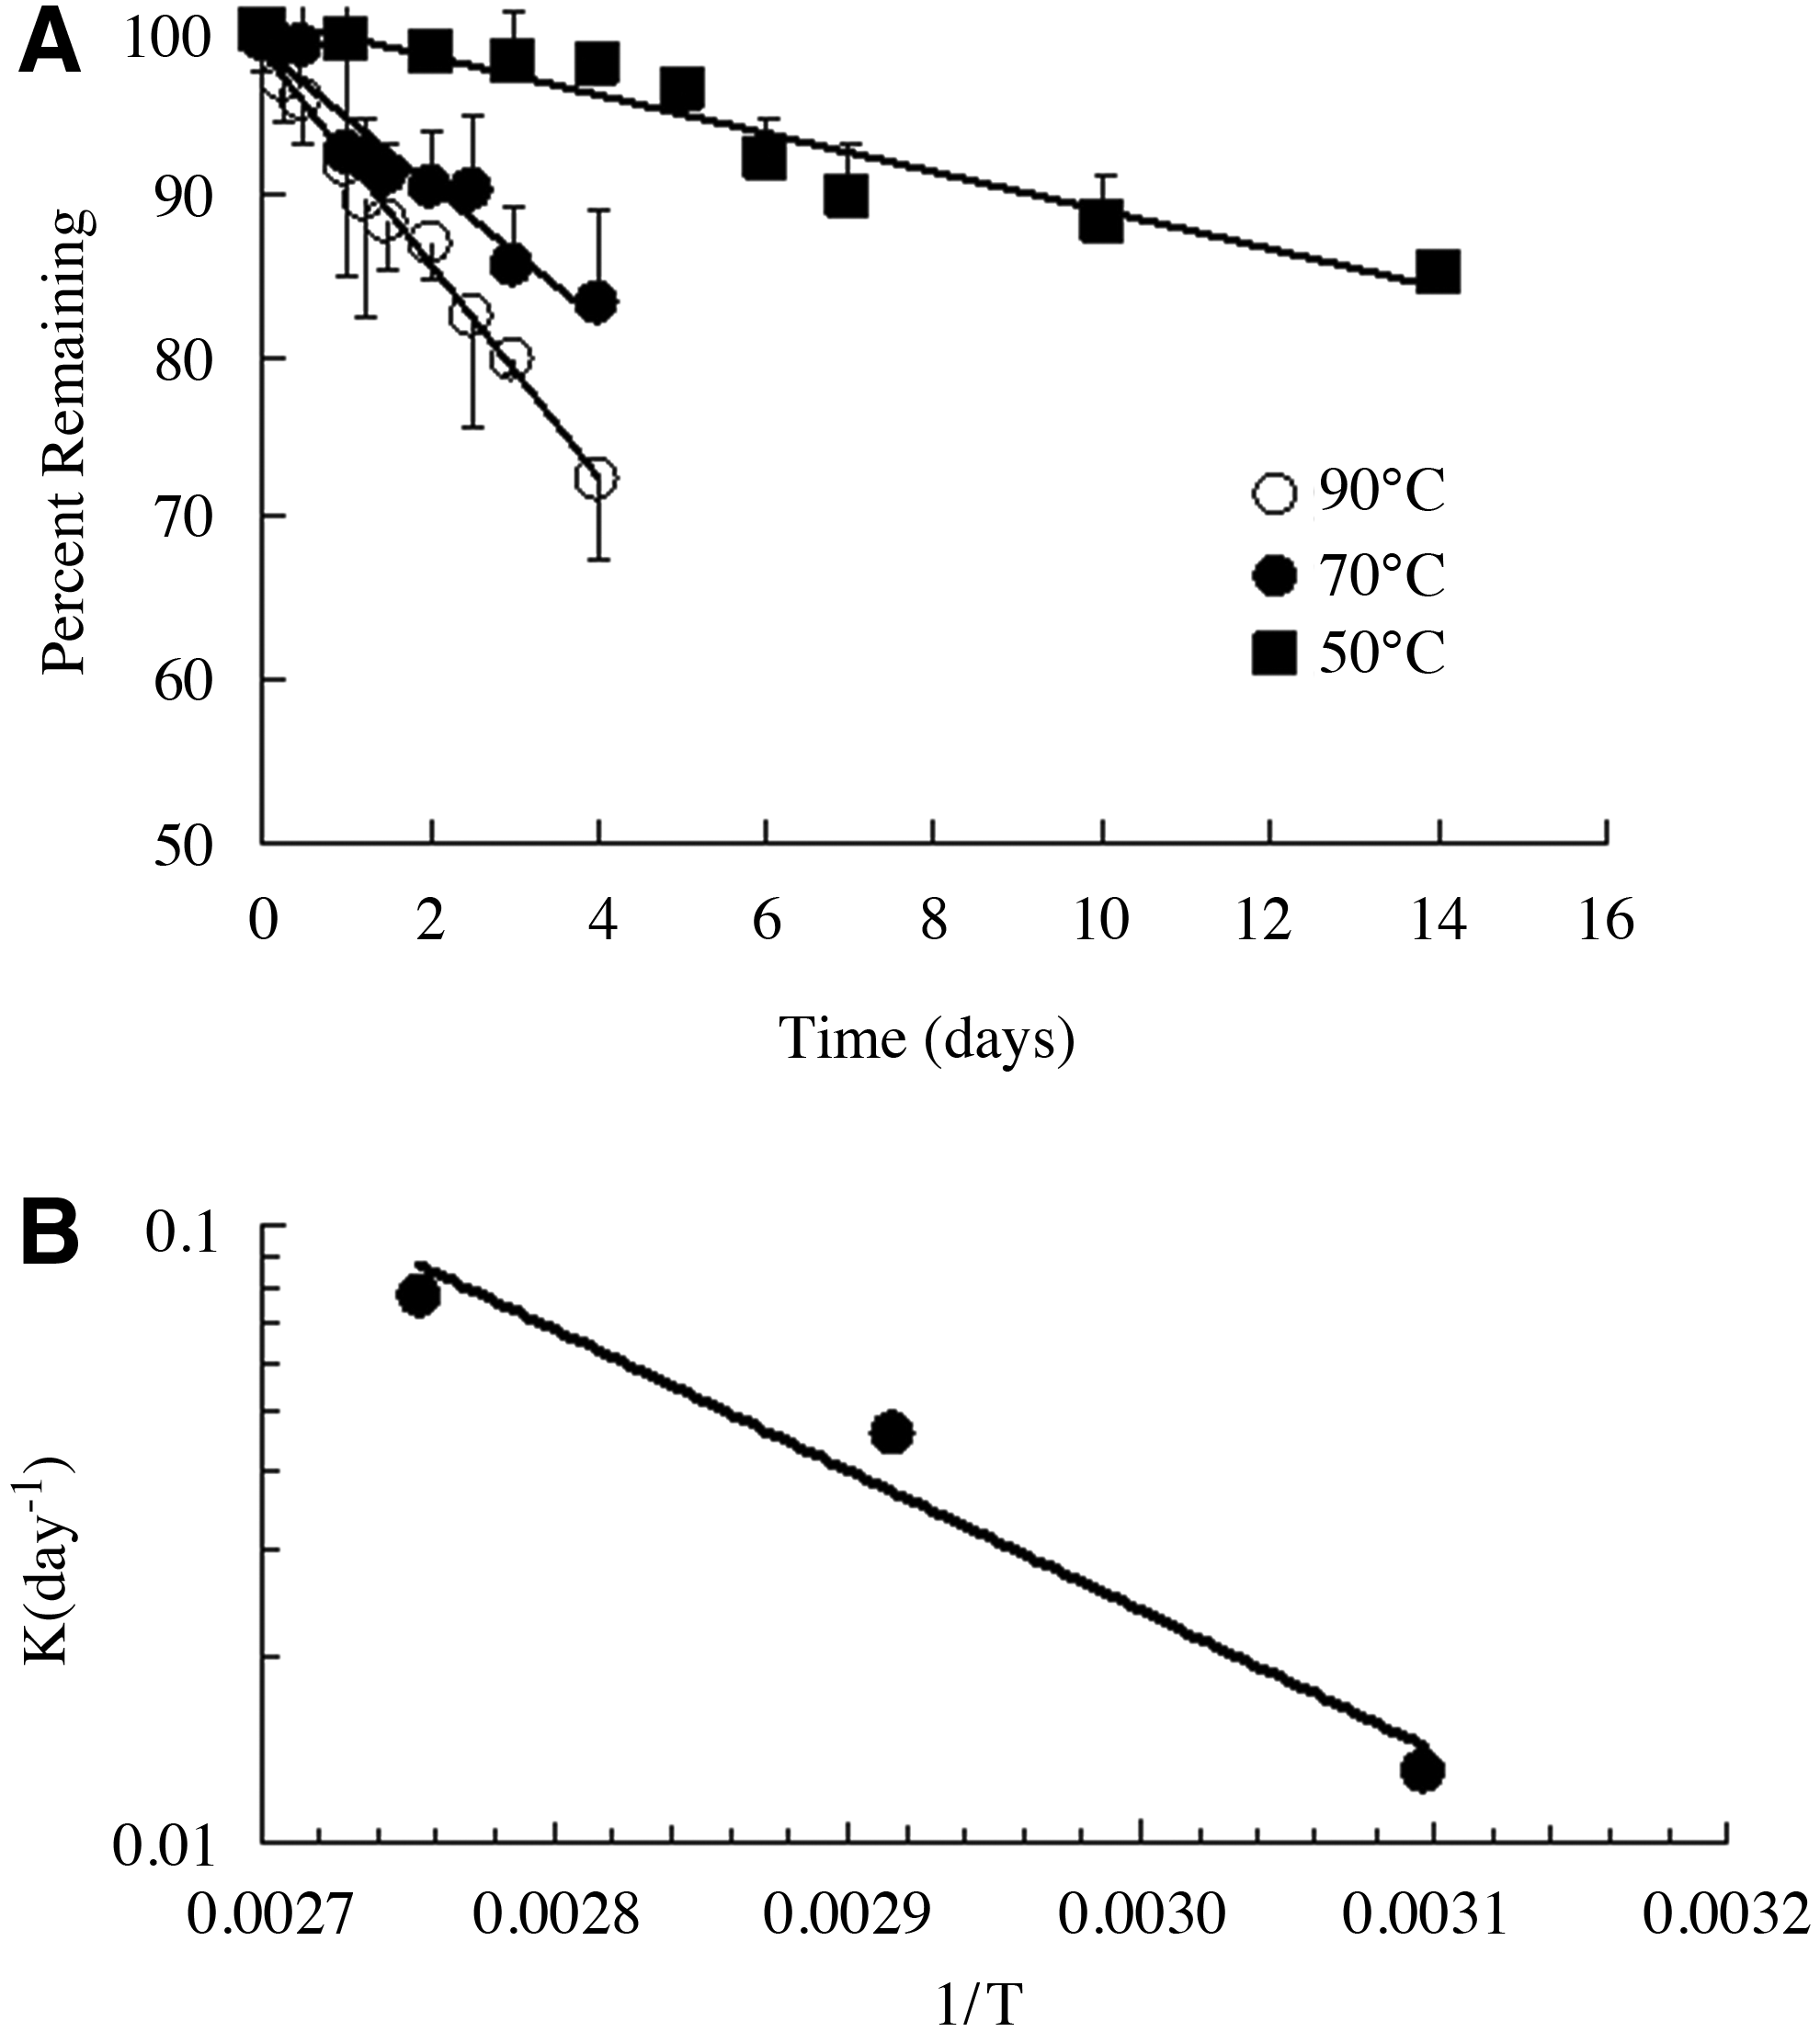
Degradation profiles and Arrhenius plot for LA aqueous preparations.
Shelf life (defined as the time to 10% degradation) was calculated as 0.1 divided by the degradation rate constant at 25°C (k25).
The degradation rate constant of the LA preparations at 25°C was estimated using activation energy (10,450 cal/mol, determined from the Arrhenius equation of 3% LA) and its degradation rate constant at 50°C.
Blood sugar levels in STZ-injected rats
Wistar rats were injected with the STZ solution to induce hyperglycemia, their blood sugar levels were significantly higher than those of the vehicle-injected rats 4 and 7 days after STZ injection. The average blood sugar levels of STZ-induced diabetic rats were ∼3- to 5-fold times higher than those of the vehicle-injected rats. The average body weight of STZ-induced diabetic rats was also significantly lower compared with the control rats (Table 4).
Mean±SD (n=6); aP<0.05.
Vitreous fluorescence
Wistar rats were evaluated using an ocular fluorometer to determine the penetration of fluorescein through the blood–retinal barrier on the 8th day after STZ injection. The fluorescence intensity in the vitreous immediately before the lens peak had a relative lower fluorescence intensity, which was used to evaluate the fluorescein leakage from ocular vascular vessels into the vitreous to further assess the protective effect of LA preparations in STZ-induced diabetic rats. Figure 4 shows the results of leaked fluorescein represented as the difference in vitreous fluorescence intensities in rats before and after STZ injection (ΔF, the vitreous fluorescence intensity after STZ injection deducted from the baseline or the measured intensity before STZ injection) following treatment with the LA preparations. A smaller ΔF value indicated a better protective effect in reducing the fluorescein leakage into the vitreous. The differences in fluorescence intensity among the 5 groups were statistically significant (1-way ANOVA, P<0.001). In comparison with the positive control (post hoc test), besides treatment with the 1% LA intravitreal preparation containing 1% HA (P<0.01), treatment with the other 3 LA preparations significantly reduced the fluorescence intensity (P<0.001). The sequence of the protective effects of the LA preparations in reducing the vitreous fluorescence intensity was IP>IV-3>ED>IV-1 (ΔF=5.29±2.75, 11.92±5.54, 19.46±8.32, and 28.6±17.78, respectively). The 3% LA intraperitoneal preparation displayed the best therapeutic effect among the 4 investigated LA formulations.

Comparison of the vitreous fluorescein intensities in streptozotocin (STZ)-induced diabetic rats treated with various LA preparations. The fluorescent intensity was determined at 60 min by ocular fluorometry following the tail vein injection with 14 mg/kg sodium fluorescein. The presented values are the differences in fluorescent intensity between baseline (before STZ injection) and 8 days after STZ injection. D0, positive control without LA treatment; IP, once-daily intraperitoneal injection of 3% LA at a dose of 30 mg/kg; ED, once-daily topical instillation of 10 μL of 1% LA eyedrops; IV-1 and IV-3, single intravitreal injection of 10 μL of 1% LA containing 1% (IV-1) or 3% HA (IV-3) 1 day after STZ administration. Mean±standard deviations (n=5). Mean values were compared across groups by 1-way ANOVA and the post hoc test (Dunnett t-test) for multiple comparisons. D0 was the control group compared with other 4 groups, **P<0.01 and ***P<0.001.
Retinal microsections following LA treatments
Figure 5 shows the microsections of retinal tissues around the optical nerve head following hematoxylin and eosin staining. These microsections demonstrated that 3 of the LA preparations provided remarkable protection to reduce retinal damage in STZ-induced diabetic rats after varied nonoral administration. In the absence of LA treatment, a capillary lesion was evident in the inner nuclear layer of diabetic rats. Vascular lesions were almost undetecable in the retinal microsections of the IP group, and the same phenomenon was observed in the control group (vehicle alone). A better protective effect was observed after single intravitreal injection of LA containing 3% HA than after multiple-dose treatment with LA eyedrops.

Microsections of retinal tissues around the optical nerve head from STZ-induced diabetic Wistar rats treated with various LA preparations following hematoxylin and eosin staining.
Discussion
In the present study, LA aqueous preparations were prepared and investigated in STZ-induced diabetic rats following administration via 3 nonoral routes. Three of the LA preparations appeared to exert therapeutic effects in reducing ocular microvascular complications in the STZ-induced diabetic rats. The intraperitoneal injection of 3% LA resulted in the best therapeutic effects among the 4 LA preparations. Moreover, 3 of the investigated preparations had suitable stability for short-term use. Thus, the LA preparations investigated in this study might be useful as nonoral treatments for slowing the progression of ocular angiogenesis in diabetic patients.
During a hyperglycemic state in diabetes, excess glucose enters the polyol pathway and sorbitol is produced in association with a concomitant decrease in NADPH levels. Activation of the polyol pathway results in increased oxidative stress due to reactive oxygen species (ROS, e.g., superoxide, hydrogen peroxide, and lipid peroxide) production, leading to microvascular damage and dysfunction. 18 LA plays an important role in the pyruvate dehydrogenase complex as a coenzyme that catalyzes oxidative decarboxylation of pyruvate in acetyl CoA formation. 19 The activated acetyl unit (acetyl CoA) is then completely oxidized to CO2 by the citric acid cycle, which is a major energy source in biological systems. Furthermore, exogenous LA is rapidly reduced to dihydrolipoate in cells, which can combine free radical scavenging and metal chelating properties to regenerate other antioxidants. 20 The in vivo effects of LA are closely related to its antioxidative activities. In diabetic rats, LA can prevent changes in the activities of superoxide dismutase and quinine reductase without significantly affecting enzymes involved in glutathione metabolism. Lipid peroxidation, an early marker of oxidative stress in a diabetic retina, is significantly inhibited by LA. 21 Moreover, LA and other small molecule antioxidants, such as taurine, can reduce the severity of lung inflammation in lipopolysaccharide-induced animal models by decreasing ROS production.22,23 Hence, the therapeutic effects of LA in reducing ocular microvascular damage in diabetic rats were closely related to the maintenance of endogenous cellular antioxidant levels and suppression of proinflammatory mechanisms. 24
Ocular fluorometry is often applied to measure the fluorescein leakage from ocular blood vessels into the vitreous to evaluate the progression of diabetic retinopathy in patients 24 and STZ-induced diabetic animal models.15,16 It is a noninvasive in vivo approach for directly evaluating diabetic retinopathy without using invasive vitreous sampling methods. The method is very sensitive, as it can measure fluorescein leakage at the nanogram level. Thus, this method was employed to assess the protective effects of the LA preparations. Fluorescein leakage significantly reduced after treatment with the 3 LA preparations in STZ-induced diabetic rats within a short period of 8 days. The approach can be performed conveniently and saves experimental time in assessing the retinal protection of LA in diabetic rats effectively.
The stability of LA in the aqueous solution is also an important factor affecting its biological function as an antioxidant. Three of the investigated LA formulations remained stable, suggesting that they could be stored for≥4 weeks for usage as diabetic retinopathy treatment. The 1% LA intravitreal formulation containing 1% HA had the highest degradation rate constant and poor stability. The HA concentration of the formulations appeared to influence the stability of LA preparations. HA molecules might accelerate LA degradation, but this could not be confirmed because the LA preparation with a higher HA concentration had better stability. Thus, HA might increase the viscosity of the LA solution. The viscosity of the LA preparation containing 3% HA was significantly higher compared with the LA preparation containing 1% HA (42.1 vs. 28.1 cps). Higher viscosity reduced the collision frequency between reactant molecules in gelatinous aqueous preparations and consequently decreased the occurrence of degradation to improve drug stability and prolong the shelf life of LA preparations. The protective effect of LA aqueous preparations on the retina might also be affected by their viscosities. The 1% LA intravitreal formulation containing 3% HA had a higher viscosity associated with a lower release rate of LA and an extended release period in the vitreous, thus resulting in better protection than the LA preparation containing 1% HA.
Regarding the efficacy of the 2 multiple-dose treatments in reducing ocular vascular damage and fluorescein leakage, the 1% LA intraperitoneal preparation had a better therapeutic effect than the topical eyedrops. The poor efficacy of the LA eyedrops might be explained by their low ocular bioavailability. Many factors, including the instilled eyedrop solution combined with tears eliminated via nasolacrimal drainage, limited drug permeability into the corneal epithelia, and drug physicochemical properties (such as solubility, lipophilicity, and pKa) significantly influenced the ocular bioavailability of LA. Because of ocular physiological restraints and drug preparation, the ocular bioavailability of drugs in eyedrops is poor (<10%).25,26 LA administered intraperitoneally may have both systemic and local effects. Intravitreal injection and topical instillation did not result in a sufficient LA concentration in blood to achieve therapeutic effects. Systemically distributed LA following intraperitoneal administration could further scavenge ROS and minimize proinflammatory factors in the retina, thus reducing microvascular complications. Furthermore, therapeutic levels of LA might protect injured islets from STZ- or ROS-induced damage during the experimental period. Chou and Sytwu revealed that lentiviral vector-mediated transduction of the antioxidative gene thioredoxin (TRX) could prolong transplanted islet survival in nonobese diabetic mice. 27 TRX, a redox-active protein, can protect cells against oxidative stress and apoptosis. TRX overexpression protects β-cells in vivo against both autoimmune and STZ-induced diabetes. 28 Thus, surviving islets in STZ-induced diabetic rats might partially maintain the ability to secrete insulin following systemic LA administration.
Conclusion
LA aqueous preparations could be prepared and used for nonoral administration. Because orally administered, LA has poor bioavailability (∼20%–40% in rodents and humans),29,30 this dosing strategy may not achieve the desired therapeutic effect. Alternatively, the investigated LA aqueous preparations could be conveniently administered via nonoral routes such as parenteral, intravitreal, or topical. These preparations could be selectively applied according to the patients' needs.
In conclusion, LA aqueous preparations with suitable stability were prepared and investigated. These preparations were stable, with shelf lives of ∼1 month. Therefore, they could potentially reduce ocular microvascular complications to further slow the progression of diabetic retinopathy after nonoral administration.