




Abstract
Abstract
Purpose:
To investigate topographic optic disc changes after surgical intraocular pressure (IOP) reduction in adults with open angle glaucoma (OAG).
Methods:
Optic discs of patients with advanced primary open angle or exfoliation glaucoma were imaged using optical coherence tomography within 1 week before trabeculectomy. Patients were rescanned 1 week, 1 month, and 1 year after surgery. Maximum cup depth (MCD), and average cup depth (ACD) were calculated.
Results:
Twenty-two eyes from 20 patients (age, 70.5±10.6 years; average mean defect of visual field, −15.0±9.8 dB) were followed up for 1 year. The IOP decreased from 22.1±2.8 mmHg at baseline to 11.5±2.6 mmHg 1 year following surgery (P<0.001). One-week and 1-month postoperative IOPs were 11.2±2.8 and 11.2±3.5 mmHg, respectively (P<0.001). Compared to the baseline values (356±172 μm), postoperative ACD showed a significant decrease at 1 week (312±164 μm; P<0.001) and 1 month (338±175 μm; P=0.007) after surgery, but not at 1 year (339±176 μm; P=0.354). Similarly, MCD significantly decreased from baseline (477±190 μm) 1 week (431±203 μm; P=0.029) and 1 month (448±198 μm; P=0.047) after the surgery, but not after 1 year (479±188 μm; P=1.0).
Conclusions:
Trabeculectomy reduces IOP in eyes with advanced OAG, which induces topographic optic disc changes. Such optic disc changes became less pronounced over time and were no longer detectable 1 year after surgery.
Introduction
T
Stereoscopic optic disc photography and scanning laser tomography have been widely used to study optic disc cupping reversal in adults after IOP reduction. Although neural rim thickening and cup decrease have been well documented, the timing and duration of these changes remain unknown. 8 Recently, with advances in enhanced depth imaging (EDI) for spectral domain optical coherence tomography (SD-OCT), it has become feasible to visualize deep ONH structures in glaucoma patients.9,10 Raghu et al. reported a temporary RNFL thickness increase after trabeculectomy on the basis of time domain OCT findings, with regression to baseline values within 3 months, 11 while recently, Reis et al. and Lee et al. used SD-OCT images to show an increase in prelaminar tissue thickness and an anterior LC displacement that persisted for 6 months following glaucoma surgery.6,12
The exact mechanism by which cupping reversal occurs remains to be determined. One hypothesis is that lowering IOP reduces posterior bowing or facilitates anterior displacement of the LC,12,13 but it has recently been shown that cupping reversal results from prelaminar tissue thickening. 6 This anatomic change may result from axonal fluid redistribution or long-term prelaminar glial proliferation. 14 Nevertheless, modeling studies suggest that ONH changes are related to a number of factors such as magnitude of IOP drop, 12 patient age, and stiffness of ocular structures (including LC, scleral canal wall, and peripapillary sclera).9,15
The current study was performed using EDI SD-OCT to assess topographic optic disc changes following successful trabeculectomy in adults with open angle glaucoma (OAG). Our analyses specifically focused on prelaminar tissue and LC displacement.
Materials and Methods
Participants
This study was approved by the local Institutional Review Board of the University of Brescia, Brescia, Italy. Study conduct adhered to the tenets of the Declaration of Helsinki and informed written consent was obtained from all participants before any study procedures or examinations were performed. Patients with advanced primary open angle or exfoliation glaucoma scheduled for trabeculectomy were recruited into the study from the Glaucoma Center of the University of Brescia. Inclusion criteria were a clinical diagnosis of primary open angle or exfoliation glaucoma (according to the European Glaucoma Society criteria) 16 and the need for a trabeculectomy because of glaucoma progression despite maximal medical therapy. Patients were excluded if they had previous or current inflammatory ocular conditions, diabetes mellitus, or a history of previous ocular surgery, excluding uncomplicated cataract surgery at least 6 months before.
The preoperative ONH scan was acquired on the same day as or within 1 week before the surgery. Postoperative scans were acquired 1 week, 1 month, and 1 year following surgery. All examinations were performed at approximately the same time (2 p.m.–4 p.m.). Laser suture-lysis, bleb needling, 5-fluorouracil subconjunctival injection, and topical ocular medications were all used postoperatively, as clinically indicated. Visual field testing (24-2 SITA-Standard, HFA; Carl Zeiss Meditec, Inc.) was performed before trabeculectomy and 6–12 months after surgery. Calibrated Goldman tonometers were used to measure IOP before surgery and at all follow-up time points.
EDI OCT imaging
High-resolution cross-sectional ONH images can be obtained using SD-OCT.17,18 Recently, EDI OCT has made it possible to further improve the depth of optic nerve images.9,10 Briefly, the infrared wavelength (870 nm) of the light source results in a roll-off of sensitivity for deeper ONH structures when focused on the internal limiting membrane. Therefore, the focus is shifted to deeper locations, allowing enhanced imaging of deeper structures like the LC.
Study OCT scans were performed using real-time eye tracking software (AutoRescan, Spectralis OCT; Heidelberg Engineering GmbH) to ensure that the same tissue slice was analyzed at each follow-up visit. This also eliminated the need for eye repositioning and minimized movement artifacts. This technique has been shown to have a coefficient of variation between 1.3% and 3.5% for retinal nerve fiber layer measurements in glaucomatous eyes. 19
Scans were acquired with the center of the radial scanning pattern placed on the optic disc. Only OCT images with a quality score ≥20 were included in analyses. The scanning pattern consisted of six high-resolution line scans, 30° apart. Each radial scan was the average of 30 B-scans, with 768 A-scans per B-scan. The scanning speed was 40,000 A-scans per second. A majority of radial scans did not fully depict the prelaminar tissue, because of the shadowing created by blood vessels or the scleral rim edge. Therefore, in our analyses, we decided to only use the radial scan that depicted the full details of the prelaminar tissue. In all subsequent postoperative visits, the corresponding radial scan with the same orientation as the preoperative one was used for comparisons.
Image and data analysis
The selected images were exported to a photo editing software (Photoshop CS5; Adobe Corporation). A straight reference line (RL) was drawn by one investigator (AR) masked to scan order between opposite edges of the opening in Bruch's membrane.6,7,12,20 For study purposes, the cup area was defined as the cross-sectional optic disc area circumscribed by the RL (vitreal side) and the prelaminar tissue (toward the LC). Then, the uniformly dark area was automatically identified by Photoshop using the Color Selection tool with a tolerance of eight (Fig. 1).
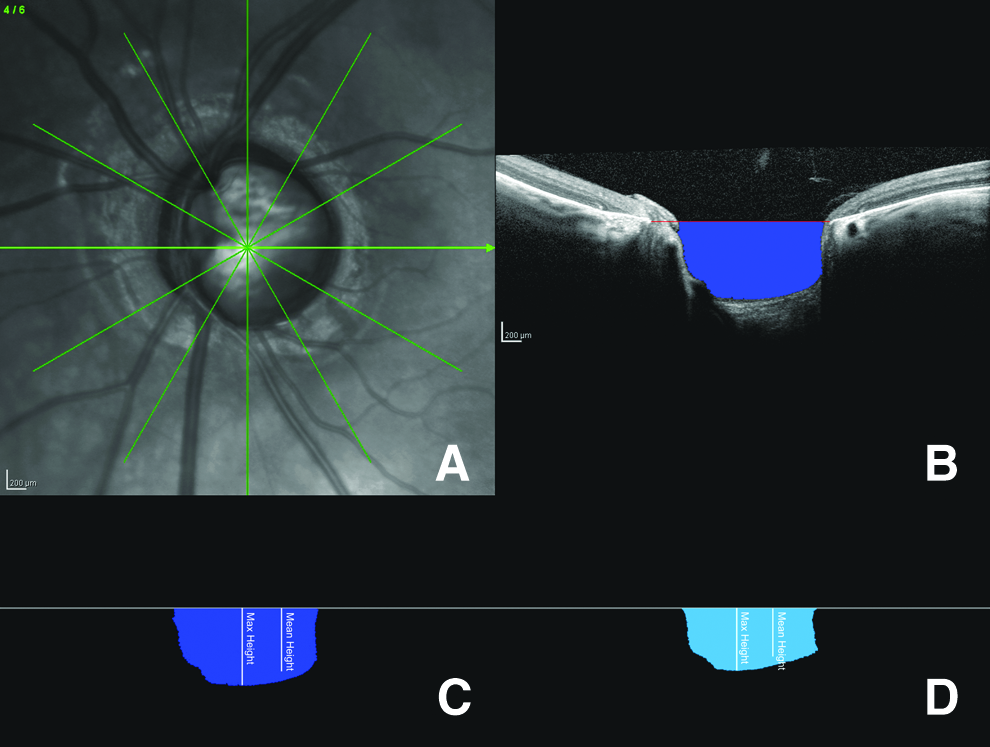
Representative example of radial optical coherence tomography (OCT) scan centered on the optic nerve head
Measurements were automatically converted to microns by using the scale bar in the imported images. Maximum cup depth (MCD), defined as the distance between the deepest point of the prelaminar tissue and the RL, was automatically calculated by the software, and average cup depth (ACD) was obtained by dividing the cross-sectional optic disc area by the cup diameter. These measurements were made at baseline and at all follow-up visits.
Power analysis was performed to justify the number of patients enrolled in the study. Pre- and postoperative tissue displacement was compared using repeated measure analysis of variance with Greenhouse–Geisser and Bonferroni corrections. After testing for normality by the Shapiro–Wilk test (P>0.05), the Pearson's correlation test was performed to assess the relationship between postoperative absolute IOP and changes in ACD and MCD. All statistical analyses were performed using SPSS statistical software (version 20; SPSS, Inc.) and statistical significance was defined as a P-value<0.05.
Results
Twenty-two eyes with OAG from 20 patients (mean age, 70.5±10.6 years) completed the 1-year follow-up period (Table 1). Two eyes of two patients had exfoliation glaucoma. All scanned eyes had at least one high-quality image that fully depicted the details of the prelaminar tissue and possibly of the LC. Therefore, all scanned eyes were included in the analysis. Mean preoperative IOP was 22.1±2.8 mmHg, which had decreased to 11.5±2.6 mmHg 12 months after surgery (P=0.001). Neither an IOP <7 mmHg nor clinically evident macular or optic disc edema was observed in any eye during the 12-month follow-up period. Additionally, no major surgical complications occurred and no further surgical procedures were required during the follow-up period. Laser suture lysis was required in five patients during the first week of recovery following surgery. Three of these patients additionally required bleb needling during the third postoperative month. Two other eyes had subconjunctival 5-fluorouracil injections during the follow-up period.
Data presented as mean±standard deviation, where applicable.
The LC was clearly visible on OCT images in only 9 (41%) eyes (Fig. 2). In the remaining 13 eyes, only part of the LC was sufficiently visible on OCT images (ie, anterior or posterior part only) and a reliable analysis was not feasible. The photo-editing platform allows the user to rapidly switch between superimposed pre- and postoperative images. Using this technique in the nine eyes in which the LC was clearly visible, an anterior displacement of both the prelaminar and laminar tissue was observed in postoperative scans (Fig. 3).
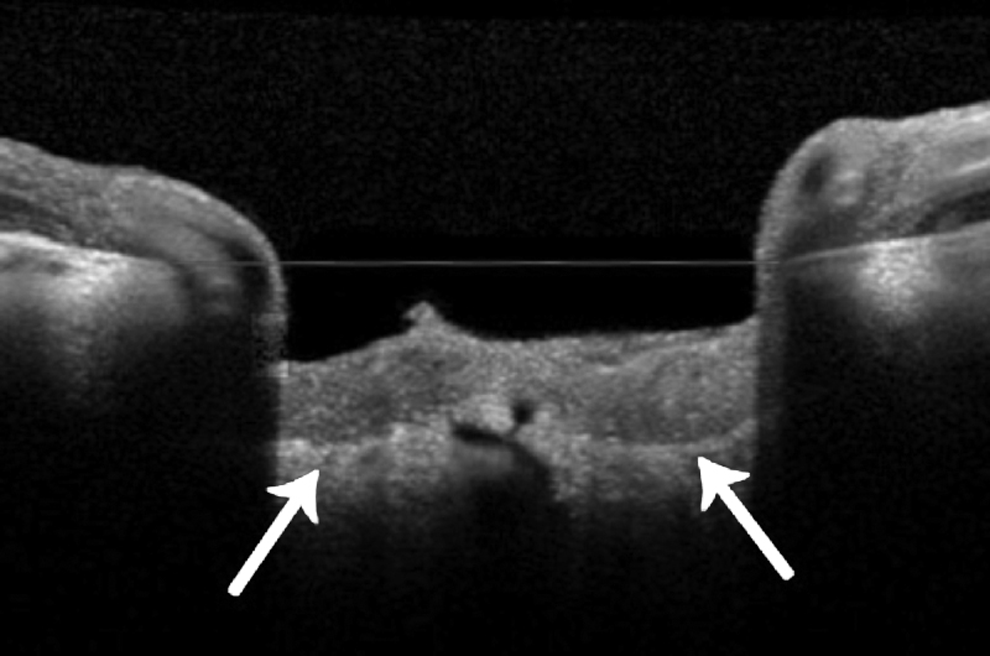
OCT scan showing a clear view of the lamina cribrosa (LC).
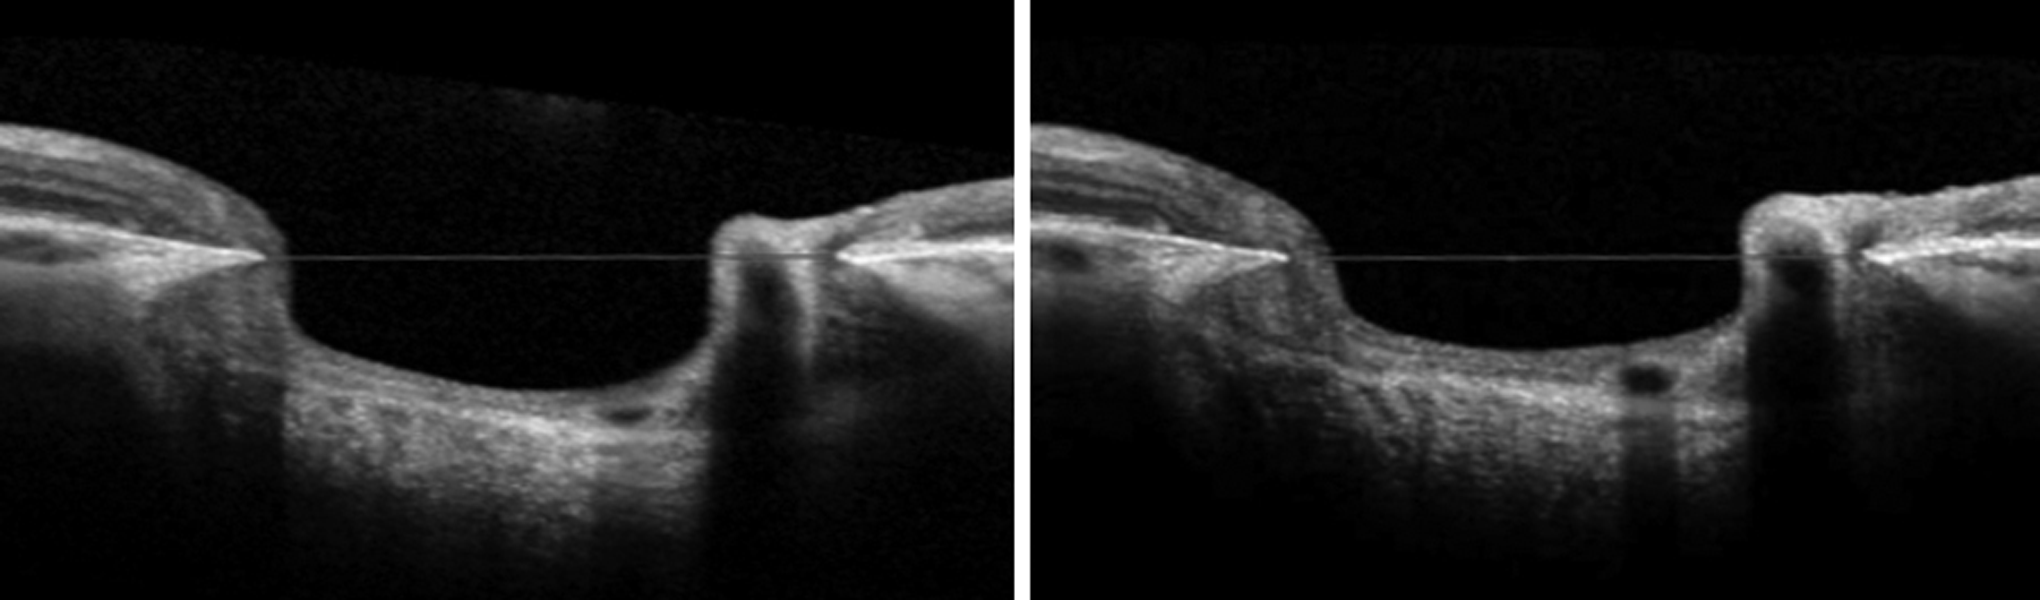
Representative image of clearly visible lamina with anterior displacement of the LC jointly with prelaminar tissue in response to trabeculectomy. Postoperatively, thickening of the prelaminar tissue and a widening of the vessel is also appreciable.
The mean RL length at baseline was 1,577±241 μm and was significantly reduced 1 week after trabeculectomy (1,517±284 μm; P=0.022). No significant differences from baseline were seen 1 month (1,580±223 μm; P=1.0) or 1 year (1,580±222 μm; P=1.0) after surgery.
Preoperative MCD was 477±190 μm and had significantly diminished 1 week (431±203 μm; P=0.029) and 1 month (448±198 μm; P=0.047) following surgery. However, this reduction was only transient and by 1 year, mean MCD had returned to baseline values (479±188 μm; P=1.0).
A similar trend was also observed for ACD. The preoperative value was 356±172 μm, which was significantly reduced 1 week (312±164 μm; P<0.001) and 1 month (338±175 μm; P=0.007) following surgery. However, by 1 year, ACD had returned to preoperative levels (339±176 μm; P=0.354). The results are summarized in Table 2.
All data presented as mean±standard deviation.
Denotes statistically different from baseline.
IOP, intraocular pressure; RL, references line; MCD, maximum cup depth; ACD, average cup depth.
Average mean deviation (MD) of the visual field at baseline was −15.1±9.8 dB, and no significant changes in MD occurred after 1 year (−15.8±9.9 dB; P=0.176). Visual acuity assessed 12 months postoperatively showed a slight, but statistically significant decrease from 0.77±0.15 to 0.74±0.13 (P=0.016).
There was no correlation between postoperative absolute IOP levels and changes in ACD (R=0.029; P=0.899) or MCD (R=0.102; P=0.658).
Discussion
In recent years, a number of studies have investigated the biomechanical characteristics of the ONH and the LC.15,20 It has been shown that mechanical stress and possible deformation of the LC can have a deleterious effect on axonal functioning.21,22 Furthermore, anterior displacement of prelaminar tissue following trabeculectomy for OAG has been described in a number of studies with variable results. Patients in these studies were followed up for periods varying from several weeks to 2 years,1–5 and different patient populations and imaging platforms were used. Results from our study confirm topographic changes in adult ONHs following trabeculectomy, with significant anterior displacement of prelaminar tissue 1 week and 1 month after surgery. However, these changes diminished over time and completely disappeared by 1 year.
Incidentally, the cupping reversal that occurred following trabeculectomy from the IOP reduction was not associated with any visual improvement. This finding is in agreement with results from the Collaborative Initial Glaucoma Treatment Study and other studies.23–25
The RL length was significantly reduced 1 week following surgery, although the magnitude of the decrease was a mere 3.8%. This finding is consistent with previous observations that the optic disc size may be reduced following IOP reduction.12,26 Additionally, Lee et al. observed that the decrease in the scleral canal diameter was significantly associated with the reversal of the LC displacement after trabeculectomy, whereas a larger scleral preoperative canal diameter was associated with a greater ONH tissue displacement. 12
In contrast to other studies6,12,20 that segmented the LC, the entire LC was clearly visible in only nine eyes, despite the fact that EDI OCT was used. We suspect that this difficulty resulted from media opacities, thicker prelaminar neural tissue, and extensive shadowing from blood vessels and/or the scleral rim. Nevertheless, by superimposing the images of visible LC, anterior displacement of prelaminar tissue and the LC were clearly visible (Fig. 3). However, this finding should be interpreted with caution because only a small number of eyes (n=9) had adequate visualization of the LC. On the other hand, Agoumi et al. described displacement of only the prelaminar tissue after transient elevation of IOP with an ophthalmodynamometer. 20 The very different circumstances of acute IOP elevation in the Agoumi study and long-term IOP reduction in our study can explain these discrepancies. Furthermore, Agoumi et al. suggested that this displacement was the result of the inner limiting membrane and prelaminar tissue compression. 20 Still, mathematical models suggest that prelaminar tissue redistributes itself through conformational alterations in adjacent structures and not through actual prelaminar tissue compression. 27 Reversible anterior movement of the LC, associated with LC and prelaminar tissue thickening after trabeculectomy, was also reported in two recent studies.6,12 Lee et al. reported that LC displacement and thickening predominantly occurs in the early postoperative period, and that the magnitude of such changes gradually decreases over time. 12 Reis et al. found that after trabeculectomy, prelaminar tissue thickens by 17 and 14 μm at 3 and 6 months, respectively, 6 thus showing a decreasing trend over time that is consistent with our results and with the findings of Raghu et al. 11
Acute cupping reversal is thought to occur because of the forward ex vacuo movement of the posterior sclera and subsequent neural canal opening. This theory comes from the observation that the amount of anterior LC movement is significantly associated with percent IOP reduction.8,12 According to this hypothesis, prelaminar tissue thickening could occur because of an increase in blood volume with associated changes in blood flow 28 or because of a shift in the axoplasmic fluid from both the peripapillary retinal nerve fiber layer into prelaminar tissue and in the fluid that had been pushed downstream through the LC at higher IOP levels. 6 However, our data do not indicate any correlation between postoperative IOP and changes in the analyzed topographical parameters. Although an indisputable explanation cannot be offered, we believe that this lack of association is due to the inclusion of relatively old patients (age, 70.5±10.6 years) with advanced disease (baseline MD, −15.1±9.8 dB). Conceivably, histological changes, which can lead to stiffening of the scleral canal, the LC, and the posterior sclera, may affect tissue responses in a way that would diminish pressure-related conformational changes in older patients with severe glaucoma. 15
LC is located more deeply in glaucomatous eyes 7 ; thus, postoperative edema of the ONH and the choroid could theoretically be an additional contributory factor to the early cupping reversal, as previously suggested by Greenidge et al. 2 and Spaeth et al. 29
In our cohort, IOP was successfully reduced to a presumably safe 30 level (11.5±2.6 mmHg). Konstas et al. 31 evaluated the 24-h IOP in patients with OAG treated with trabeculectomy versus maximal tolerated medical therapy and found that a successful trabeculectomy provides statistically lower mean, peak, and range of IOP for the 24-h period than maximal tolerated medical therapy in advanced glaucoma patients. It remains unknown if circadian pressure characteristics such as peak IOP or fluctuation are coupled to circadian topographic optic disc changes in surgically or medically treated glaucoma patients. Theoretically, better IOP characteristics in surgically treated patients could be associated with less pronounced topographic optic disc changes. However, the clinical significance of such potential topographic changes is unknown. With the advent of sophisticated imaging technology, this could be a promising direction for future research.
Our study has some limitations. The sample size was relatively small and there were only three follow-up visits. Further studies with larger sample sizes and more frequent follow-up visits are needed to better document the magnitude and time course of ONH changes.
In conclusion, this study using the novel EDI OCT imaging technology shows that cupping reversal following trabeculectomy in adult eyes with OAG occurs mainly in the early postoperative period, and that these changes diminish over time. Furthermore, the LC appears to move jointly with prelaminar tissue. Further in vivo studies are needed to better characterize IOP-related ONH changes and the role of the neural canal and the LC in the glaucomatous process.
Meeting Presentation
Presented, in part, at the annual meeting of the Association for Research in Vision and Ophthalmology, Fort Lauderdale, FL, May 2012.
Footnotes
Author Disclosure Statement
The authors have no conflicts of interest to declare. The authors alone are responsible for the content and writing of the article. Financial Support: none.