
Abstract
Abstract
Purpose:
To investigate the efficacy of 2-phenyl-APB-144 (APB)-induced retinopathy in a rat model and its underlying mechanisms, with a particular focus on retinal pigment epithelium (RPE) degeneration.
Methods:
Electroretinograms (ERGs) were evaluated in APB-administered rats. In ARPE-19 cells, cathepsin, and autophagy marker LC3 were analyzed by western blotting or immunohistochemistry. Organelle pH alterations were detected by Acridine Orange Staining. Endoplasmic reticulum stress-dependent or -independent cell death signaling was analyzed by reporter gene assays of activating transcription factor 4 (ATF4), immunoglobulin heavy-chain binding protein (BiP), inositol-requiring enzyme 1α (IRE1α), quantitative reverse transcription-polymerase chain reaction of CHOP mRNA, and the effects of pharmacological eukaryotic initiation factor 2α (eIF2α) dephosphorylation inhibitor, Salubrinal. The pharmacological effects of Salubrinal were examined by fluorophotometry, electrophysiology, and histopathology.
Results:
APB-induced ERG amplitude reduction and fluorescein permeability enhancement into the vitreous body of rats were determined. In ARPE-19 cells, APB-induced organelle pH alterations, imbalances of procathepsin and cathepsin expression, the time-dependent accumulation of LC3-II, and the translational activation of ATF4 were determined. Salubrinal protected against APB-induced cell death and inhibited ATF4 downstream factor CHOP mRNA induction. In APB-induced rat retinopathy, systemic Salubrinal alleviated the enhanced fluorescein permeability into the vitreous body from the RPE, the reductions in ERG amplitudes, and RPE degeneration.
Conclusions:
Organelle pH alterations and autophagy impairments are involved in APB-induced RPE cell death. Inhibition of eIF2α dephosphorylation protected the RPE in vivo and in vitro. These findings suggested that APB-induced retinopathy is a valuable animal model for exploring the mechanism of RPE-driven retinopathy.
Introduction
A
The RPE contains numerous lysosomes that maintain the retinal visual cycle and function. 9 Chloroquine was reported to possess lysosomal pH alteration properties. 10 Lysosomes contain various acid hydrolases, including cathepsins, and degrade old, unneeded intracellular substances. 9 During autophagy, lysosomes fuse into autophagosomes and form autolysosomes that degrade a variety of substances. 11 Autophagic impairment can be experimentally induced by lysosomal membrane v-ATPase inhibitor bafilomycin A1 and by starvation treatment,12,13 through eukaryotic initiation factor 2α (eIF2α) kinase and through activation of transcription factor 4 (ATF4) pathway induction, 14 and as measured by the accumulation of autophagic markers, such as LC3. 13 These indications are observed in the central nervous system of Atg-7 knockout or lysosome-associated membrane protein (LAMP)-2 knockout mice, which exhibited neurodegeneration. 15 Therefore, the autophagic machinery was considered important for homeostasis of the central nervous system. 11
2-Phenyl-APB-144 (APB) is an original compound synthesized as an anti-schistosomiasis treatment.16,17 Unexpected side effects were observed in rats, demonstrating that APB specifically damaged the RPE and promoted its degeneration within 7 days.18,19 However, availability of an animal model, and the underlying mechanisms of the compound, were not investigated until recently. To our knowledge, there are no reports showing the effects of APB on the organelle pH and autophagic machinery or on the underlying molecular mechanisms of pathology in the RPE. Moreover, the systemic effects and specificity for the RPE after oral APB administration remain unclear.
This study investigated the efficacy of an APB-induced retinopathy model as a research tool for studying RPE degenerative pathology. To accomplish this, we examined: (1) the effects of APB on the organelle pH and autophagic machinery, with the underlying stress response mechanisms, as well as the pharmacological inhibition of cell death, using the human RPE cell line ARPE-19, (2) the active substance of the RPE toxicant after APB administration, and the toxicological effects of APB on hematology and blood chemistry in rats, and (3) the effects of the eIF2α dephosphorylation inhibitor Salubrinal on APB-induced retinopathy, in rats.
Methods
Drugs and chemicals
APB (C24H20N2O2; molecular weight, 368.44) was synthesized in our laboratory according to the chemical structure (Fig. 1) as provided in a previous report. 18 Salubrinal 20 was from Calbiochem (La Jolla, CA), N-acetyl cysteine (NAC) and bafilomycin A1 (bafilomycin) were from Sigma-Aldrich (St. Louis, MO), 4-(2-aminoethyl)benzenesulfonyl fluoride hydrochloride (AEBSF) was from Alexis (Farmingdale, NY), z-VAD-fmk was from the Peptide Institute, Inc. (Osaka, Japan), and Acridine Orange was from Life Technologies (Carlsbad, CA).
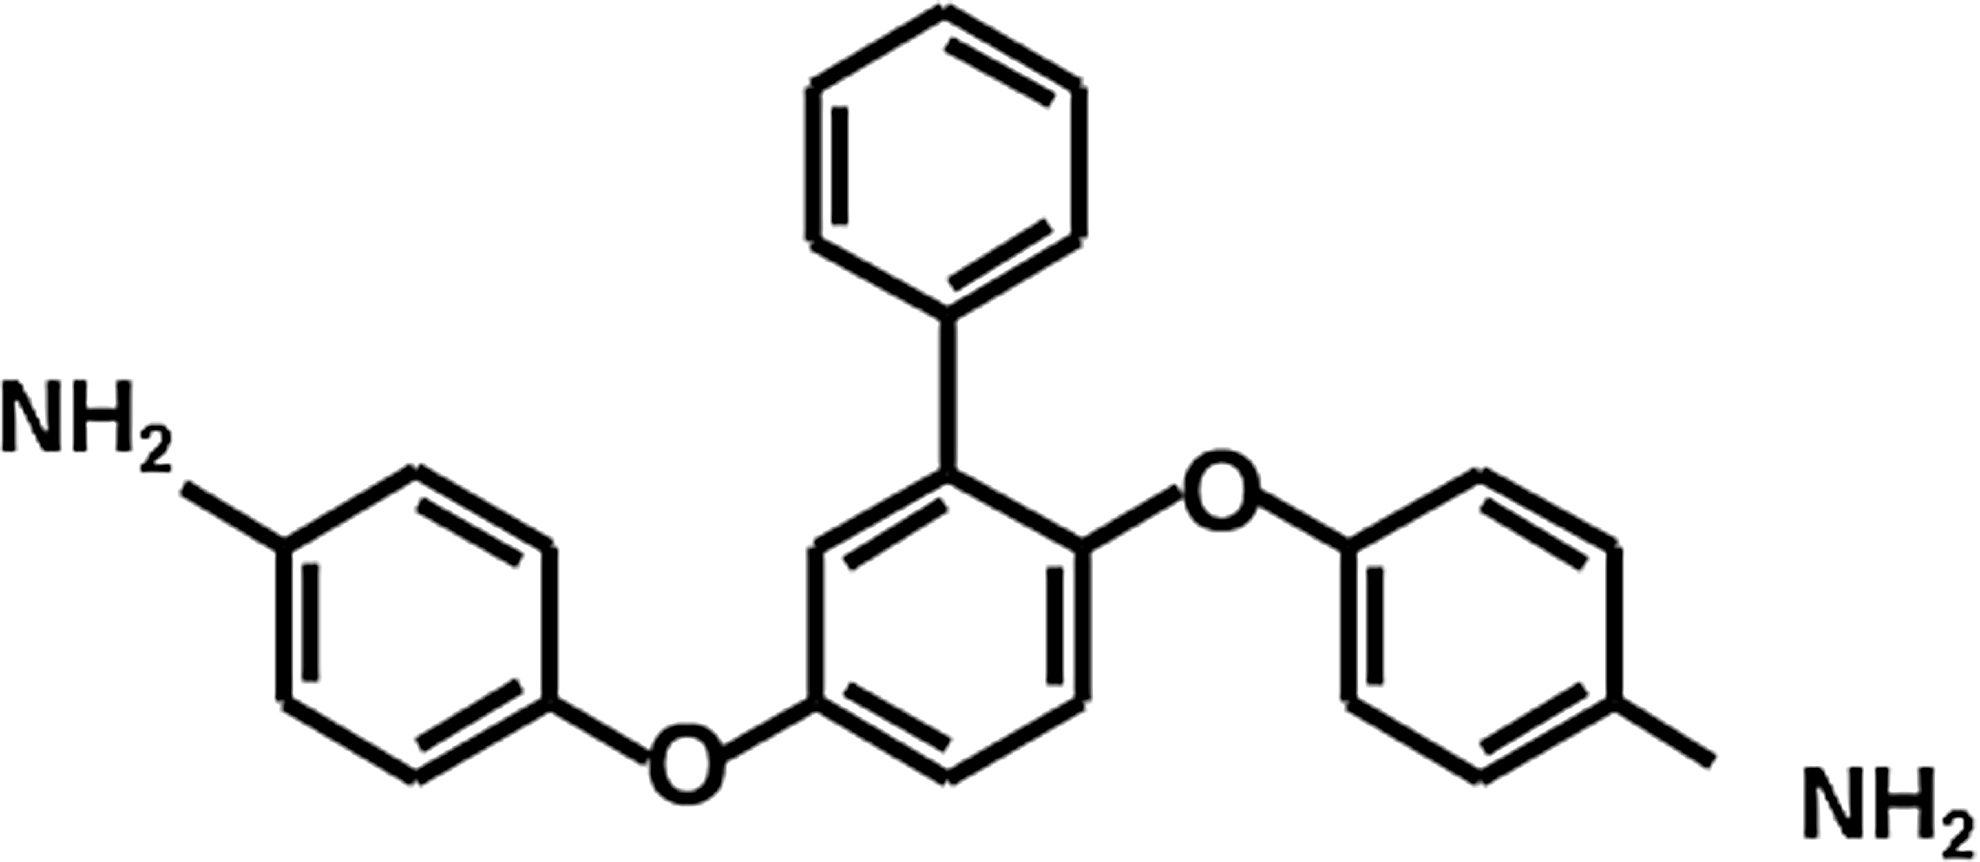
Chemical structure of 2-phenyl-APB-144 (APB).
Experimental animals
All experiments were conducted in accordance with the rules of the Association for Research in Vision and Ophthalmology Statement for the Use of Animals in Ophthalmic and Vision Research, and were approved by the Institutional Animal Care and Use Committee of Santen Pharmaceutical Co. Ltd. Male Brown Norway rats (body mass, 189–201 g; Charles River Laboratories, Yokohama, Japan) were housed in a specific pathogen-free facility, and provided with food and water ad libitum.
Electroretinograms and vitreous fluorophotometry in APB-administered rats
APB (40 mg/kg) was orally administered to rats. Seven days after the administration, flash electroretinograms (ERGs) were recorded with an ERG recording system (Portable ERG&VEP LE-3000; Tomey, Nagoya, Japan). The rats were maintained in total darkness for 1 h and then prepared for ERG recordings under dim red light. Immediately after this, the rats were anesthetized with an intramuscular cocktail of ketamine (120 mg/kg body weight) and xylazine (6 mg/kg body weight). One drop of 0.5% tropicamide (Mydrin-P; Santen, Osaka, Japan) was applied to the cornea to dilate the pupil, and 1 drop of 0.4% oxybuprocaine (Benoxil; Santen) was applied for local anesthesia. A single flash of saturating intensity (3,000 cd/cm2 for 10 ms) was applied to each rat, and the ERG responses from both eyes were recorded. The a- and b-wave amplitudes from each eye were determined and used for analysis of retinal function.
Blood–retinal barrier (BRB) permeability was evaluated by vitreous fluorophotometry with a small animal adaptor, 21 at day 8, as follows. Rats were instilled with 1 drop of 0.5% tropicamide and anesthetized as described above. After the anesthetization, 1 mL/kg of 1% fluorescein sodium, in saline, was intravenously (i.v.) injected. After 45 min, an intraocular fluorescein intensity curve was obtained using a Fluorotron Master (OcuMetrics, Mountain View, CA) as previously described. 21 From the fluorescence intensity curve of the instrument, the value at 5–6 mm distance was adopted as the value for the mid-vitreous cavity. Immediately after, blood samples were collected and centrifuged at 1,500g for 5 min. The obtained unbound plasma fluorescein was diluted 41-fold, and was measured with the Fluorotron Master, adapted for plasma measurement. As an indicator for the BRB permeability in each eye, the fluorescein concentration (ng/mL) in the vitreous body was divided by that in the plasma.
Cell culture
ARPE-19 cells (CRL-2302; American Type Culture Collection, Manassas, VA) were cultured in Dulbecco's modified Eagle's medium–Nutrient Mixture F-12 (Nacalai Tesque, Inc., Kyoto, Japan) supplemented with 10% fetal bovine serum (Gibco, Tokyo, Japan), and penicillin–streptomycin (100 U/mL–100 μg/mL; Gibco) at 37°C, in a humidified 5% CO2 incubator. The cells were used for experiments when they reached approximate subconfluency. To ensure the validity of the in vitro study results, dead cells treated with APB were carefully washed and removed before the assays. In addition, protein volume in each loading sample was carefully and equally adjusted for immunoblot analysis.
Cytotoxicity
Cells were treated with 0–100 μM APB, at 10 μM intervals, for 3, 6, and 24 h. APB-induced cell death was quantified using a WST-8 assay, by measuring formazan released into the culture medium (Dojindo, Kumamoto, Japan). Formazan was estimated using a microplate reader (Bio-Rad, Hercules, CA), by measuring the rate of decrease in absorbance at 450 nm. After background subtraction, the formazan values were normalized to the mean maximal value (defined as 100%).
Immunoblotting
For cathepsin D and L analysis, cells were treated with 100 μM APB or 100 nM bafilomycin for 0, 3, 6, 12, 18, and 24 h. Dimethyl sulfoxide (DMSO, at 0.1% w/v) was added to the medium as a negative control. After treatment, the cells were washed with phosphate-buffered saline (PBS), collected in loading buffer (500 mM Tris-HCl, 2% sodium dodecyl sulfate, 0.01% bromophenol blue, 10% glycerol, 0.1 M dithiothreitol), and denatured at 98°C for 5 min. Aliquots (15 μg protein) were electrophoresed in 10% polyacrylamide gels. The separated proteins were transferred to polyvinylidene difluoride membranes (Millipore, Billerica, MA) and immunolabeled with an anti-cathepsin L (C-18) goat antibody (Santa Cruz Biotechnology, Dallas, TX) or anti-cathepsin D rabbit antibody (Cell Signaling Technology, Danvers, MA) at a 1:200 dilution at 4°C overnight. Subsequently, the membranes were incubated with horseradish peroxidase-labeled anti-rabbit or anti-goat IgG (MBL, Nagoya, Japan) at a 1:1,000 dilution for 2 h at room temperature. The bound antibodies were detected by an electrochemiluminescence method (GE Healthcare, Tokyo, Japan). Images of the visualized proteins were captured by a luminescent image analyzer (LAS4000; GE Healthcare) and quantified using MultiGauge software (Fujifilm, Tokyo, Japan). The quantified intensity ratios of each procathepsin to mature cathepsin were determined.
For LC3 analysis, cells were treated with 100 μM APB or 100 nM bafilomycin for 0, 3, 6, 12, 18, and 24 h. Other cell samples were treated with Earle's balanced salt solution (EBSS) for 3 h, as a starvation condition. After treatment, the separated proteins were transferred to polyvinylidene difluoride membranes as described above. The proteins were immunolabeled with an anti-LC3 rabbit antibody (MBL) at a 1:500 dilution, or with an anti-β-actin (13E5) rabbit antibody (Cell Signaling Technology) at a 1:1,000 dilution, at 4°C overnight. The antibody-bound proteins were visualized as described for the cathepsin D and L analyses. For expression level analyses, the LC3-II intensity was normalized by the β-actin intensity. Images of the visualized proteins were captured and quantified as described above.
Organelle pH analysis
Cells were seeded onto cover glasses and treated with 100 μM APB or 100 nM bafilomycin for 6 h. After washing with PBS, the cells were stained with 10 μg/mL Acridine Orange for 10 min and washed with PBS. The cell nucleus was stained with 1 μg/mL of Hoechst 33342 (Dojindo) for 5 min and visualized by confocal fluorescence microscopy with 405 nm excitation for green fluorescence (498–700 nm) of Acridine Orange, using an LSM710 system (Carl Zeiss, Oberkochen, Germany). Fluorescence intensity was also determined in 20 cells per treatment sample. Relative intensity to control was determined in APB- and bafilomycin-treated samples.
Immunocytochemistry
Cells were seeded onto glass slides and treated with 100 μM APB or 100 nM bafilomycin for 12 h. Other cells were subjected to starvation by incubation with EBSS for 12 h. After treatment, the cells were fixed with 4% paraformaldehyde in PBS for 15 min at room temperature, and treated with 100 μg/mL digitonin in PBS for 10 min. After 3 washes with PBS, the cells were incubated with an anti-LC3 rabbit antibody (MBL) at a 1:500 dilution at 4°C overnight. After washing with PBS, the cells were incubated with Alexa 488-conjugated anti-rabbit IgG (Invitrogen, Carlsbad, CA) at a 1:500 dilution for 1 h at room temperature. The cells were shielded with VECTASHIELD mounting medium containing DAPI (Vector Laboratories, Burlingame, CA) and visualized using an LSM710 system, as described above. In each treatment sample, the number of LC3-immunopositive puncta exceeding 0.2 μm in diameter was counted in 50 cells using ImageJ software (National Institutes of Health, Bethesda, MD).
Reporter gene assay
The pCAX-hATF4(1-285)-hRL-HA was generated by inserting a partial hATF4 cDNA (1-285), 22 and HA-tagged Renilla luciferase into the multiple cloning site (MCS) of the pCAX vector. The pcDNA-FL was constructed by inserting firefly luciferase into the MCS of the pcDNA3.1 vector. The pGL3-hBiP pro.-132 was a gift from Dr. K. Mori (Kyoto University). 23 To generate the plasmid pTKX-ERAI-Luc, the KpnI/BamHI insert fragment of pCAX-ERAI-Luc (15) 24 was cloned into the KpnI/BamHI sites of the pTKX3 vector. The pRL-SV40 was obtained from Promega KK (Tokyo, Japan).
ARPE-19 cells (1 × 10⁶ cells/mL/tube) were transfected with the pCAX-hATF4(1-285)-hRL-HA reporter plasmid and pcDNA-FL control plasmid (2 μg) using an Amaxa Cell Line Nucleofector Kit V (Amaxa, Koln, Germany), according to the manufacturer's instructions. In the same way, pGL3-hBiP pro.-132 and pTKX-ERAI-Luc were transfected with pRL-SV40 (Promega KK). At 24 h after transfection, the cells were seeded onto 12-well plates at 2 × 10⁵ cells/well, and incubated overnight. After the incubation, the cells were treated with 100 μM APB for 0, 3, 6, 9, and 24 h. The promoter activities were measured using a Dual-Luciferase Assay System (Promega KK), and the luminescence levels were detected by a luminometer (AB-2200-R; ATTO, Tokyo, Japan). The relative luciferase activity was defined as the percentage of luciferase activity relative to that in cells without APB treatment (time 0) as a control.
Quantitative reverse transcription-polymerase chain reaction
Cells were treated with 100 μM APB and Salubrinal, or 100 μM APB alone, for 6 h. Subsequently, total RNA was prepared using an RNeasy Mini Kit (Qiagen, Hilden, Germany), according to the manufacturer's protocol. Total RNA (300 ng) was reverse-transcribed for 15 min at 37°C in final concentrations of 1× PrimeScript RT reagent (TaKaRa, Otsu, Japan), 50 pmol Oligo (dT) primer (Invitrogen Life Technologies), and 50 pmol random 6 mers (Invitrogen Life Technologies). The primers used in this study were: human CHOP, forward (fw)-5′-CAG AAC CAG CAG AGG TCA CA-3′, and reverse (rev)-5′-AGC TGT GCC ACT TTC CTT TC-3′; and human GAPDH, fw-5′- GAA ATC CCA TCA CCA TCT TCC AGG-3′, and rev-5′- GAG CCC CAG CCT TCT CCA TG-3′. Both primer sets were obtained from Nihon Gene Research Laboratories, Inc. (Sendai, Japan). The reaction was initiated by heating to 85°C for 5 s, followed by storage at 4°C. Each sample was diluted to 1:10 with distilled water, for polymerase chain reaction (PCR) analysis. An established quantitative PCR analysis, using the relative quantification method (ΔΔCT), was conducted in an ABI PRISM 7500 Sequence Detection System (Applied BioSystems, Darmstadt, Germany), according to the manufacturer's protocol. Each PCR amplification was performed in a volume of 12.5 μL, containing 6.25 μL of SYBR Green PCR master mix (Applied BioSystems), 1 μM primers (1:1 mixture of forward and reverse primers), and 3 μL of cDNA template. Following denaturation at 95°C for 5 min, 40 cycles were performed, with 10 s at 95°C, and with annealing and extension for 30 s at 60°C. Before quantitative data analysis, each value was normalized with an endogenous control (GAPDH).
Pharmacological effects of Salubrinal
ARPE-19 cells were treated with 100 μM APB and 1, 10, and 100 μM of each test substance (z-VAD-fmk, NAC, AEBSF, and Salubrinal), for 24 h. After treatment, the cell viability was assessed as described above.
For in vivo examination, APB (40 mg/kg) or its vehicle were orally administered to rats. At 6 h after APB administration, 2 mg/kg of Salubrinal was intraperitoneally administered. From 1 day after APB administration, Salubrinal was injected once daily for 8 days. After the anesthetization, ERG responses were recorded at day 7, and BRB permeability was evaluated by vitreous fluorophotometry at day 8, as described above. Immediately after the vitreous fluorophotometry, the anesthetized rats were euthanized by abdominal aorta excision. For light microscopy, eyes were enucleated, fixed with 2.5% glutaraldehyde and 10% formaldehyde, in phosphate buffer (pH 7.4), overnight at room temperature, dehydrated in a graded ethanol series, and embedded in paraffin. Midsagittal sections (3-μm thickness) were prepared for Hematoxylin and eosin staining. Pathological findings were visualized and photographed under a BX50 microscope (Olympus, Tokyo, Japan).
Hematology and blood chemistry analyses
APB (20, 40, and 80 mg/kg) or its vehicle were orally administered to rats. Body weights were measured at days 0, 1, and 4. On day 4 after the administration, the rats were anesthetized as described above, and blood was drawn from the abdominal postcava. Blood samples were also obtained from untreated normal rats. In the hematology analysis, for measurement of the prothrombin time and activated partial thromboplastin time with an automatic blood coagulation analyzer (Model KC-10A; Amelung Sigma Diagnostics, St. Louis, MO), ∼1.8 mL/body of blood was drawn with a syringe containing 150 μL of 3.8 w/v% sodium citrate solution, as an anticoagulant. Plasma was obtained by centrifugation (20°C, 1,710g, and 3,000 rpm, for 15 min) and used for analysis. For other measurements, ∼1 mL/body of blood was drawn with a syringe and treated with EDTA-2K as an anticoagulant. Whole blood was subjected to analysis using an ADVIA120 hematology system (Siemens, Berlin, Germany). For the blood chemistry analysis, ∼1 mL/body of blood was drawn with a syringe and collected in a blood collection tube containing blood coagulation promoter films (Terumo, Tokyo, Japan). Serum was obtained by centrifugation, as described above, and subjected to analysis using a BM6010 system (JEOL, Tokyo, Japan). All parameters, units, and methods are shown in Appendix Tables A1 and A2.
Pharmacokinetics
The plasma APB concentrations were determined in male Brown Norway rats after peroral (p.o.) administration at 40 mg/kg, and i.v. administration at 1 mg/kg. For the p.o. administration, APB was dissolved in corn oil (Wako Pure Chemical Industries Ltd., Osaka, Japan). For the i.v. administration, APB was dissolved in 10% Cremophor EL (Nacalai Tesque, Inc.), in saline. Plasma was collected from blood samples taken at 0.5, 1, 2, 4, 6, and 24 h (p.o.) and at 0.25, 0.5, 1, 2, 4, 6, and 24 h (i.v.) after dosing. The plasma samples were stored at approximately −80°C until analysis.
The APB concentrations in plasma were determined by liquid chromatography coupled with tandem mass spectrometry (LC/MS/MS). A 10 μL plasma sample was precipitated with 180 μL of acetonitrile containing 1-4-bis(4-aminophenoxy)benzene (Tokyo Chemical Industry Co. Ltd., Tokyo, Japan), as an internal standard, and the supernatant was diluted 10-fold with 0.1% formic acid to obtain the sample solution. A 5 μL sample solution was injected onto an analytical column (XTerra Phenyl; inner diameter, 2.1 × 50 mm, 3.5 μm; Waters Co., Milford, MA), and separated with 0.1% formic acid in distilled water, and 0.1% formic acid in acetonitrile, at 0.5 mL/min. The eluted APB and internal standard were detected by MS/MS (API4000; AB Sciex, Foster City, CA) with turbo spray ionization in the positive ion mode. The sensitivity (lower limit of quantification) of 0.05 μg/mL was established within 20% of the nominal value.
Pharmacokinetic parameters were obtained using WinNonlin Professional version 5.2.1 software (Pharsight Co., St. Louis, MO). The area under the time–concentration curve (AUC) was calculated using a linear logarithmic trapezoidal method. The bioavailability was calculated as the dose-normalized AUC (p.o.) divided by the AUC (i.v.).
Data analyses
Values are expressed as mean ± SEM. All experiments were conducted at least in triplicate, except for the pharmacokinetic analysis with i.v. administration, quantification of LC3-immunopositive puncta, and fluorescence intensity in Acridine Orange staining. Statistical analyses were performed with an unpaired Student's t-test or Dunnett's multiple comparison test. Values of P < 0.05 were considered statistically significant.
Results
APB induced the reduction of ERG amplitudes and enhancement of fluorescein permeability into the vitreous body of rats
To clarify the effect of APB on retinal function, 40 mg/kg APB was orally administered in rats. Seven days after the administration, both ERG a- and b-wave amplitudes were significantly reduced. Fluorescein permeability into the vitreous body was significantly enhanced at 8 days after the administration (Fig. 2). According to the previous reports,18,19 the primary target of APB was thought to be RPE. Hence, the underlying mechanism was investigated.
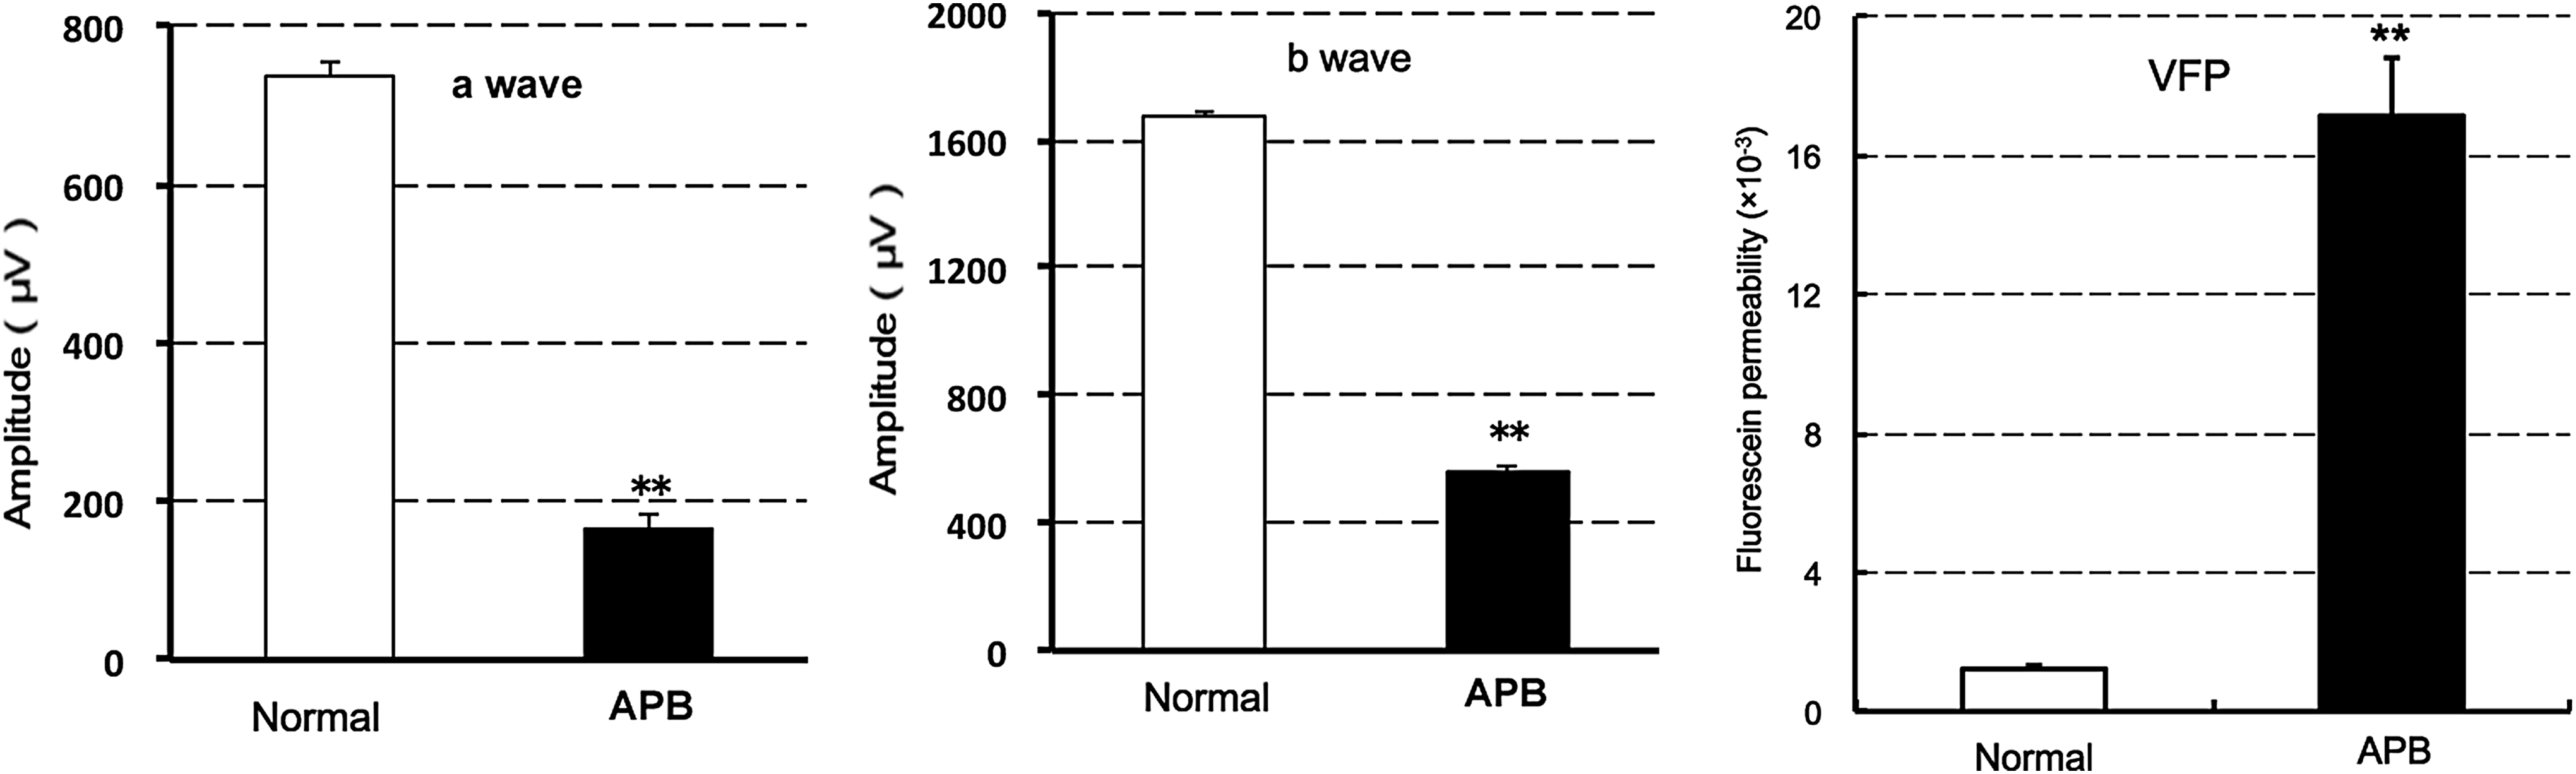
Effects of systemic APB on ERG a- and b-wave amplitudes and fluorescein permeability into the vitreous body in rats. After oral administration of 40 mg/kg APB, ERG a- and b-waves were evaluated at 7 days (left and middle graphs), and fluorescein permeability was evaluated by vitreous fluorophotometry (VFP) at 8 days after administration (right graph). The data represent mean ± SE (n = 8 eyes in 4 animals). **P < 0.01 versus normal rats, as assessed by Student's t-test. ERG, electroretinogram.
APB-induced cell death involved organelle pH alterations, and imbalances of cathepsin and procathepsin expression in ARPE-19 cells
ARPE-19 cells were exposed to 0–100 μM APB for 3, 6, and 24 h. Concentration- and time-dependent cell death was observed in the 24 h-treated samples (Fig. 3A). Although the cell viability was almost 10% at 100 μM, we adopted this concentration for further in vitro experiments, because of the necessity for reproducible constant cell death at the narrow, optimized dose range of 50–100 μM. Additionally, although the 48 h data were not shown, we performed similar experiments for cell viability measurements.

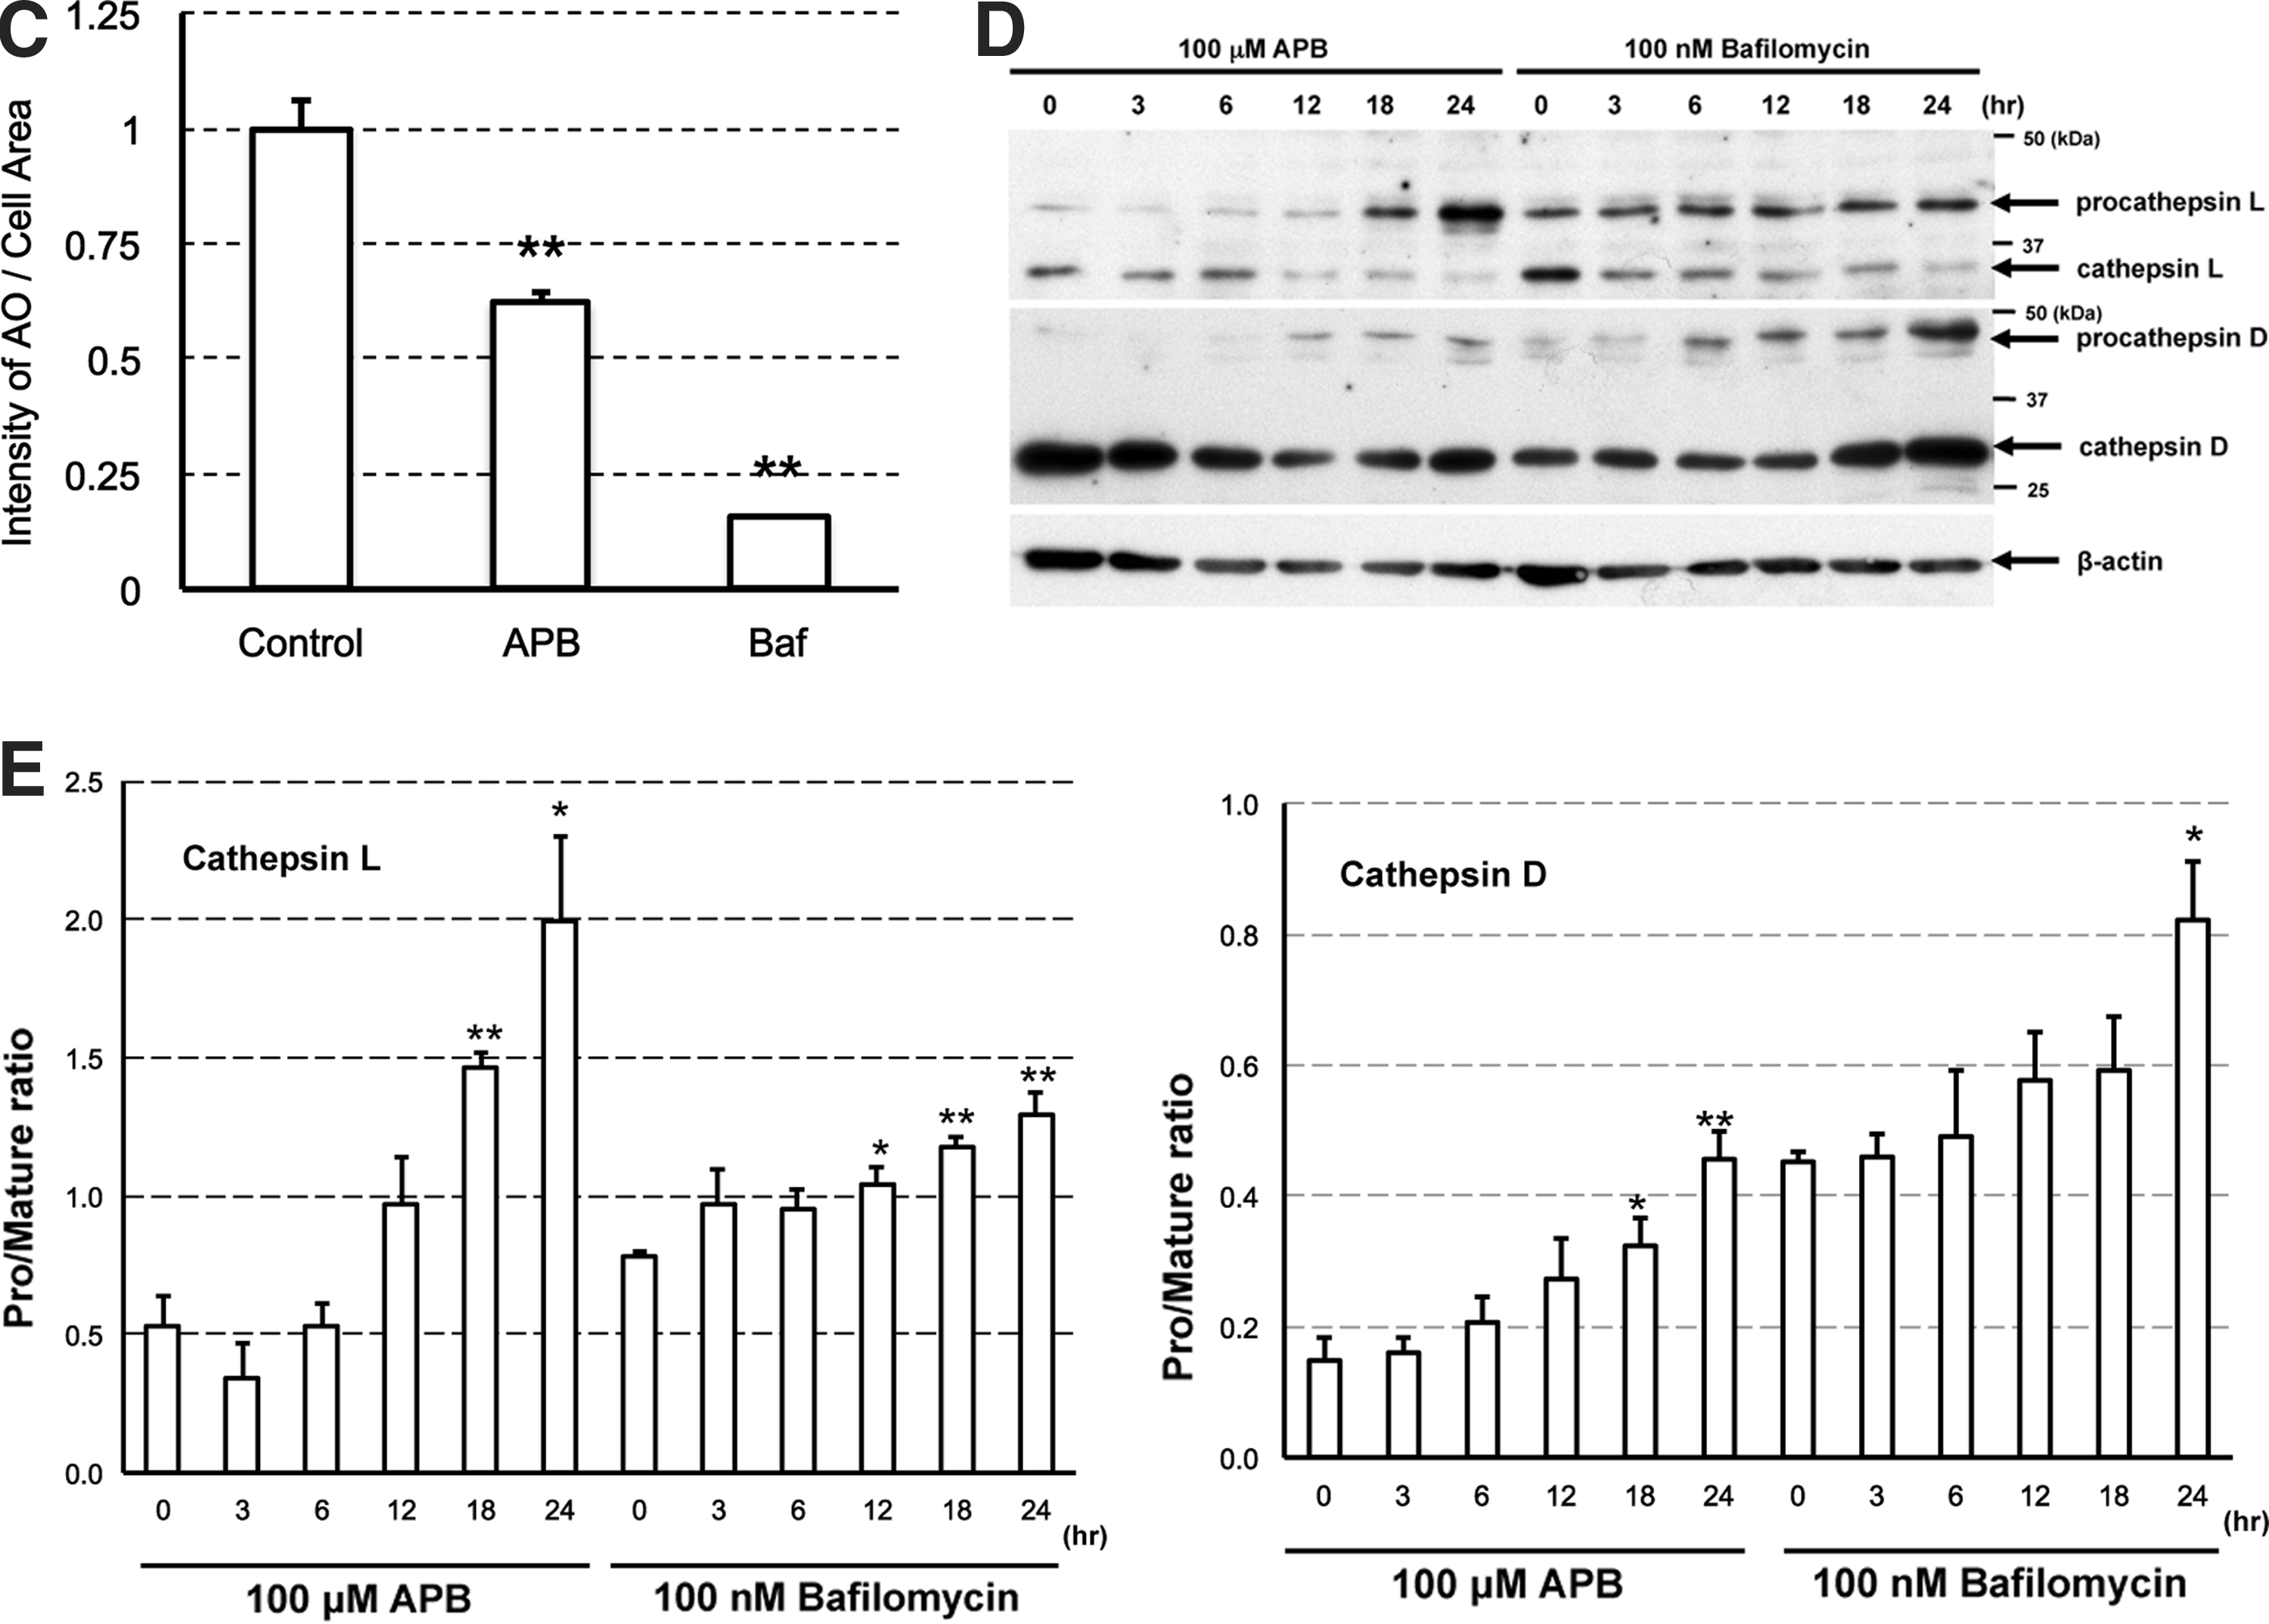
We checked the effect of APB on organelle pH and expression level of procathepsin or cathepsin. Cells treated with 100 μM APB revealed weak staining with Acridine Orange, in contrast to untreated cells (Control) showing intense granular staining (Fig. 3B). In addition, bafilomycin, a V-ATPase inhibitor, caused diminished staining. The staining intensity was significantly lower in APB- or bafilomycin-treated samples compared with control samples (Fig. 3C). Samples treated with 100 μM APB and 100 nM bafilomycin, for 0–24 h, were analyzed by western blotting using anti-procathepsin D, L, and anti-cathepsin D, L antibodies. In cathepsin L and D, APB and bafilomycin induced time-dependent accumulation of procathepsin, the inactive precursor enzyme (Fig. 3D). In cathepsin L, the procathepsin/cathepsin expression ratio was significantly higher in the 18 and 24 h APB-treated samples, and 12, 18, and 24 h bafilomycin-treated samples (Fig. 3E). APB and bafilomycin also caused accumulation of procathepsin D in a time-dependent manner. The procathepsin/cathepsin expression ratio was significantly higher in the 18 and 24 h APB-treated samples and 24 h bafilomycin-treated samples (Fig. 3E).
APB-induced autophagic marker accumulation in ARPE-19 cells
To explore the effect of APB on autophagic machinery, LC3 expression was analyzed. In western blot analyses, LC3-II was increased at 3 h after starvation with EBSS treatment in ARPE-19 cells. In the APB- and bafilomycin-treated samples, LC3-II increased after 3 h of treatment in a time-dependent manner (Fig. 4A). The expression level of LC3-II was significantly increased in the 3–24 h APB-treated samples, 18 and 24 h bafilomycin-treated samples, and 3 h EBSS-treated samples (Fig. 4B). LC3 immunostaining (Fig. 4C) revealed sparse granules of staining in the cytoplasm of the 12 h-treated control cells (Control). In contrast, dense granular staining was observed in 12 h-starved (EBSS), APB- or bafilomycin-treated cells (APB, Baf). The numbers of LC3-immunopositive puncta were significantly larger in starved (EBSS), APB-treated, and bafilomycin-treated cells compared with those in control cells (Fig. 4D).

APB-induced ATF4 translational activation
The eIF2α-ATF4 signaling pathway could be induced by autophagic impairment or by endoplasmic reticulum (ER) stress. To clarify this, we explored the effects of APB-induced autophagic alterations on amino acid starvation and ER stress. As an ER stress indicator, ER stress chaperone, immunoglobulin heavy-chain binding protein (BiP), and ER stress sensor inositol-requiring enzyme 1α (IRE1α), were used for reporter gene assays. As an amino acid starvation indicator, ATF4 was used. As shown in Figure 5, the ATF4 translational activity was significantly induced by ∼ 5-fold, compared with control cells, after 6 h of treatment; this increased with time for 24 h. Subsequently, BiP promoter activity and IRE1α activation were slightly induced from 9 h of treatment.
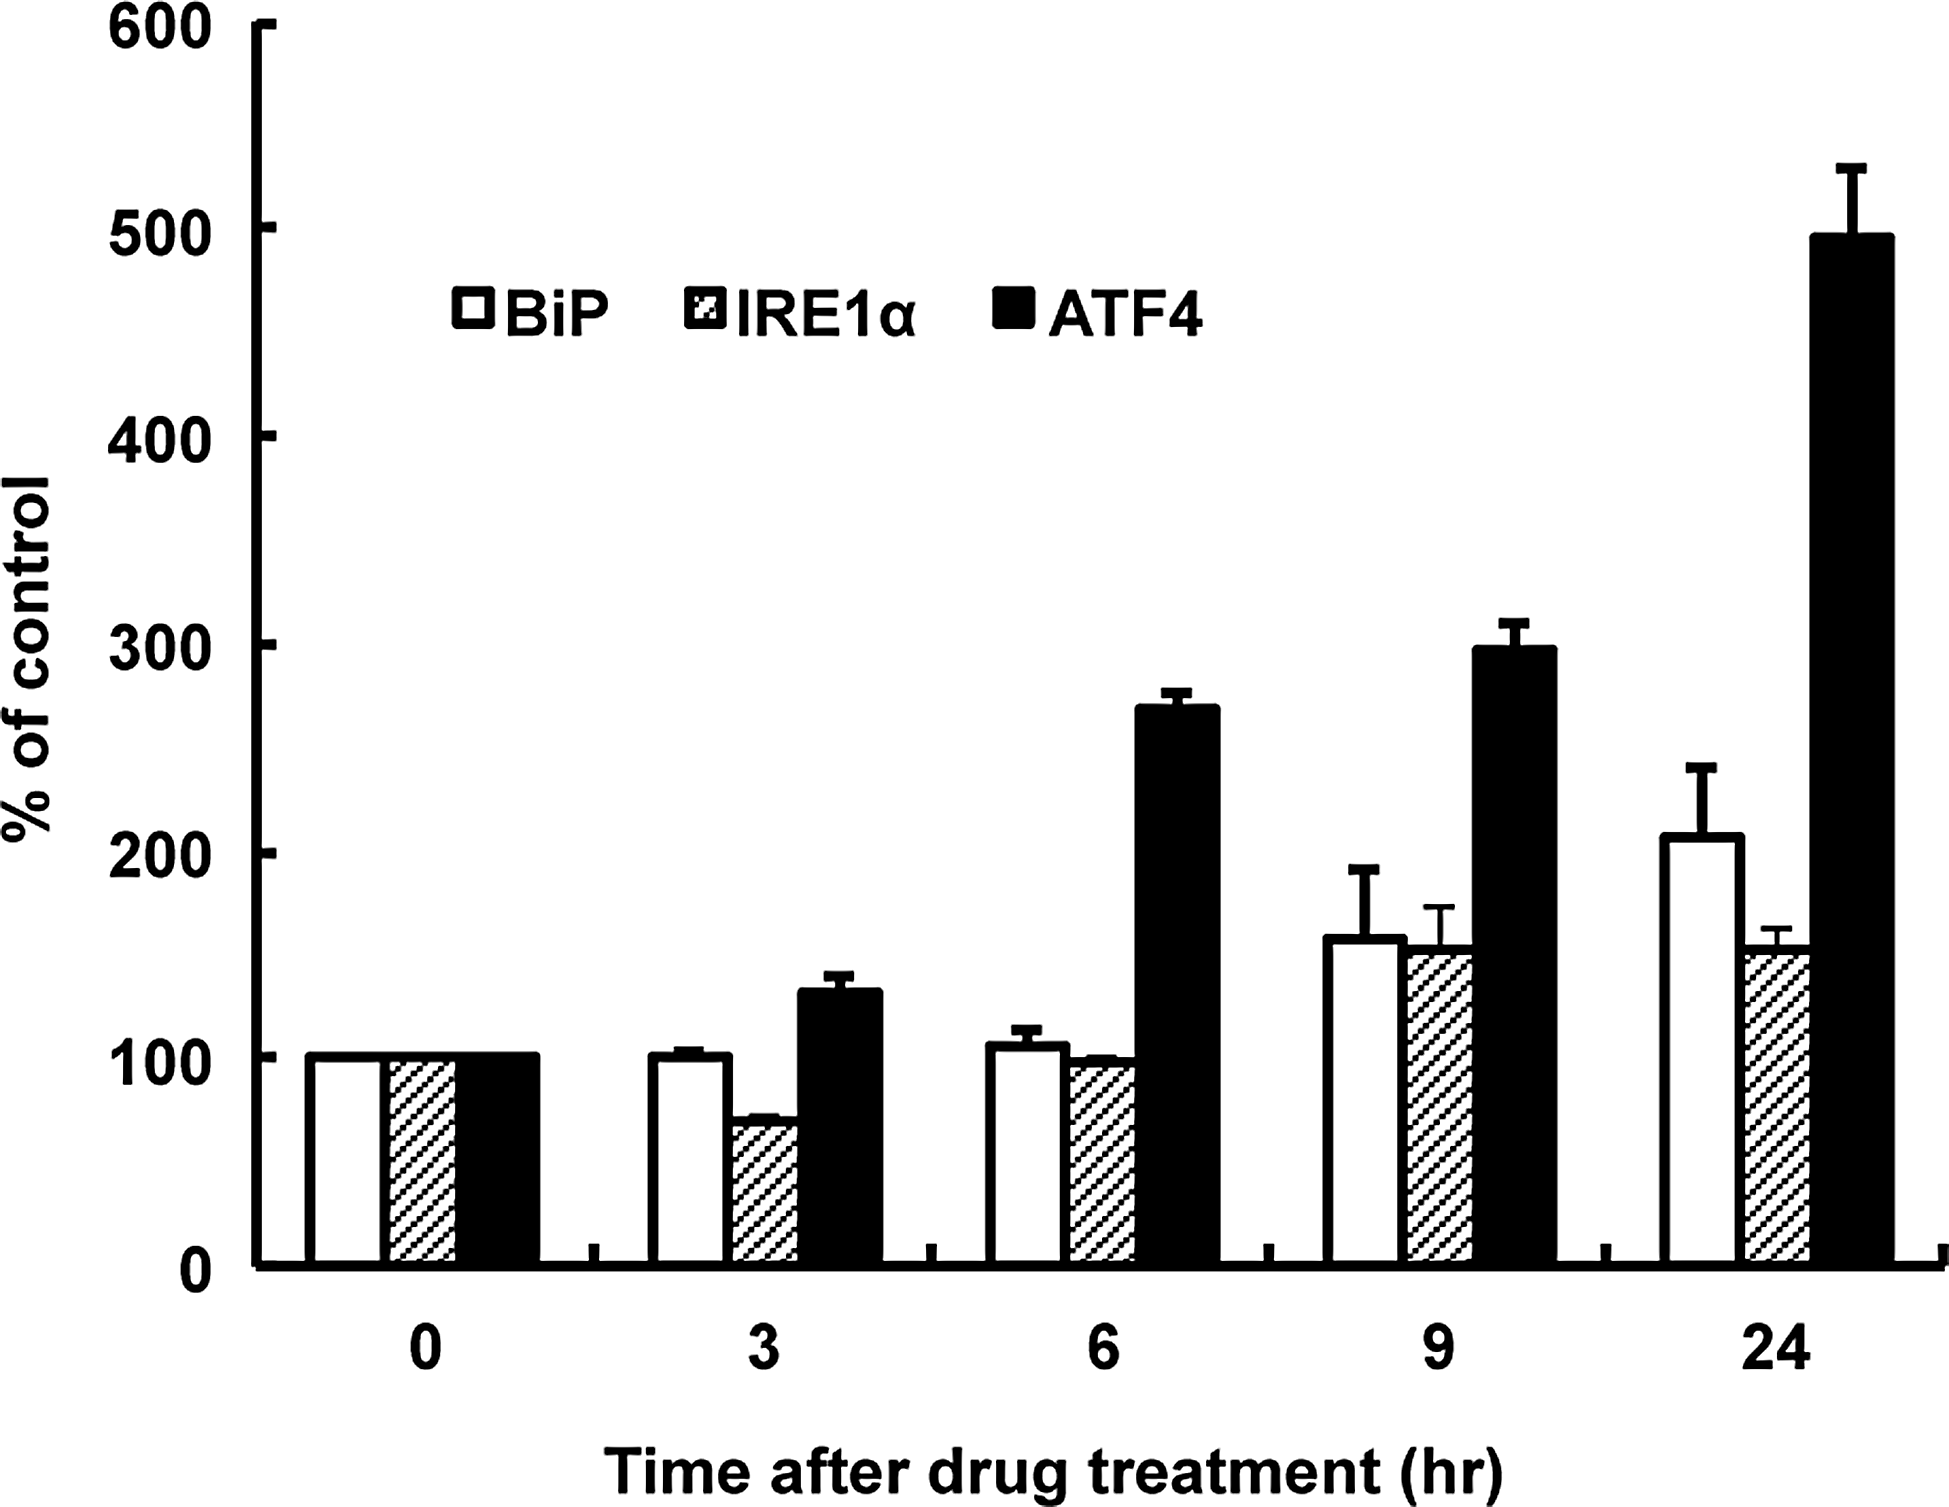
Time courses of human BiP, IRE1α, and ATF4 reporter activities after APB treatment evaluated by luciferase assays. Note that ATF4 translational activity increases in a time-dependent manner. ARPE-19 cells were transiently transfected with pGL3-hBiP pro.-132 (BiP), pTKX-ERAI-Luc (IRE1α), pCAX-hATF4(1-285)-hRL-HA (ATF4), and pRL-SV40. After transfections, the cells were treated with 100 μM APB for 0, 3, 6, 9, and 24 h. The data represent the percent changes relative to the value at time 0 (mean ± SE, n = 3). ATF4, activating transcription factor 4; BiP, binding protein; IRE1α, inositol-requiring enzyme 1α.
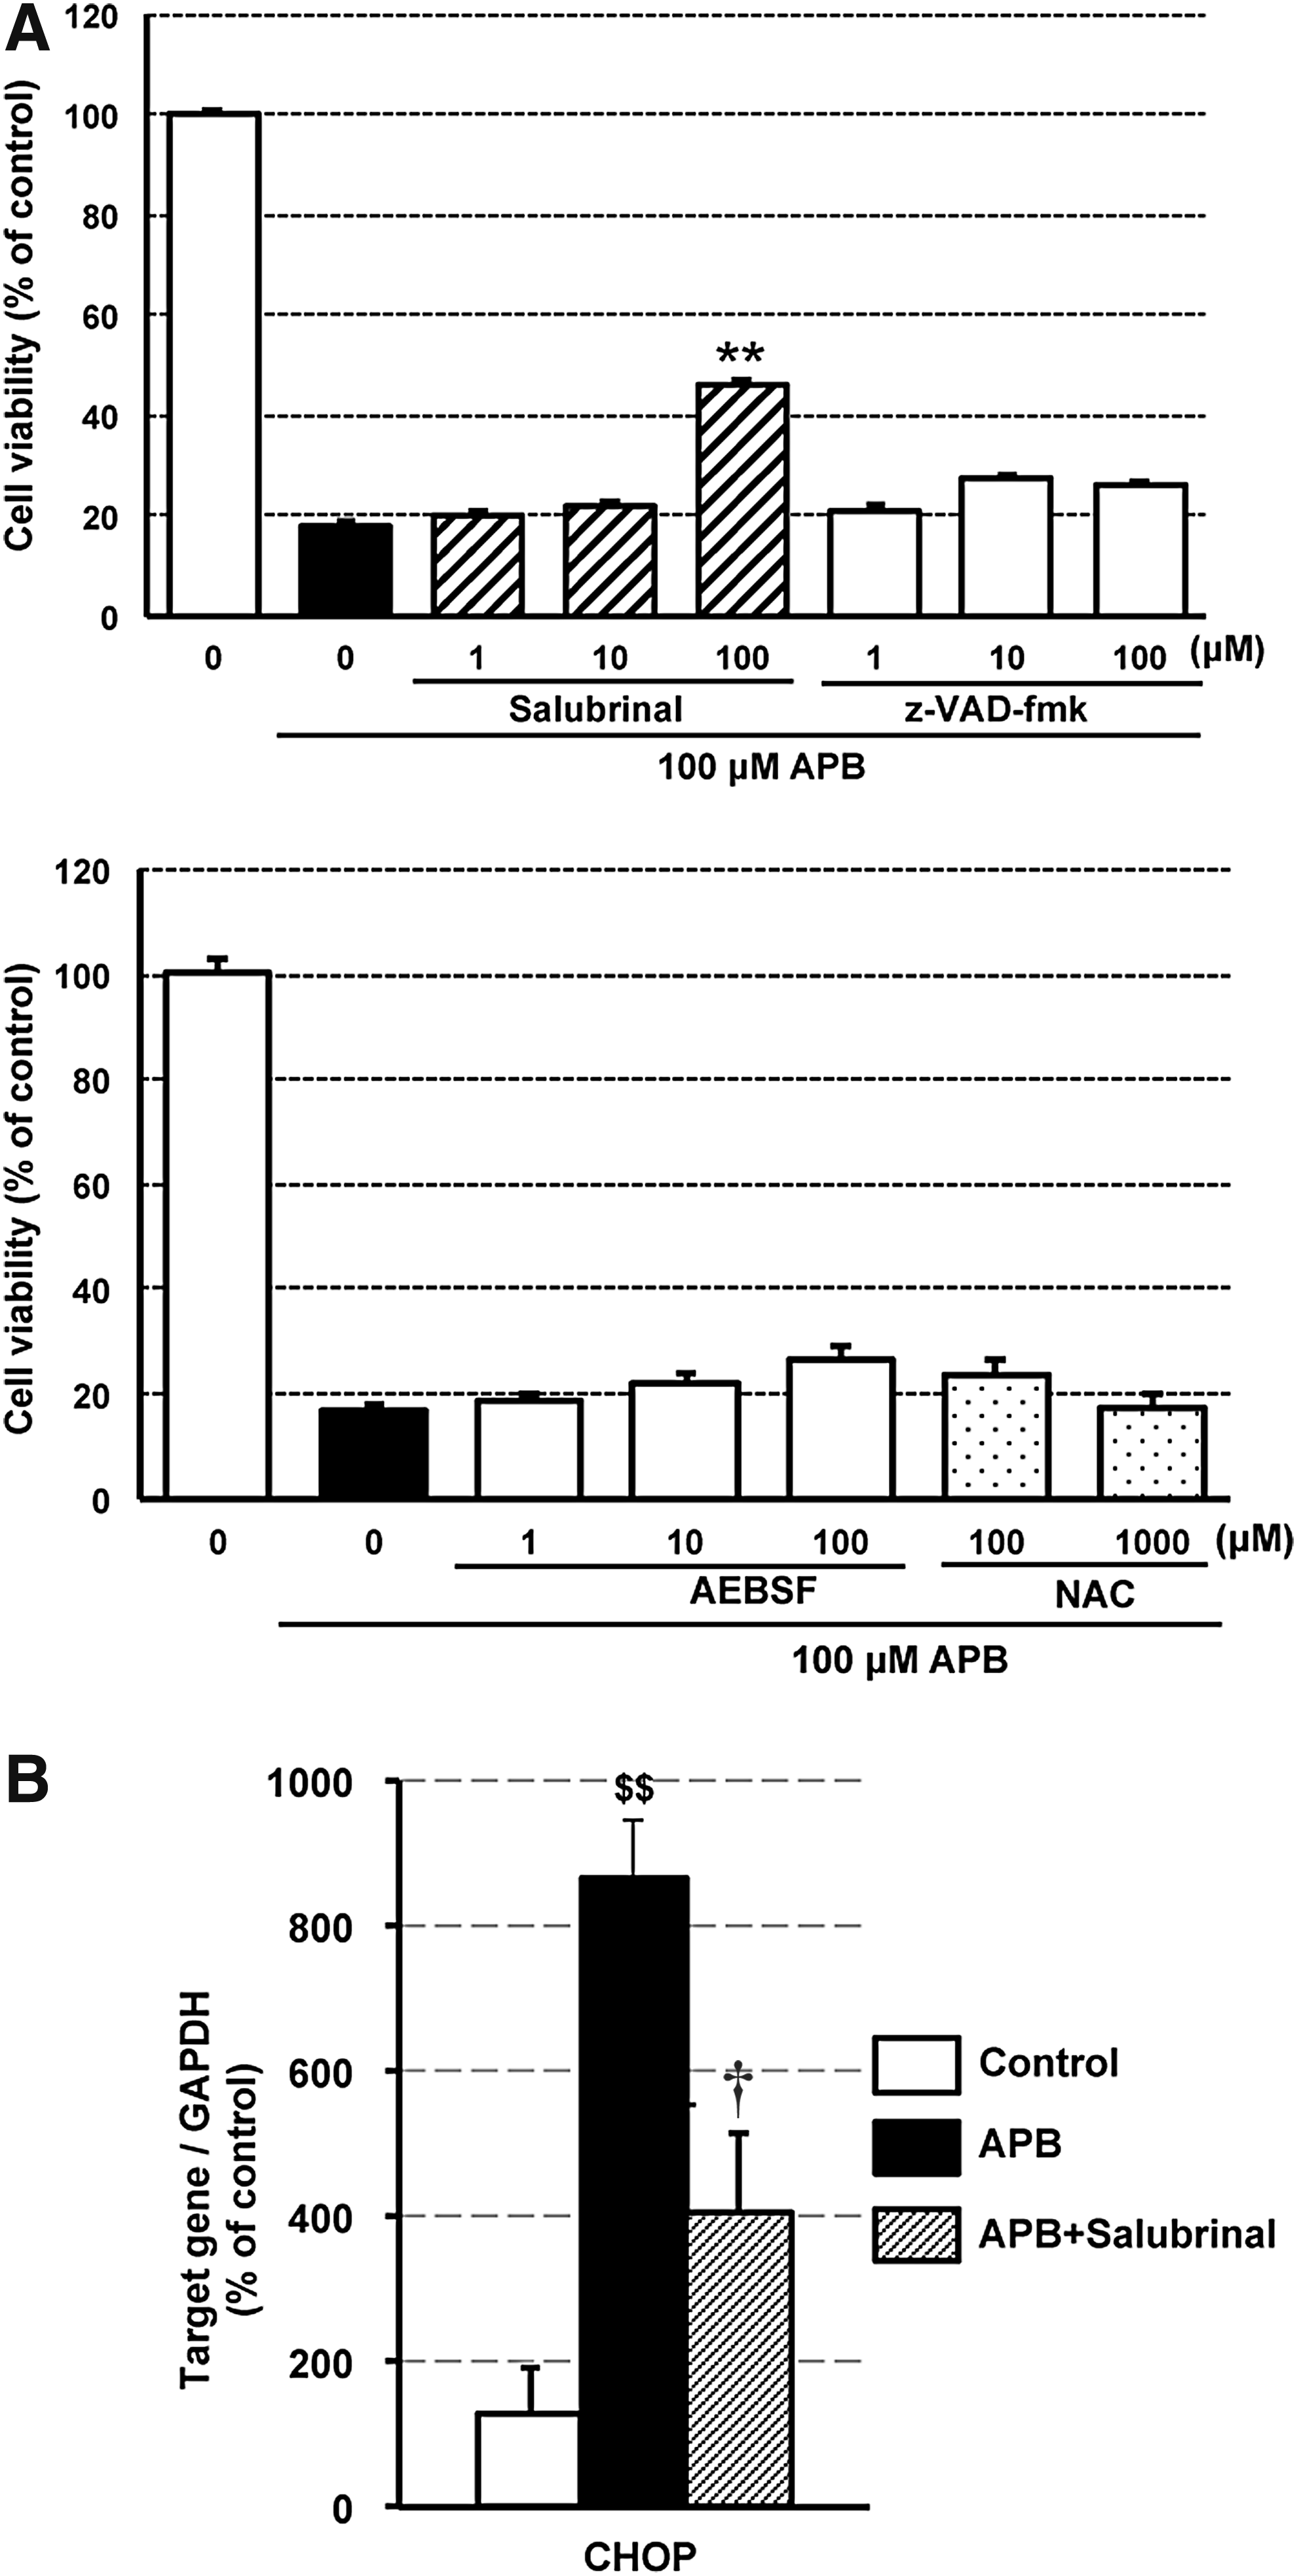
Inhibition of eIF2α dephosphorylation protected against APB-induced cell death
To assess APB-induced cell death signaling pathway, we examined the effect of pharmacological inhibitors. AEBSF (serine protease inhibitor), NAC (antioxidant), and z-VAD-fmk (pan-caspase inhibitor) were not significantly effective against APB-induced cell death. However, Salubrinal (eIF2α dephosphorylation inhibitor), at 100 μM, partially, but significantly, protected against cell death (Fig. 6A). These findings indicated that eIF2α and ATF4 signaling pathways may be involved in the APB-induced cell death mechanism. Salubrinal significantly inhibited CHOP mRNA induction by APB treatment (Fig. 6B).
Inhibition of eIF2α dephosphorylation protected against APB-induced retinopathy in rats
We examined the pharmacological effect of Salubrinal in vivo. After p.o. administration of 40 mg/kg APB, 2 mg/kg Salubrinal was repeatedly administered intraperitoneally, once daily, for 8 days. At day 7 after APB treatment, both ERG a- and b-wave amplitudes were significantly reduced (Fig. 7A). At day 8 after APB administration, fluorescein penetration into the vitreous body was significantly elevated (Fig. 7B). Under light microscopy, the APB-treated retina exhibited tortuous damage, including damage in the photoreceptors and RPE layer (Fig. 7C, left). In contrast, Salubrinal significantly recovered the ERG a- and b-wave amplitudes (Fig. 7A) and inhibited fluorescein penetration into the vitreous body (Fig. 7B). The pathological findings revealed alleviation of the outer and inner segment damage of photoreceptors and RPE (Fig. 7C, right).
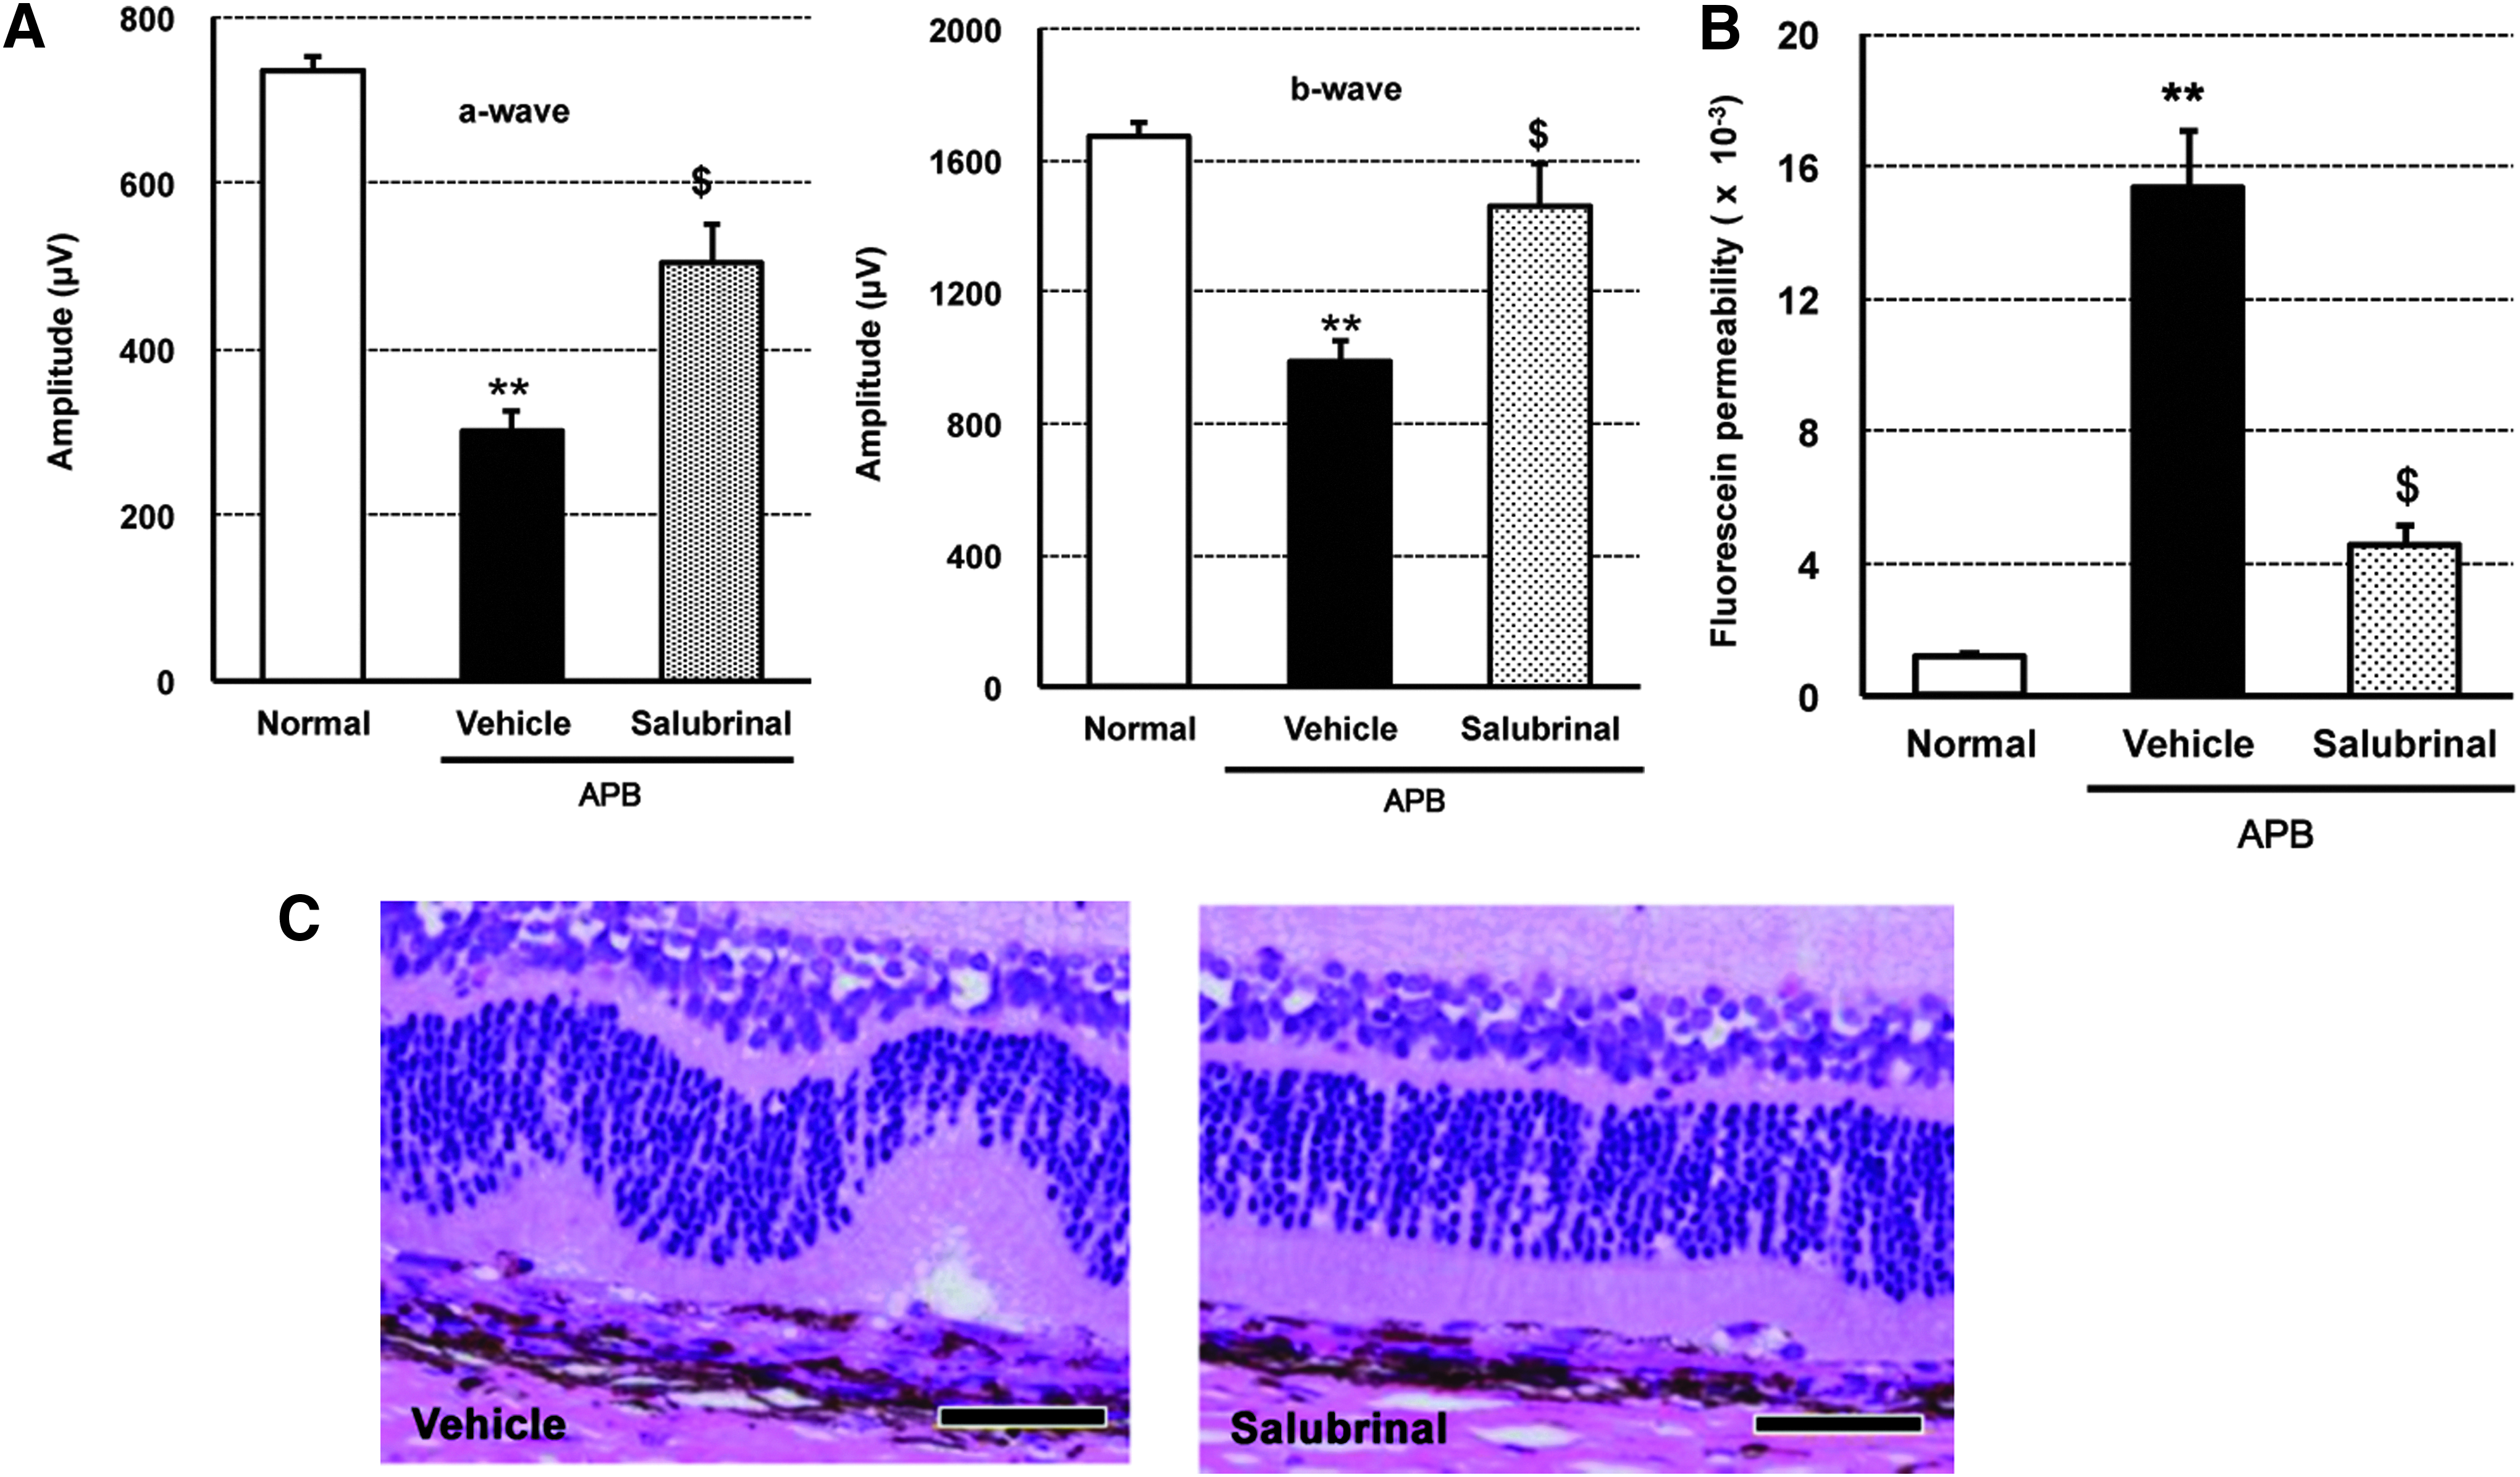
Pharmacological effects of systemic Salubrinal on APB-induced retinopathy. After oral administration of 40 mg/kg APB to rats, 2 mg/kg Salubrinal was repeatedly administered intraperitoneally, once daily, for 8 days.
APB (40 mg/kg) did not affect hematology and blood chemistry parameters in rats
In the hematology analysis, no significant changes were observed in the normal, vehicle, and 20 and 40 mg/kg APB groups. In the 80 mg/kg APB group, the reticulocyte count (Retic) was significantly lower than that in the vehicle-treated group (Table 1). The neutrophil (Neut) and monocyte (Mono) counts were significantly higher than those in the vehicle-treated group (Table 1). In the blood chemistry analysis, significantly lower aspartate aminotransferase and total cholesterol levels, and higher sodium (Na) levels were found in the vehicle group compared with the normal group. In the 80 mg/kg APB group, the albumin/globulin ratio (A/G) was significantly lower than that in the vehicle group (Table 2). No significant changes were observed in the vehicle, and 20 and 40 mg/kg APB groups. These findings suggested that treatment with APB at doses of up to 40 mg/kg did not affect hematology and blood chemistry parameters in rats. In addition, the body weights of all of the experimental groups were not significantly changed by APB administration (Fig. 8).

Rates of body weight change following a single p.o. administration of vehicle or APB (20, 40, and 80 mg/kg) to Brown Norway rats. Normal: untreated rats. The data represent mean ± SE of 4 rats. p.o., peroral.
The data represent mean ± SE of 4 rats.
P < 0.01 versus vehicle as assessed by the Dunnett's multiple comparison test.
P < 0.05 versus vehicle as assessed by the Dunnett's multiple comparison test.
RBC, red blood cell count; Hgb, hemoglobin concentration; Hct, hematocrit value; MCV, mean corpuscular volume; MCH, mean corpuscular hemoglobin; MCHC, mean corpuscular hemoglobin concentration; Retic ratio, reticulocyte ratio; Retic, reticulocyte; PLT, platelet count; PT, prothrombin time; APTT, activated partial thromboplastin time; WBC, white blood cells; Neut, neutrophils; Lymp, lymphocytes; Mono, monocytes; Eos, eosinophils; Baso, basophils; LUC, large unstained cells.
The data represent mean ± SE of 4 rats.
P < 0.05 versus normal as assessed by the Student's t-test.
P < 0.01 versus normal as assessed by the Student's t-test.
P < 0.01 versus vehicle, by Dunnett's multiple comparison test.
APB, 2-phenyl-APB-144; AST, aspartate aminotransferase; ALT, alanine aminotransferase; γ-GTP, γ-glutamyl transpeptidase; ALP, alkaline phosphatase; ChE, cholinesterase; T-BIL, total bilirubin; T-CHO, total cholesterol; TRIG, triglycerides; PL, phospholipids; TP, total protein; ALB, albumin; A/G, albumin/globulin ratio; GLU, glucose; BUN, blood urea nitrogen; CREAT, creatinine; UA, urea; INORG.P, inorganic phosphorus; Ca, calcium; Na, sodium; K, potassium; Cl, chloride.
Unmetabolized APB was an active substance, inducing retinopathy after oral administration in rats
The mean plasma APB concentration/time profiles in male Brown Norway rats, after administration of i.v. (1 mg/kg) and p.o. (40 mg/kg) doses of APB are shown in Figure 9, and the resulting pharmacokinetic parameters are summarized in Table 3. After p.o. administration, the plasma APB concentration was rapidly elevated, sustained for 2–6 h, and then slowly declined. The individual PK parameters for the 40 mg/kg dose (p.o.) were Tmax of 4 h, Cmax of 2.68 μg/mL, T1/2 of 7.7 h, and AUC0–00 of 43.192 μg/h/mL. After i.v. administration, the plasma APB concentration declined rapidly with T1/2 of 1.6 h and AUC0–00 of 1.233 μg/h/mL. Based on these parameters, the bioavailability of 40 mg/kg p.o. APB was 88.3%.
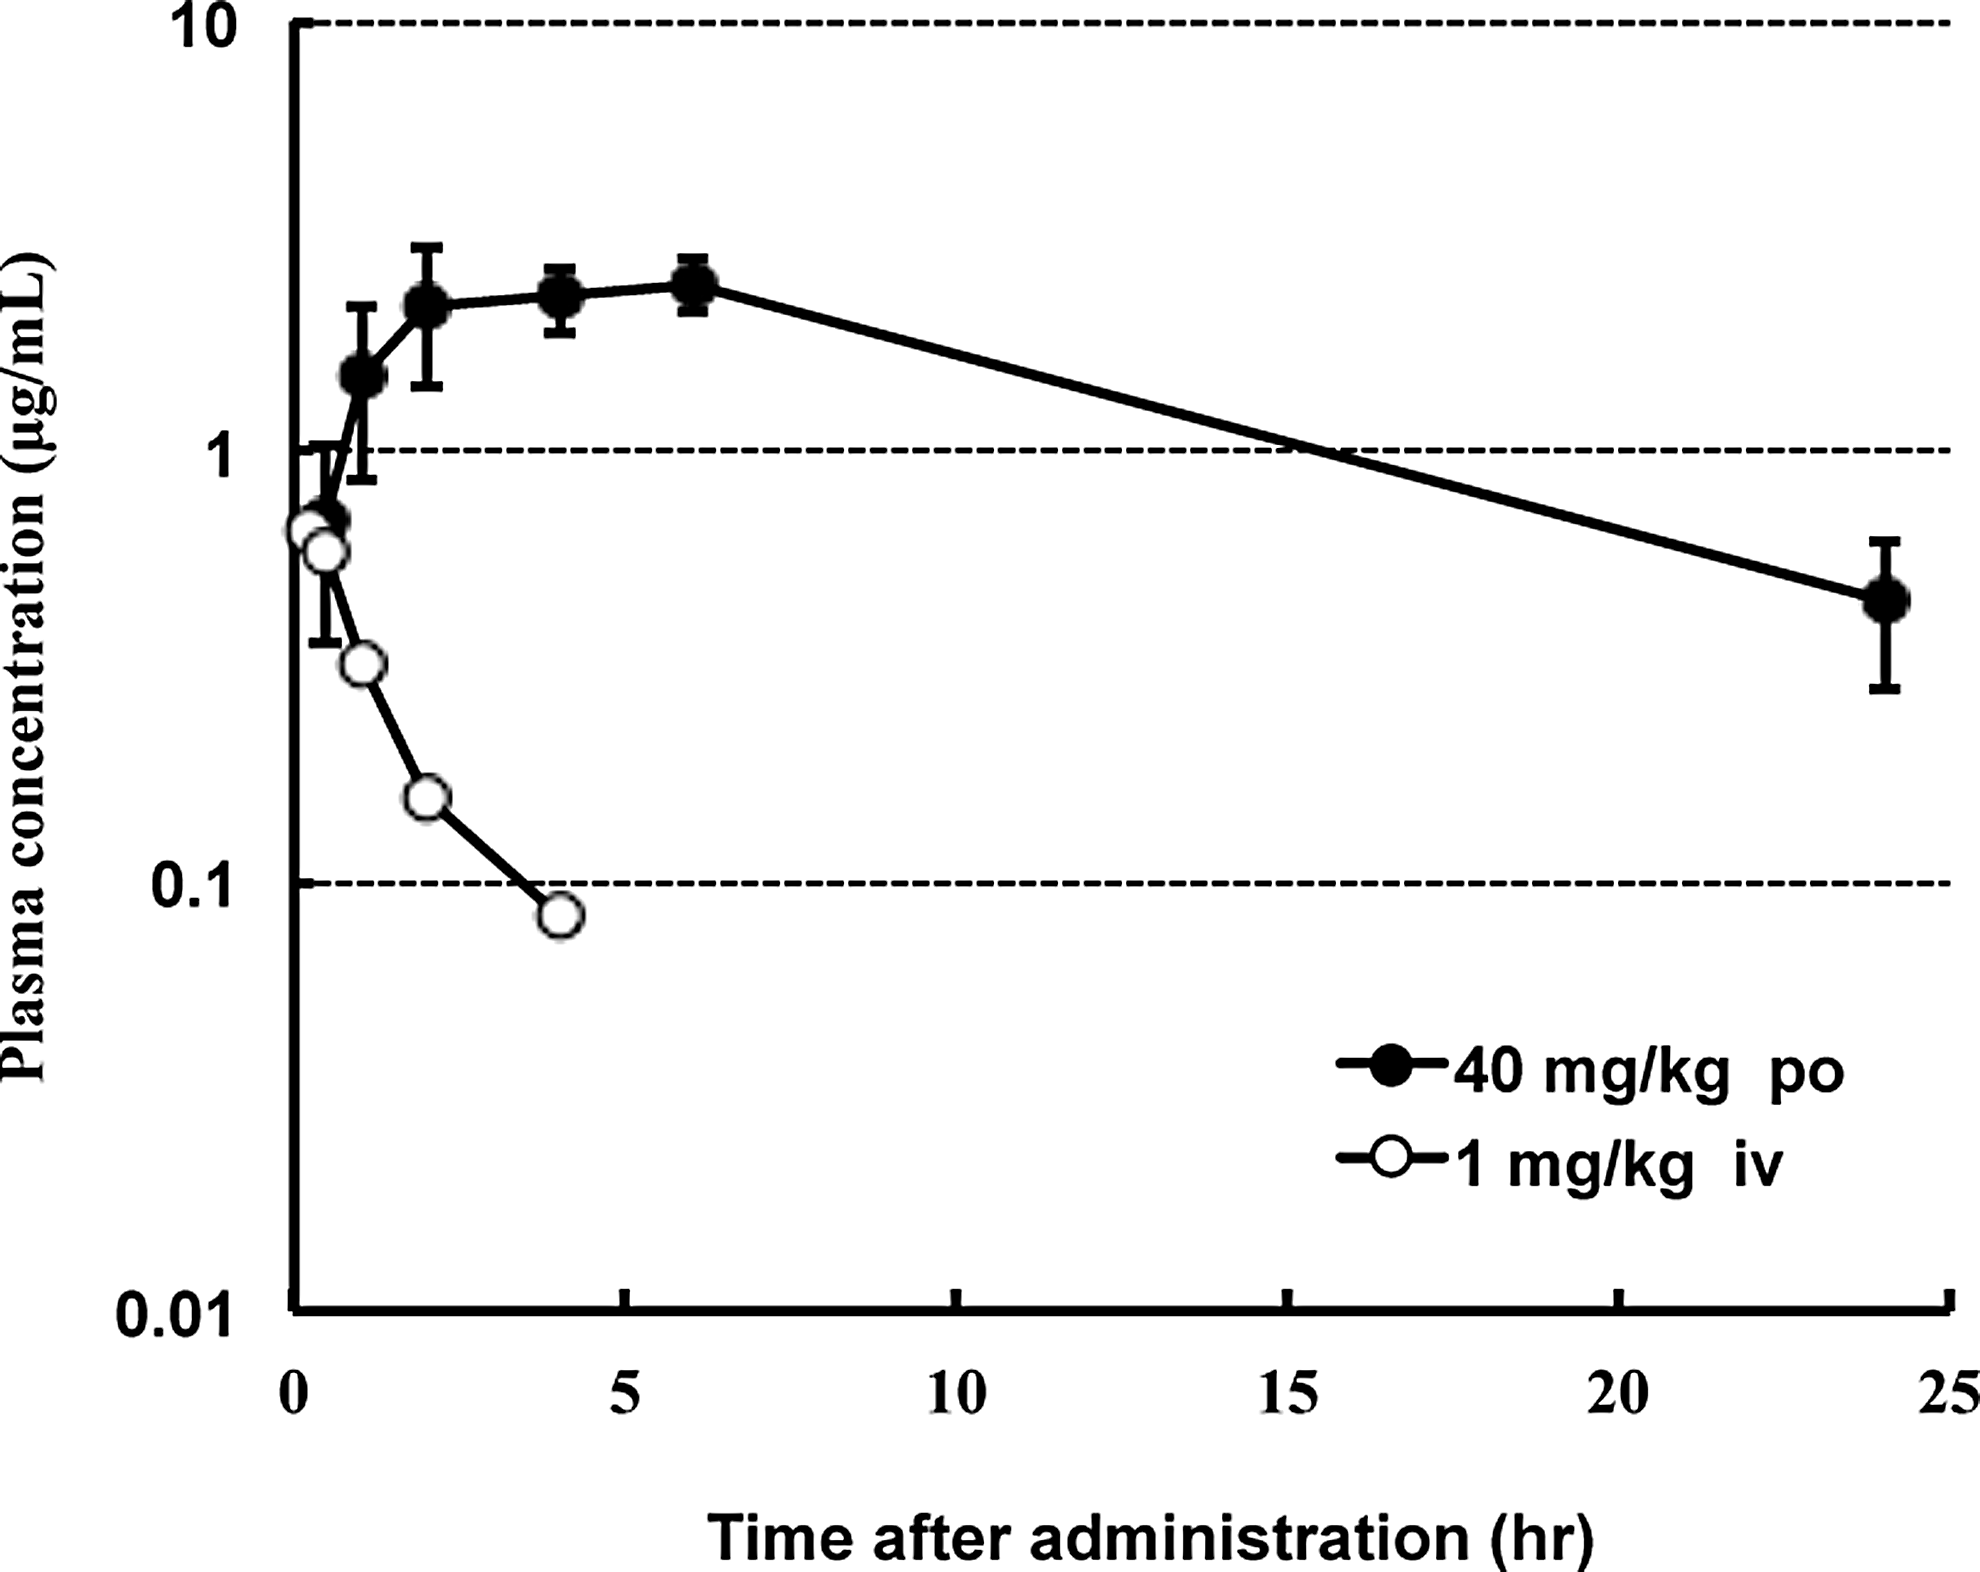
Mean plasma APB concentrations following a single p.o. administration of 40 mg/kg APB or single i.v. administration of 1 mg/kg APB to Brown Norway rats. The data represent mean ± SE (p.o.: n = 4 rats) or mean (i.v.: n = 2 rats). i.v., intravenous.
The data represent mean ± SE for p.o. administration (n = 4 rats) and mean for i.v. administration (n = 2 rats).
AUC, area under the time–concentration curve; i.v., intravenous; p.o., peroral.
Discussion
There are many reports showing RPE-driven retinal degeneration in animal models, such as the cathepsin D mutant, 6 Nrf2 KO, 7 and SOD1 KO mouse models. 8 Most of these animal models are genetically altered, and establishment or analysis of the pathology required a long time period, for example, more than 1 year. In contrast to genetically altered and long-term retinal RPE degeneration animal models,6–8 chemically induced RPE-oriented retinal degeneration was not intensively investigated. Sodium iodate-induced retinopathy has represented oxidative stress-induced RPE degeneration, with subsequent photoreceptor damage. 25 Chloroquine-induced animal retinopathy is another photoreceptor damage model. However, it technically required sustained or repeated administration of the compound for at least 6 weeks. 26 Intravitreal leupeptin, 27 a cysteine protease inhibitor, and lysosomotropic aminoglycoside antibiotics 28 had some limitations, namely nonspecific cytotoxicity, invasive administration route, and early reversibility of retinal damage.
The diaminodiphenoxy alkane classes of compounds, including APB, were extensively examined in the 1950s for treatment of schistosomiasis. However, untoward side effects, including retinopathy, were reported for an aromatic diamine like APB.16,17 We have shown, for the first time, that APB induced ERG amplitude reduction and permeability enhancement in RPE in vivo. In vitro, APB promoted organelle pH alterations, autophagic flux impairment, and cell death in ARPE-19 cells. This evidence agreed with the previous in vivo histopathology reports showing RPE damage with lysosomal residual bodies, by electron microscopy, in APB-administered rats.18,19 It is widely known that chloroquine induces intracellular pH alterations 29 and cathepsin D inhibition 10 in the RPE, leading to retinopathy.26,30 It was suggested that weak base amines, like chloroquine, may preferentially accumulate in acidic compartments such as lysosomes. 31 In this study, we found organelle pH alterations in APB-treated ARPE-19 cells. RPE cells have numerous lysosomes in their cytoplasm. Although there is indirect evidence for the effect of APB on lysosomes, this result implicated lysosomal pH alterations. Considering the weak base chemical characteristics of these compounds, these findings may indicate that APB has relatively similar effects to chloroquine.
Increased autophagosome formation has been observed in various tissue cells of mice deficient in LAMP-2, a critical lysosomal membrane protein for autophagy. 15 In the autophagic process, LC3-I was converted into LC3-II, which bound to the autophagosomal membrane, followed by autophagosome and lysosome fusion into an autolysosome. 11 Inhibition of autophagosomes and lysosomal fusion secondarily increased autophagic markers, such as LC3-II. 13 In this study, APB not only altered expression levels of cathepsin and procathepsin, but also promoted LC3-II accumulation. Similar phenomena were reported in chloroquine-treated ARPE-19 cells. 32 Previous in vivo histological reports revealed that the RPE in APB-administered rats exhibited numerous phagosomes.18,19 In addition, the RPE of cathepsin D mutant mice contained significant deposits of autophagosome-like debris. 6 These results suggested that APB induced lysosomal dysfunction, resulting in autophagy impairment.
APB induced both organelle pH alterations and autophagic dysfunctions, and also cell death. We showed that APB induced translational activity of ATF4 (Fig. 5). Oxidative stress was reported to induce ATF4 in combination with the Nrf2 transcription factor, in ARPE-19 cells. 33 In the present study, treatment with the antioxidant NAC did not inhibit APB-induced cell death (Fig. 6A), suggesting that it was unlikely that oxidative stress was involved in the mechanism. Autophagy is activated during stress conditions, such as during amino acid starvation, unfolded protein responses, or viral infections. 14 We observed LC3-II accumulation under starvation conditions and with APB or bafilomycin treatment (Fig. 4). ATF4 was inducible by GCN2 kinase, not only in the unfolded protein response, but also during amino acid starvation. 14 It is possible that APB-induced translational activation of ATF4 was by amino acid starvation through GCN2 kinase. In addition, sustained amino acid starvation may induce mild ER stress, reflected by the slight inductions of BiP and IRE1α activation, followed by ATF4 translational induction. However, this hypothesis requires further examination, because we did not find the involvement of GCN2 kinase activation in APB-induced ATF4 translational induction. Another possible mechanism for APB induction is caspase or serine protease-mediated apoptosis. However, we did not observe attenuation of cell death by z-VAD-fmk and AEBSF (Fig. 6A). Therefore, it is unlikely that caspase or serine protease-mediated apoptosis was a major mechanism underlying APB-induced cell death.
Salubrinal, 20 an eIF2α dephosphorylation inhibitor, significantly attenuated not only APB-induced ARPE-19 cell death, but also APB-induced retinopathy in rats (Figs. 6A and 7). The eIF2α phosphorylation led to global translational arrest and ATF4 induction through a subset of genes, including CHOP, BiP, and GADD34. 34 However, our study revealed that APB alone also induced ATF4 translational activity in the gene subset, including the proapoptotic CHOP (Figs. 5 and 6B). In addition, Salubrinal significantly suppressed CHOP mRNA expression in APB-treated ARPE-19 cells (Fig. 6B). These findings suggested that Salubrinal attenuates APB-induced cell death by global translational arrest, including CHOP suppression, independently of phosphorylated eIF2α-mediated ATF4 induction. In addition, it is implicated that Salubrinal may have a new mode of action other than eIF2α dephosphorylation inhibition. Further studies may provide more precise molecular mechanisms underlying APB-induced cell death and its attenuation by Salubrinal.
There are no previous reports on the toxicological and pharmacokinetic profiles of APB, or the mechanisms underlying the targeted specificity of APB for the RPE. We showed that APB, at a dose of 40 mg/kg or lower, was not systemically toxic, at least from the hematological and blood chemistry profiles. Hence, we adopted 40 mg/kg as a retinopathy-inducing dosage in this study. In addition, this result suggested that, in rats, APB did not affect organs other than retina, in an indirect manner. The pharmacokinetic analysis demonstrated that retinopathy was induced by unchanged active APB, because of its high bioavailability (Table 3). These results supported the reliability of our in vitro study evidence with an in vivo study. Lee and Valentine 18 reported that APB-induced retinopathy was observed in both albino and pigmented rats. Therefore, the melanin pigment in RPE cells was not an important factor in the development of APB-induced retinopathy. Because acidic organelles such as lysosomes take up weak basic compounds, 10 it is suggested that an unmetabolized weak base like APB could become concentrated in lysosomes of the RPE, which plays an important role in the BRB system of the eye. 9
It was reported that accumulation of intracellular lysosomal lipofuscin and extracellular drusen deposits may have elicited RPE cell death, 2 and that autophagic marker accumulation and decreased lysosomal activity were observed in human AMD donor samples. 1 Wang et al. 1 speculated that increased autophagy and the release of intracellular proteins through exosomes, by the aged RPE, may have contributed to the formation of drusen. However, A2E, a component of lipofuscin, inhibited lysosomal ATP-driven proton pumps, resulting in an increase in the lysosomal pH. 3 Moreover, lipid peroxidation products reduced autophagy flux and increased lipofuscin accumulation in the RPE. 35 Mitter et al. 36 hypothesized that fusion with lysosomes and degradation of engulfed material may be greatly impaired, leading to accumulation of autophagosomes in the RPE cells of AMD patients. In this study, we found that APB induced organelle pH alterations and subsequent autophagy flux impairments in ARPE-19 cells. Although the pathological autophagy machinery effects in the RPE are controversial, our evidence could contribute to the knowledge of the mechanisms of RPE degeneration in AMD pathology. In this study, we confirmed the reproducibility of APB-induced retinopathy, which was RPE oriented, was noninvasive, required a single p.o. administration, and occurred in only 1 week. Hence, we consider that for short experimental periods, this animal model is suitable for both in vitro and in vivo analyses of RPE degeneration.
In conclusion, the present study has shown that APB induced organelle pH alterations, impaired autophagy flux, and ATF4 induction in ARPE-19 cells. In addition, APB-induced cell death and retinopathy were restored by pharmacological inhibition of eIF2α dephosphorylation. Although the precise mechanisms underlying ATF4 induction and the pharmacological effects of Salubrinal remain unclear, the present study may provide insights and methods for the development of research on retinal degeneration.
Footnotes
Acknowledgments
This work was supported by the Japan Society for the Promotion of Science (JSPS) KAKENHI (24228002 to K.K.) and the Ministry of Education, Culture, Sports, Science, and Technology (MEXT) KAKENHI (19058010 to K.K.). The authors thank Drs. Daisuke Oikawa, Kazutoshi Mori, Hiroshi Enomoto, Kazuyuki Nishioka, Hiroyuki Aono, Kazuhiro Hosoi, Nobuaki Miyawaki, Minoru Sasano, and Masatsugu Nakamura for helpful technical and scientific support.
Author Disclosure Statement
No competing financial interests exist.
Appendix
| Parameter | Method |
|---|---|
| AST (U/L) | JSCC a transferable method |
| ALT (U/L) | JSCC transferable method |
| γ-GTP (U/L) | JSCC transferable method |
| ALP (U/L) | JSCC transferable method |
| ChE (U/L) | Butyrylthiocholine iodide method |
| T-BIL (mg/dL) | Diazo method |
| T-CHO (mg/dL) | COD b HMMPS c method |
| TRIG (mg/dL) | GPO d HMMPS method, glycerol blanking method |
| PL (mg/dL) | Choline oxidase DAOS e method |
| TP (g/dL) | Biuret method |
| ALB (g/dL) | BCG f method |
| A/G (n/a) | Calculation: [albumin/(total protein–albumin) × 100] |
| GLU (mg/dL) | Hexokinase G-6-PDH method |
| BUN (mg/dL) | Urease GlDH g method |
| CREAT (mg/dL) | Creatininase HMMPS method |
| UA (mg/dL) | Uricase · POD h method |
| INORG.P (mg/dL) | PNP i XDH j method |
| Ca (mg/dL) | MXB k method |
| Na (mEq/L) | Electrode method |
| K (mEq/L) | Electrode method |
| Cl (mEq/L) | Electrode method |
Japan Society of Clinical Chemistry.
Cholesterol oxidase.
N-(3-sulfopropyl)-3-methoxy-5-methylaniline.
Glycerol-3-phosphate oxidase.
N-ethyl-N-(2-hydroxy-3-sulfopropyl)-3,5,-domethoxyaniline.
Bromocresol green.
Glutamate dehydrogenase.
Peroxidase.
Purine nucleoside phosphorylase.
Xanthine dehydrogenase.
Methylxylenol blue.
AST, aspartate aminotransferase; ALT, alanine aminotransferase; γ-GTP, γ-glutamyl transpeptidase; ALP, alkaline phosphatase; ChE, cholinesterase; T-BIL, total bilirubin; T-CHO, total cholesterol; TRIG, triglycerides; PL, phospholipids; TP, total protein; ALB, albumin; A/G, albumin/globulin ratio; GLU, glucose; BUN, blood urea nitrogen; CREAT, Creatinine; UA, urea; INORG.P, inorganic phosphorus; Ca, calcium; Na, sodium; K, potassium; Cl, chloride.