
Abstract
Abstract
Purpose:
To characterize dose and response for intraocular pressure (IOP) reduction and incidence of hyperemia using a model-based meta-analysis of IOP-lowering monotherapy studies to evaluate new ocular antihypertensive therapies for glaucoma.
Methods:
Published randomized controlled trials, regulatory documents, and sponsor reports of IOP-lowering monotherapies were used to develop dose–response models to characterize efficacy (IOP change from baseline) and safety (incidence of hyperemia) profiles.
Results:
The meta-analysis for efficacy included 31 trials with 6,516 patients receiving bimatoprost, latanoprost, travoprost, timolol, or placebo. Estimated IOP reduction with placebo was −2.01 mmHg. Maximal IOP reduction was similar among the prostaglandin analogs (estimate, −6.27 mmHg; baseline, 25 mmHg). Estimated median effective IOP-lowering dose (ED50) was 0.002%, 0.00098%, and 0.00063% daily with bimatoprost, latanoprost, and travoprost, respectively. The hyperemia (safety) analysis included 25 trials with 6,244 patients. Typical maximal estimated difference between drug and placebo was 43%, and estimated ED50 of 0.011%, 0.014%, and 0.0015% daily for bimatoprost, latanoprost, and travoprost, respectively. Latanoprost treatment was predicted to incur the lowest rate of hyperemia of the prostaglandins, for equivalent IOP reduction.
Conclusions:
Model-based meta-analyses for IOP reduction and incidence of hyperemia among prostaglandin analogs are well described by maximal efficacy models and can provide a useful methodology for evaluating glaucoma therapies.
Introduction
O
New topical agents continue to be evaluated, with the objective of improving the efficacy and safety over existing therapies. The accepted approach for such evaluations is a randomized, controlled clinical trial, usually comparing a novel agent against the established standard of care. However, data generated from such trials are limited since only a relatively small number of treatment groups can be included and a full dose–response relationship may not be characterized. As a result, key parameters, such as the maximal efficacy (Emax) of the agent, and the dose required for half-maximal response, that is, the amount to produce a specific effect which is 50% of the Emax (ED50), cannot be calculated directly, but instead are estimated from trial data; similar constraints apply to questions of dose-related toxicity and to the comparison of the new agent to existing drugs.
The present study focused on developing a general mathematical model that would allow characterization of these key pharmacodynamic parameters not only for existing glaucoma medications but also allow comparisons to new products under development. A meta-analysis model would permit an evaluation of questions about dose and response, morning versus evening dosing, and comparison with treatments not included in a current clinical trial, as well as assist in studying higher doses. Initially, a pharmacodynamic model to determine the dose–response curves of prostaglandin analogs as a class of agents and the beta-blocker timolol was created. This analysis focused on IOP lowering as the efficacy measure, whereas a separate meta-analysis examined the incidence of hyperemia as the principal indicator of safety, with Emax and ED50 as the key model parameters for both. This model could then be used to characterize these same parameters for a novel compound that is in development. An updated model could be used both to characterize the overall dose–response curve and to compare the model parameters (Emax, ED50) for both efficacy and safety. By comparing the ED50 of the respective medications for efficacy and safety, an estimate for a therapeutic index of existing IOP-lowering agents can be determined and used for comparison with that of a new agent.
Methods
A literature search was conducted using MEDLINE and similar databases for reports from clinical trials on timolol and the prostaglandin analogs bimatoprost, latanoprost, and travoprost published in English from 1990 through 2007 that evaluated medical treatments for open-angle glaucoma or ocular hypertension. Information from 28 published studies was compiled into an initial database. Additional IOP, hyperemia, and covariate data from studies of bimatoprost and travoprost were retrieved from the Summary Basis of Approval documents of the New Drug Applications published on the US Food and Drug Administration Center for Drug Evaluation and Research website (www.fda.gov/cder). Data from unpublished reports of a latanoprost clinical study were identified and added to the database, bringing the total number of trials included to 38. All trials identified reported adherence to the Declaration of Helsinki.
Results on IOP, hyperemia, dosing, and covariates were extracted according to a prespecified protocol. All data were examined carefully for errors, and subgroup or duplicate information for IOP and hyperemia endpoints was removed. To create the final analysis database, the initial search results were filtered and excluded if they included the following criteria: nonrandomized/uncontrolled trials, healthy volunteer trials; open-label trials/extensions; combination treatments; treatments other than timolol, latanoprost, bimatoprost, or travoprost; on-treatment measurements taken within the first 6 days of therapy; washout measurements taken >24 h after daily and >12 h after twice-daily dosing; and percentage change from baseline data. The final analysis database included 31 trials for the efficacy analysis and 25 trials for the safety analysis (listed in the Appendix), and contained detailed information on the efficacy and safety outcomes, data sources, and trial and patient characteristics.
Efficacy endpoint
The primary efficacy endpoint was the absolute change from baseline in the IOP measured at a specific clock time during the day after at least 1 week of treatment. Results of mean IOP over several clock times (mean diurnal) were excluded from the analysis. For trials reporting data from both sitting and supine positions, IOP measurements in the sitting position were used in the analysis.
Efficacy data were analyzed according to the following general dose–response Emax model
3
:
where
(1) IOPijkl is the observed mean change from baseline of the ith trial for week j in the kth treatment arm at clock-time l.
(2) E0 is the IOP placebo response.
(3) Emax is the maximal drug effect, reflecting the maximal difference in IOP response between placebo and active treatment.
(4) Dose is the total daily dose of drug.
(5) ED50 is the dose to achieve an IOP response that is 50% of Emax.
(6)
(7)
(8) Nik is the sample size of the kth arm in the ith trial.
The correlation (ρ) between repeated observations (with time) for a specific group of patients in a treatment arm was also estimated. Inclusion of this correlation accounts for the adequate weighing of multiple observations in the same group of patients. The impact of trial, patient, drug, drug class, and treatment characteristics on E0, Emax, and ED50 of the dose–response relationship was evaluated. The base model assumed a different ED50 but a similar Emax for each drug within a class.
Safety endpoint
As hyperemia is the most commonly reported adverse event in patients receiving prostaglandin analogs, the safety analyses were based on the incidence of hyperemia (number of patients) that was reported as an adverse event within a treatment arm in the clinical trial dataset. If a specific trial reported a graded hyperemia score, the number of patients with scores greater or equal to mild hyperemia was used. The following equation, which does not include a time course (applied in IOP measurements), was used to describe these data.
In this equation, P(Event)ij represents the probability of a patient having hyperemia in the jth treatment arm of the ith trial at a total daily dose, Doseij. The number of patients with events is assumed to follow a binomial distribution given the probability of the event and the sample size (Nij). The hyperemia placebo response (E0) was dependent on a trial-specific random effect (
The impact of patient, drug, and treatment characteristics on E0, Emax, and ED50 of the dose–response relationship was evaluated. The base model assumed a different ED50 but a similar Emax for each drug within a class.
Therapeutic index
The values derived from the efficacy and safety models were combined to create a therapeutic index for an ocular hypotensive agent, defined as the ratio of the dose of a drug that provides an acceptable risk of hyperemia to that which meets the required level of IOP reduction. In the present study, the Emax models for IOP reduction and hyperemia incidence were employed to determine the relative therapeutic indices of the prostaglandin analogs, in which the therapeutic index was defined as the ratio of ED50 for hyperemia and the ED50 for IOP lowering. This procedure was valid, even without considering whether the efficacy (IOP lowering) or safety (hyperemia) actually was acceptable at the ED50, because the objective was to compare relative therapeutic indices among the various drugs. This relative therapeutic index is independent of acceptable hyperemia and IOP lowering if the drugs share a similar Emax.
Statistical analysis
The nonlinear, mixed-effect regression function provided in S-PLUS 6.2 (Insightful Corp., Palo Alto, CA) was used to calculate maximum likelihood estimates of the model parameters of the IOP model. The software package NONMEM, version VI, level 1.0 (Globomax, Hanover, MD), was used to estimate the hyperemia model. Model simulation and graphics were also conducted using S-PLUS 6.2. For both endpoints, a base model structure characterizing the dose and response was developed first. For the IOP model, the time course of placebo was also included in the base model. After the base model was built, the following explanatory covariates were tested for their impact on the model parameters: treatment regimen, baseline IOP (IOP model), race, age, sex, time after first dose, time of day, and time after each dose. Missing baseline or time-independent covariates (race, age, and sex) used the average of all the trials. Missing race information was estimated based on typical racial profiles of the study region.
A stepwise addition and deletion model selection strategy was used, and linear as well as nonlinear relationships between the explanatory variables and model parameters were evaluated. Model selection was performed on the basis of a log likelihood ratio test at an acceptance P value of 0.01. The clinical relevance of any relationship was also considered. Confidence intervals (CIs) were derived from the variance matrix of the parameter estimates. A 90% CI was taken from the 5th to the 95th percentile. Diagnostic plots and procedures were produced to evaluate the validity of the models.
The models were used to predict the mean IOP response and incidence of hyperemia in the patient population and the associated uncertainty as a function of dose and other significant covariates. For model predictions, a total of 2,500 model parameters were sampled from the variance matrix of the parameter estimates.
Results
Dose–response Emax model for prostaglandin analogs and timolol efficacy for modeling IOP response
The data set for modeling IOP responses is summarized in Table 1. The database totaled 766 summary data points from 90 treatment arms in 31 trials involving 30 different treatment regimens in 6,516 patients.
BID/QAM/QPM, twice daily/once daily in the morning/once daily in the evening; IOP, intraocular pressure.
Final IOP model
Parameter estimates for the final IOP model, including statistically significant covariate effects for placebo and Emax, are shown in Table 2. For placebo response, the final covariate model is as follows:
BID, twice daily; CI, confidence interval; E0, IOP placebo response; ED50, dose required for half-maximal efficacy; Emax, maximal drug effect; ρ, correlation between repeated observations (with time) for patients within a treatment arm; QAM, every morning.
The estimated placebo response for a baseline IOP of 25 mmHg is −2.01 mmHg (90% CI, −2.58 to −1.45). As seen in Equation 3, the placebo response increased with increasing baseline IOP (base) and decreased with time after the first dose (day). It should be noted that the response to an active treatment included the placebo response (Equation 1); however, the difference between active treatment and placebo was not affected by the magnitude of the latter.
With respect to Emax, the final model was as follows:
The potential maximal IOP change relative to placebo (Emax) was estimated to be −6.27 mmHg (90% CI, −6.82 to −5.72); furthermore, from the Emax,2 term, Emax was found to increase with higher baseline IOP (base). This indicates that higher baseline IOP results in a greater potential for IOP reduction when compared with placebo. There was no significant difference in Emax among the 3 prostaglandin analogs. Time of administration (every morning vs. every evening) and dosing frequency (once every day vs. twice daily) had significant impact on maximal IOP reduction. Across all drugs (prostaglandin analogs and beta-blocker), twice-daily dosing provided a smaller effect than every-evening dosing. These results suggest that tolerance develops to the IOP-lowering effect of prostaglandin analogs. The final model suggests that every-morning dosing and twice-daily dosing result in less IOP reduction than every-evening dosing. The impact of time of administration and dosing frequency was similar among the 3 prostaglandin analogs. There was significant between-trial heterogeneity in the mean effect, with a standard deviation of between-trial variability estimated at 1.1 mmHg. Values of ED50 for timolol, bimatoprost, latanoprost, and travoprost were 0.36%, 0.002%, 0.00098%, and 0.00063%, respectively.
Diagnostics for model evaluation did not exhibit any apparent model misspecification. When the model performance was examined for all trials and treatments as change from baseline in each trial and the model prediction, there was good agreement between the observed IOP and the prediction.
IOP dose–response relationship
The observed dose–response relationships for the 4 drugs, together with the prediction from the Emax model, are shown in Figure 1. There is good agreement between the observed and predicted values, with all 3 prostaglandin analogs producing similar maximum IOP lowering and differing only in the total daily dose required for this effect; timolol did not reduce IOP to the same extent. The similarity of dose–response curves for equipotent doses of the prostaglandin analogs is further emphasized in Figure 2, matching the predictions of the Emax model. In addition, the model showed that for timing of dosing, Emax is obtained by the evening dosing compared with morning or twice-daily administration. This also indicates that the impact of the dose administration time on the dose and response was similar among agents. The analysis of the impact of the time of day on the prostaglandin dose–response relationship for IOP reduction, normalized to bimatoprost for potency, showed that the highest IOP reduction occurred at 8–9
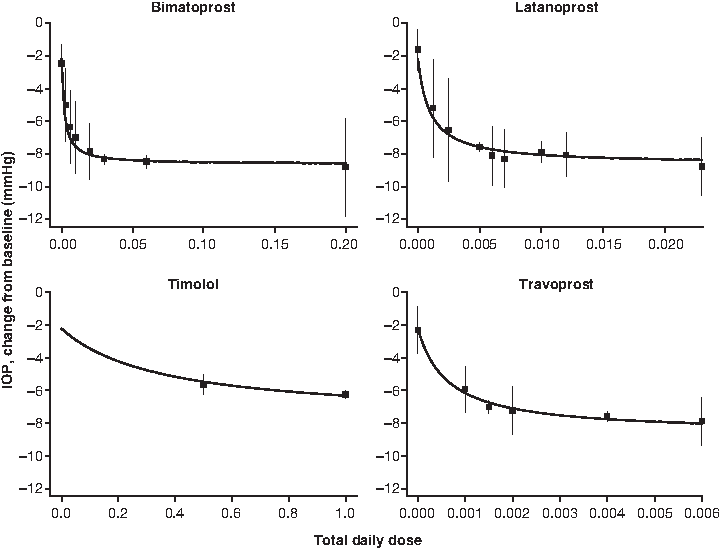
Dose and response of every-evening administration of prostaglandin analogs and twice-daily administration of timolol. Solid lines are the model predictions normalized to 8
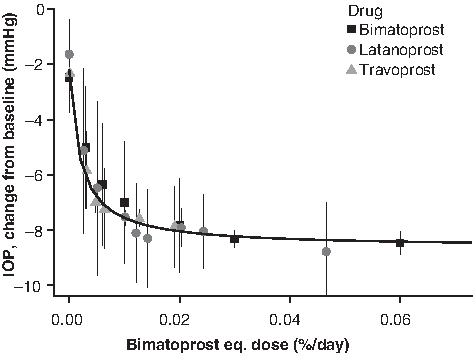
Dose and response of every-evening administration of the prostaglandin analogs. The solid line is the model-predicted dose–response relationship for bimatoprost normalized to 8
Diurnal variation in IOP change from baseline
Diurnal variation among several treatment regimens is shown in Figure 3, together with predicted values from the model, when normalized to the typical IOP diurnal variation. The variation in change from baseline over the day was explained essentially by diurnal variation in baseline IOP; Emax (reduction from baseline) was seen in the morning, owing to the maximal baseline IOP occurring in the morning.
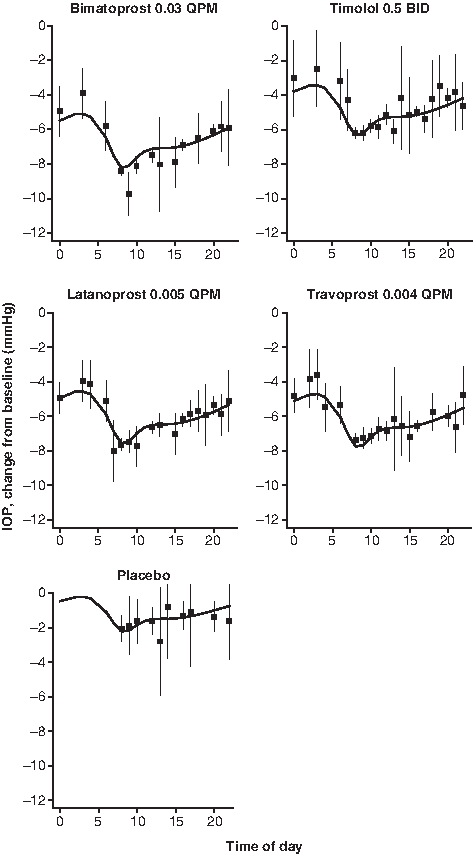
IOP reduction at different times of the day for the standard treatment regimens. The solid lines are the model prediction normalized to the typical baseline IOP diurnal variation pattern, and the symbols represent the mean observed values after adjustment for the trial-specific random effect with an ∼95% confidence interval. BID, twice daily; QPM, every evening.
Dose–response model for prostaglandin analog and timolol safety trial database for hyperemia incidence modeling
The database for hyperemia totaled 76 summary data points from 76 treatment arms of 25 trials (listed in Appendix), with 29 unique treatment regimens administered to 6,244 patients (Table 3).
The daily dose and treatment days show the median and range across the trials. The treatment regimen shows the number of patients receiving each regimen. The adverse event (hyperemia)/≥mild row shows the number of patients for each assessment method.
BID/QAM/QPM/QPM and QAM, twice daily/once daily in the morning/once daily in the evening/once daily in the evening and once daily in the morning.
These data were used in the model-building process to estimate parameters for Equation 2; they included Emax and ED50 for the prostaglandin analogs (since they led to an increase in hyperemic events) as well as E0, the placebo-related incidence of hyperemia. Timolol did not increase the incidence of hyperemia over that seen with placebo; the duration of treatment and dosing frequency also had no effect. The final parameters for the hyperemia model are shown in Table 4. The ED50 values for bimatoprost, latanoprost, and travoprost were estimated as 0.011%, 0.014%, and 0.0015% daily, respectively.
Hyperemia dose and response
Application of the Emax model for the incidence of hyperemia with the prostaglandin analogs is shown in Figure 4. Note that the solid lines indicate the predicted dose–response relationship for a typical trial after adjusting for the trial-specific random effect (
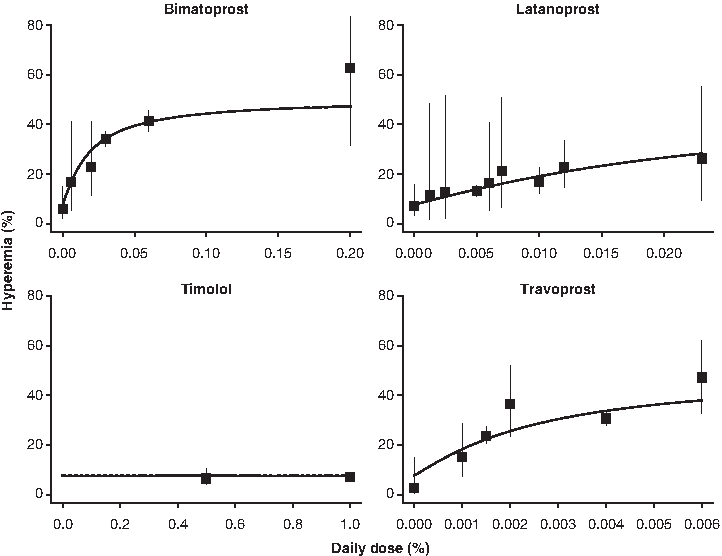
Hyperemia dose–response relationship of prostaglandin analogs and timolol. The symbols reflect the mean observed incidence of hyperemia and an ∼95% confidence interval after adjusting for the trial-specific random effect. The solid line reflects the predicted dose–response relationship for a typical trial.
Therapeutic index of prostaglandin analogs
Because the maximal response for IOP reduction and the incidence of hyperemia were similar between the prostaglandin analogs, the therapeutic index described in the Methods section provides a comparison of the relative efficacy and tolerability among compounds. The therapeutic index—namely, the ratio of ED50 for hyperemia and the ED50 for IOP lowering—is high when there is a greater difference between the dose range that provides an adequate reduction in IOP and the dose range that produces a high incidence of hyperemia. The therapeutic indexes for bimatoprost, latanoprost, and travoprost (Table 5) indicate that latanoprost treatment would lead to the lowest incidence of hyperemia for a given amount of IOP lowering, and travoprost would invoke the highest incidence of hyperemia for a given IOP lowering.
Discussion
The principal objective of the model-based meta-analysis was to develop a pharmacodynamic model that accurately characterized dose–response relationships for both IOP lowering and incidence of hyperemia using data from the broad class of prostaglandin analogs and the beta-blocker timolol. The resultant model, based on a meta-analysis of data from a total of 32 trials, fulfilled these requirements. The dose–response relationships for both IOP lowering and incidence of hyperemia were well described by an Emax model.
Individual clinical trials are limited in scope and cannot include all the treatment groups that may be of interest. In contrast, with these models, comparisons with other therapies and regimens not included in the clinical trial can be performed. This approach facilitates the evaluation of new IOP-lowering compounds in a broader context than just a single clinical trial of a compound. The model-based meta-analysis can provide additional comparisons and insight for a project's decision-making process. When the meta-analysis models are updated with the new trial data, simulations can be performed that provide estimates of relevant comparisons and the probability of technical success for the new therapy against response targets related to the product profile.4–6
Some consistent effects emerged from the meta-analysis with regard to IOP reduction for the included therapies. The large variation observed in reducing IOP over time throughout the day appeared to be explained essentially by diurnal variation in baseline IOP. Also, the prostaglandin analogs appear to share a similar Emax for IOP lowering and hyperemia and only differ in the dose required to produce a certain effect. Having a similar Emax allows the calculation of a therapeutic index that can be used to compare the risk/benefit ratio of prostaglandin analogs. The higher therapeutic index for latanoprost indicates that this therapy has a lower incidence of hyperemia than bimatoprost or travoprost at doses providing equivalent IOP lowering. Another prostaglandin effect was observed as follows: a higher reduction in IOP occurred when the patient was dosed once daily in the evening compared with morning dosing.
In conclusion, the use of model-based meta-analyses for comparing competing therapies is an important and useful tool in drug development. This approach permitted a new IOP-lowering therapy to be compared with multiple agents currently used in clinical practice. This methodology would have utility in evaluating any IOP-lowering agent during the drug development process.
Footnotes
Acknowledgments
Editorial support, including assistance in the manuscript development and styling for the journal, was provided by Lauren Swenarchuk, PhD, of Zola Associates, and Mukund Nori, PhD, MBA, CMPP, of Engage Scientific Solutions and was funded by Pfizer Inc. This research was supported by Pfizer Inc, New York, New York.
Author Disclosure Statement
S.R. is an employee of Pfizer Inc; J.W.M. was contracted by Pfizer Inc, and reports no other disclosures; H.L. was contracted by Pfizer Inc, and reports no other disclosures; D.J.N. is an employee of Pfizer Inc.
Appendix
The final analysis database included 32 trials, with 31 trials for the efficacy analysis (*) and 25 trials for the safety analysis (†).
*†A 1-month, single-center, double-masked, randomized, parallel, vehicle-controlled, morning dosing, pilot study of the safety and efficacy of AGN 192024 0.03% ophthalmic solution in subjects with open-angle glaucoma or ocular hypertension (192024-003). NDA (New Drug Application) 21-275 medical review. 2000.
*†A 1-month, investigator-masked, parallel, randomized safety and efficacy study of AGN 192024 0.003%, 0.01% and 0.03% ophthalmic solutions compared to its vehicle and timolol 0.5% in subjects with open-angle glaucoma or ocular hypertension (192024-001). NDA 21-275 medical review. 2000.
*†A 6-month, multicenter, triple-masked, placebo-controlled adjunctive therapy study of the safety and efficacy of AL-6221 0.0015% and AL-6221 0.004% ophthalmic solution in patients with open-angle glaucoma or ocular hypertension maintained on timoptic 0. (C97-73). NDA 21-257 medical review. 2001.
*†A 9-month, triple-masked, parallel-group, primary therapy study of the safety and efficacy of AL-6221 0.0015% and AL-6211 0.004% compared to timoptic 0.5% in patients with open-angle glaucoma or ocular hypertension (C97-79). NDA 21-257 medical review. 2001.
*†A 4-week, multicenter triple-masked, placebo-controlled, dose–response study of the safety and efficacy of AL-6221 ophthalmic solution in the treatment of patients with primary open-angle glaucoma or ocular hypertension (C97-02). NDA 21-257 medical review. 2001.
*†Alm A. Intraocular pressure-lowering effect and side effects of PhXA41, a 4-week dose titration study. Pharmacia CSR [Clinical Study Report] L411G018. 1991.
*†Alm, A., and Stjernschantz, J., Scandinavian Latanoprost Study Group. Effects on intraocular pressure and side effects of 0.005% latanoprost applied once daily, evening or morning. A comparison with timolol. Ophthalmology. 1995; 102:1743–1752.
*Alm, A., Villumsen, J., Tornquist, P., et al. Intraocular pressure-reducing effect of PhXA41 in patients with increased eye pressure. A one-month study. Ophthalmology. 1993; 100:1312–1316; discussion 1316–1317.
*†Brandt, J. D., VanDenburgh, A. M., Chen, K., and Whitcup, S. M. Comparison of once- or twice-daily bimatoprost with twice-daily timolol in patients with elevated IOP: a 3-month clinical trial. Ophthalmology. 2001; 108:1023–1031; discussion 1032.
*†Camras, C. B., The United States Latanoprost Study Group. Comparison of latanoprost and timolol in patients with ocular hypertension and glaucoma: a six-month masked, multicenter trial in the United States. Ophthalmology. 1996; 103:138–147.
*Cantor, L. B., WuDunn, D., Cortes, A., Hoop, J., and Knotts, S. Ocular hypotensive efficacy of bimatoprost 0.03% and travoprost 0.004% in patients with glaucoma or ocular hypertension. Surv Ophthalmol. 2004; 49(Suppl 1):S12–18.
*†Coakes R. Administration of latanoprost eye drops once daily for 14 days. Pharmacia CSR L411G025. 1994.
*†DuBiner, H., Cooke, D., Dirks, M., Stewart, W. C, VanDenburgh, A. M., and Felix C. Efficacy and safety of bimatoprost in patients with elevated intraocular pressure: a 30-day comparison with latanoprost. Surv Ophthalmol. 2001; 45(Suppl 4):S353–360.
*Dubiner, H. B., Sircy, M. D., Landry, T., et al. Comparison of the diurnal ocular hypotensive efficacy of travoprost and latanoprost over a 44-hour period in patients with elevated intraocular pressure. Clin Ther. 2004; 26:84–91.
*†Fellman, R. L., Sullivan, E. K., Ratliff, M., et al. Comparison of travoprost 0.0015% and 0.004% with timolol 0.5% in patients with elevated intraocular pressure: a 6-month, masked, multicenter trial. Ophthalmology. 2002; 109:998–1008.
*†Gandolfi, S., Simmons, S. T., Sturm, R., Chen, K., VanDenburgh, A. M. Three-month comparison of bimatoprost and latanoprost in patients with glaucoma and ocular hypertension. Adv Ther. 2001; 18:110–121.
*†Garcia-Feijoo, J., Martinez-de-la-Casa, J. M., Castillo, A., Mendez, C., Fernandez-Vidal, A., and Garcia-Sanchez, J. Circadian IOP-lowering efficacy of travoprost 0.004% ophthalmic solution compared to latanoprost 0.005%. Curr Med Res Opin. 2006; 22:1689–1697.
*†Konstas, A. G., Mikropoulos, D., Kaltsos, K., Jenkins, J. N., and Stewart, W. C. 24-hour intraocular pressure control obtained with evening- versus morning-dosed travoprost in primary open-angle glaucoma. Ophthalmology. 2006; 113:446–450.
*†Laibovitz, R. A., VanDenburgh, A. M., Felix, C., et al. Comparison of the ocular hypotensive lipid AGN 192024 with timolol: dosing, efficacy, and safety evaluation of a novel compound for glaucoma management. Arch Ophthalmol. 2001; 119:994–1000.
*†Mishima, H. K., Masuda, K., Kitazawa, Y., Azuma, I., and Araie, M. A comparison of latanoprost and timolol in primary open-angle glaucoma and ocular hypertension. A 12-week study. Arch Ophthalmol. 1996; 114:929–932.
*†Nagasubramanian, S., Sheth, G. P., Hitchings, R. A., and Stjernschantz, J. Intraocular pressure-reducing effect of PhXA41 in ocular hypertension. Comparison of dose regimens. Ophthalmology. 1993; 100:1305–1311.
*†Netland, P. A., Landry, T., Sullivan, E. K., et al. Travoprost compared with latanoprost and timolol in patients with open-angle glaucoma or ocular hypertension. Am J Ophthalmol. 2001; 132:472–484.
*†Noecker, R. S., Dirks, M. S., Choplin, N. T., Bernstein, P., Batoosingh, A. L., and Whitcup, S. M. A six-month randomized clinical trial comparing the intraocular pressure-lowering efficacy of bimatoprost and latanoprost in patients with ocular hypertension or glaucoma. Am J Ophthalmol. 2003; 135:55–63.
*Orzalesi, N., Rossetti, L., Bottoli, A., and Fogagnolo P. Comparison of the effects of latanoprost, travoprost, and bimatoprost on circadian intraocular pressure in patients with glaucoma or ocular hypertension. Ophthalmology. 2006; 113:239–246.
*Orzalesi, N., Rossetti, L., Invernizzi, T., Bottoli, A., and Autelitano, A. Effect of timolol, latanoprost, and dorzolamide on circadian IOP in glaucoma or ocular hypertension. Invest Ophthalmol Vis Sci. 2000; 41:2566–2573.
*†Parrish, R. K., Palmberg, P., and Sheu, W. P. A comparison of latanoprost, bimatoprost, and travoprost in patients with elevated intraocular pressure: a 12-week, randomized, masked-evaluator multicenter study. Am J Ophthalmol. 2003; 135:688–703.
*Racz, P., Ruzsonyi, M. R., Nagy, Z. T., and Bito, L. Z. Maintained intraocular pressure reduction with once-a-day application of a new prostaglandin F2 alpha analogue (PhXA41). An in-hospital, placebo-controlled study. Arch Ophthalmol. 1993; 111:657–661.
*Sihota, R., Saxena, R., Agarwal, H. C., Pandey, R. M., and Gulati, V. Peak pressures: crossover study of timolol and latanoprost. Eur J Ophthalmol. 2003; 13:546–552.
*†Walters, T. R., DuBiner, H. B., Carpenter, S. P., Khan, B., and VanDenburgh, A. M. 24-Hour IOP control with once-daily bimatoprost, timolol gel-forming solution, or latanoprost: a 1-month, randomized, comparative clinical trial. Surv Ophthalmol. 2004; 49(Suppl 1):S26–35.
*†Watson, P., Stjernschantz, J., and the Latanoprost Study Group. A six-month, randomized, double-masked study comparing latanoprost with timolol in open-angle glaucoma and ocular hypertension. Ophthalmology. 1996; 103:126–137.
*†Whitcup, S. M., Cantor, L. B., VanDenburgh, A. M., and Chen, K. A randomised, double masked, multicentre clinical trial comparing bimatoprost and timolol for the treatment of glaucoma and ocular hypertension. Br J Ophthalmol. 2003; 87:57–62.
†Ziai, N., Dolan, J. W., Kacere, R. D., and Brubaker, R. F. The effects on aqueous dynamics of PhXA41, a new prostaglandin F2 alpha analogue, after topical application in normal and ocular hypertensive human eyes. Arch Ophthalmol. 1993; 111:1351–1358.