
Abstract
Abstract
Purpose:
A prospective study was performed to compare the ocular pulse amplitude (OPA)-lowering effects of tafluprost and latanoprost, used in the treatment of glaucoma, using dynamic contour tonometry.
Methods:
The study population consisted of patients with normal-tension glaucoma (NTG) (n = 27) or primary open-angle glaucoma (POAG) (n = 14) treated with tafluprost and latanoprost. All patients were newly diagnosed with NTG and POAG and had undergone no previous treatment.
Intraocular pressure (IOP) was measured by Goldmann applanation tonometry (GAT), OPA was measured by dynamic contour tonometry, and corrected OPA (cOPA) was calculated before and after 1 week, 1–3 months of treatment.
Results:
Initial IOP and OPA were 17.12 ± 3.75, 2.30 ± 0.56 mmHg and 17.53 ± 2.87, 2.65 ± 0.94 mmHg in the tafluprost and latanoprost groups, respectively. After 3 months of treatment, IOP and OPA were 13.00 ± 2.04 mmHg (24.1%) and 1.51 ± 0.30 mmHg (34.3%), respectively, in the tafluprost group. These values were 15.40 ± 2.32 mmHg (12.2%) and 2.08 ± 0.83 mmHg (21.5%), respectively, in the latanoprost group. Therefore, tafluprost significantly reduced IOP (P = 0.01), but OPA-lowering effects did not differ significantly between the 2 groups (P = 0.17). However, the cOPA-lowering effect of tafluprost (1.27 mmHg, 55.2%) was significantly greater than that of latanoprost (0.84 mmHg, 31.7%) after 3 months of treatment (P < 0.001).
Conclusions:
Tafluprost and latanoprost, used to treat glaucoma, have marked OPA-lowering effects as well as IOP-lowering effects. Moreover, tafluprost has a greater effect than latanoprost. Therefore, it can be used for patients in need of IOP reduction and at risk of glaucoma progression.
Introduction
G
Prostaglandin (PG) analogs are the most potent ocular hypotensive medications for topical use, making them the first choice of therapy for the treatment of open-angle glaucoma and ocular hypertension. 15 Tafluprost is a new potent fluoroprostaglandin (FP) analog with high affinity for the FP receptor. Izumi et al. reported that administration of 0.0015% tafluprost significantly increased retinal blood flow and blood velocity, as determined by laser Doppler velocimetry in cats. 16 This observation was confirmed by Akaishi et al., who found that optic nerve head blood flow increased in rabbit eyes after 28 days of treatment with any of the 3 F2α prostaglandin analogs (tafluprost, latanoprost, travoprost). Using laser speckle flowgraphy, the effect of tafluprost (+11.9%) on blood flow was significantly greater than the effect of travoprost (+6.7%, P = 0.037) and tended to be greater than the effect of latanoprost (+7.2%, P = 0.086) at 60 min on day 28 posttreatment. 17
The present study was conducted to investigate the reasons for these differences in hypotensive efficacy and effects on OPA, using 0.0015% tafluprost eye drops and 0.005% latanoprost eye drops in patients with primary open-angle glaucoma (POAG) and NTG.
Methods
Patients and procedures
This prospective, randomized single-center study assessed 41 eyes of 41 subjects recruited from the glaucoma clinic at Soonchunhyang University Hospital, Seoul, Korea. Before participation, informed consent was obtained from all participants after the nature and possible consequences of the study were explained. The study protocol adhered to the tenets of the Declaration of Helsinki and was approved by the Local Institutional Review Board (IRB of Soonchunhyang University Hospital, Seoul, Korea). After providing informed consent, participants were randomized using a computer-generated list. Allocation was concealed.
Each subject was initially seen by one of our glaucoma specialists and underwent a Humphrey visual field test, manifest refraction test, IOP measurement by Goldmann applanation tonometer (GAT) and Dynamic contour tonometer (DCT), OPA measurement by DCT and central corneal thickness (CCT) measurement by ultrasonic pachymetry, and cup/disc ratio measurement by optical coherence tomography and fundus photography. To exclude the impact of diurnal IOP variation, all patients visited the hospital at the similar time of the day in the afternoon. Patients were instructed to avoid caffeine intake, smoking, and exercise for 3 h before each study visit.
All patients were newly diagnosed with NTG and POAG and had undergone no previous treatment. Only 1 eye per patient was included in the study. The eye with greater glaucomatous damage was selected in the glaucoma patients. One eye was randomly chosen in the patients with symmetrical glaucomatous damage. Patients were divided into 2 groups: group 1 (n = 20) treated with tafluprost and group 2 (n = 21) treated with latanoprost.
Patients with glaucoma were defined as those meeting Hodapp's diagnostic criteria for glaucomatous visual field defects, as confirmed by at least 2 reliable and reproducible visual field examination results, and by the presence of a glaucomatous optic disc that exhibited increased cupping (vertical cup/disc ratio of >0.6), diffuse or focal neural rim thinning, optic disc hemorrhage, and nerve fiber layer defects on optical coherence tomography correlated with visual field defect. 18 In addition, to determine normal anterior chamber and normal open angles in the included eyes, slit-lamp examination and gonioscopy were performed using a Sussman lens (Ocular Inc., Dallas, TX). A maximum untreated IOP of 21 mmHg or more measured by Goldmann tonometry was required for a diagnosis of POAG, and a maximum untreated IOP of 21 mmHg or less was required for a diagnosis of NTG.
Individuals with a previous history of glaucoma medication, ocular surgery, laser procedures in the eye, a corneal disorder that could interfere with optimal GAT or DCT, advanced cataract, or evidence of ocular infection were excluded from the study.
Study design
IOP and OPA were determined and recorded in all patients before treatment, and at 1 week, 1–3 months of treatment. IOP was measured using a GAT and Pascal tonometer (Swiss Microtechnology AG, Port, Switzerland). The quality of DCT measurement ranges from 1 to 5 (where 1 is optimal and 5 is least optimal), and only readings with quality levels of 1–3 were included in this study. OPA determined by DCT represents the difference between systolic and diastolic IOP. In addition, corrected OPA (cOPA) was calculated to determine the value of OPA, excluding the influence of IOP. The cOPA formula is as follows: cOPA = OPA–(ΔIOP × 0.12).19,20
Statistical analyses
The Mann–Whitney U-test was used to compare the IOP, OPA, and cOPA of the 2 study groups. Wilcoxon's signed-rank test was used to evaluate changes in IOP, OPA, and cOPA in the 2 groups. All analyses were conducted using SPSS version 18.0 (SPSS, Inc., Chicago, IL). In all analyses, P < 0.05 was taken to indicate statistical significance.
Results
Table 1 summarizes the patient characteristics in the 2 study groups: 20 subjects and 21 subjects were randomly assigned into the tafluprost group and the latanoprost group, respectively. The mean patient age was 53.60 ± 11.67 years in the tafluprost group and 56.50 ± 12.38 years in the latanoprost group; this was not a significant difference. A total of 18 (43.9%) men and 23 (56.1%) women were included: 8 men (40%) were in the tafluprost group and 10 men (47.6%) were in the latanoprost group. Of the 41 subjects, 27 subjects (67.1%) were diagnosed with NTG and 14 subjects (32.9%) were diagnosed with POAG. In addition, 15 subjects (75.0%) had NTG and 5 subjects (25.0%) had POAG in the tafluprost group, and 12 subjects (57.1%) had NTG and 9 subjects (42.9%) had POAG in the latanoprost group. The differences between the 2 study groups were not significant.
Group 1 = Initiation of glaucoma treatment with tafluprost.
Group 2 = Initiation of glaucoma treatment with latanoprost.
DM, diabetes mellitus; HTN, hypertension; NTG, normal tension glaucoma; POAG, primary open angle glaucoma; CCT, central corneal thickness; NS, not significant, compared with 2 groups.
At baseline, the mean IOP measured by GAT was 17.12 ± 3.75 mmHg in the tafluprost group and 17.53 ± 2.87 mmHg in the latanoprost group. The mean OPA measured by DCT was 2.30 ± 0.56 mmHg in the tafluprost group and 2.65 ± 0.94 mmHg in the latanoprost group. No significant differences appeared in baseline IOP or OPA between the 2 groups. The mean values for CCT were 524.82 ± 11.41 μm in the tafluprost group and 533.41 ± 41.03 μm in the latanoprost group. Cup/disc ratios were 0.68 ± 1.42 and 0.67 ± 1.50, respectively. No significant differences appeared in CCT values or cup/disc ratios between the 2 groups.
Figure 1 presents mean IOP findings in the 2 groups at baseline, 1 week, 1–3 months. At 3 months, the mean decrease in IOP from baseline in the tafluprost group was −4.12 mmHg (24.1%) compared with −2.13 mmHg (12.2%) in the latanoprost group. The difference in IOP reduction between the 2 groups was statistically significant (P = 0.01).
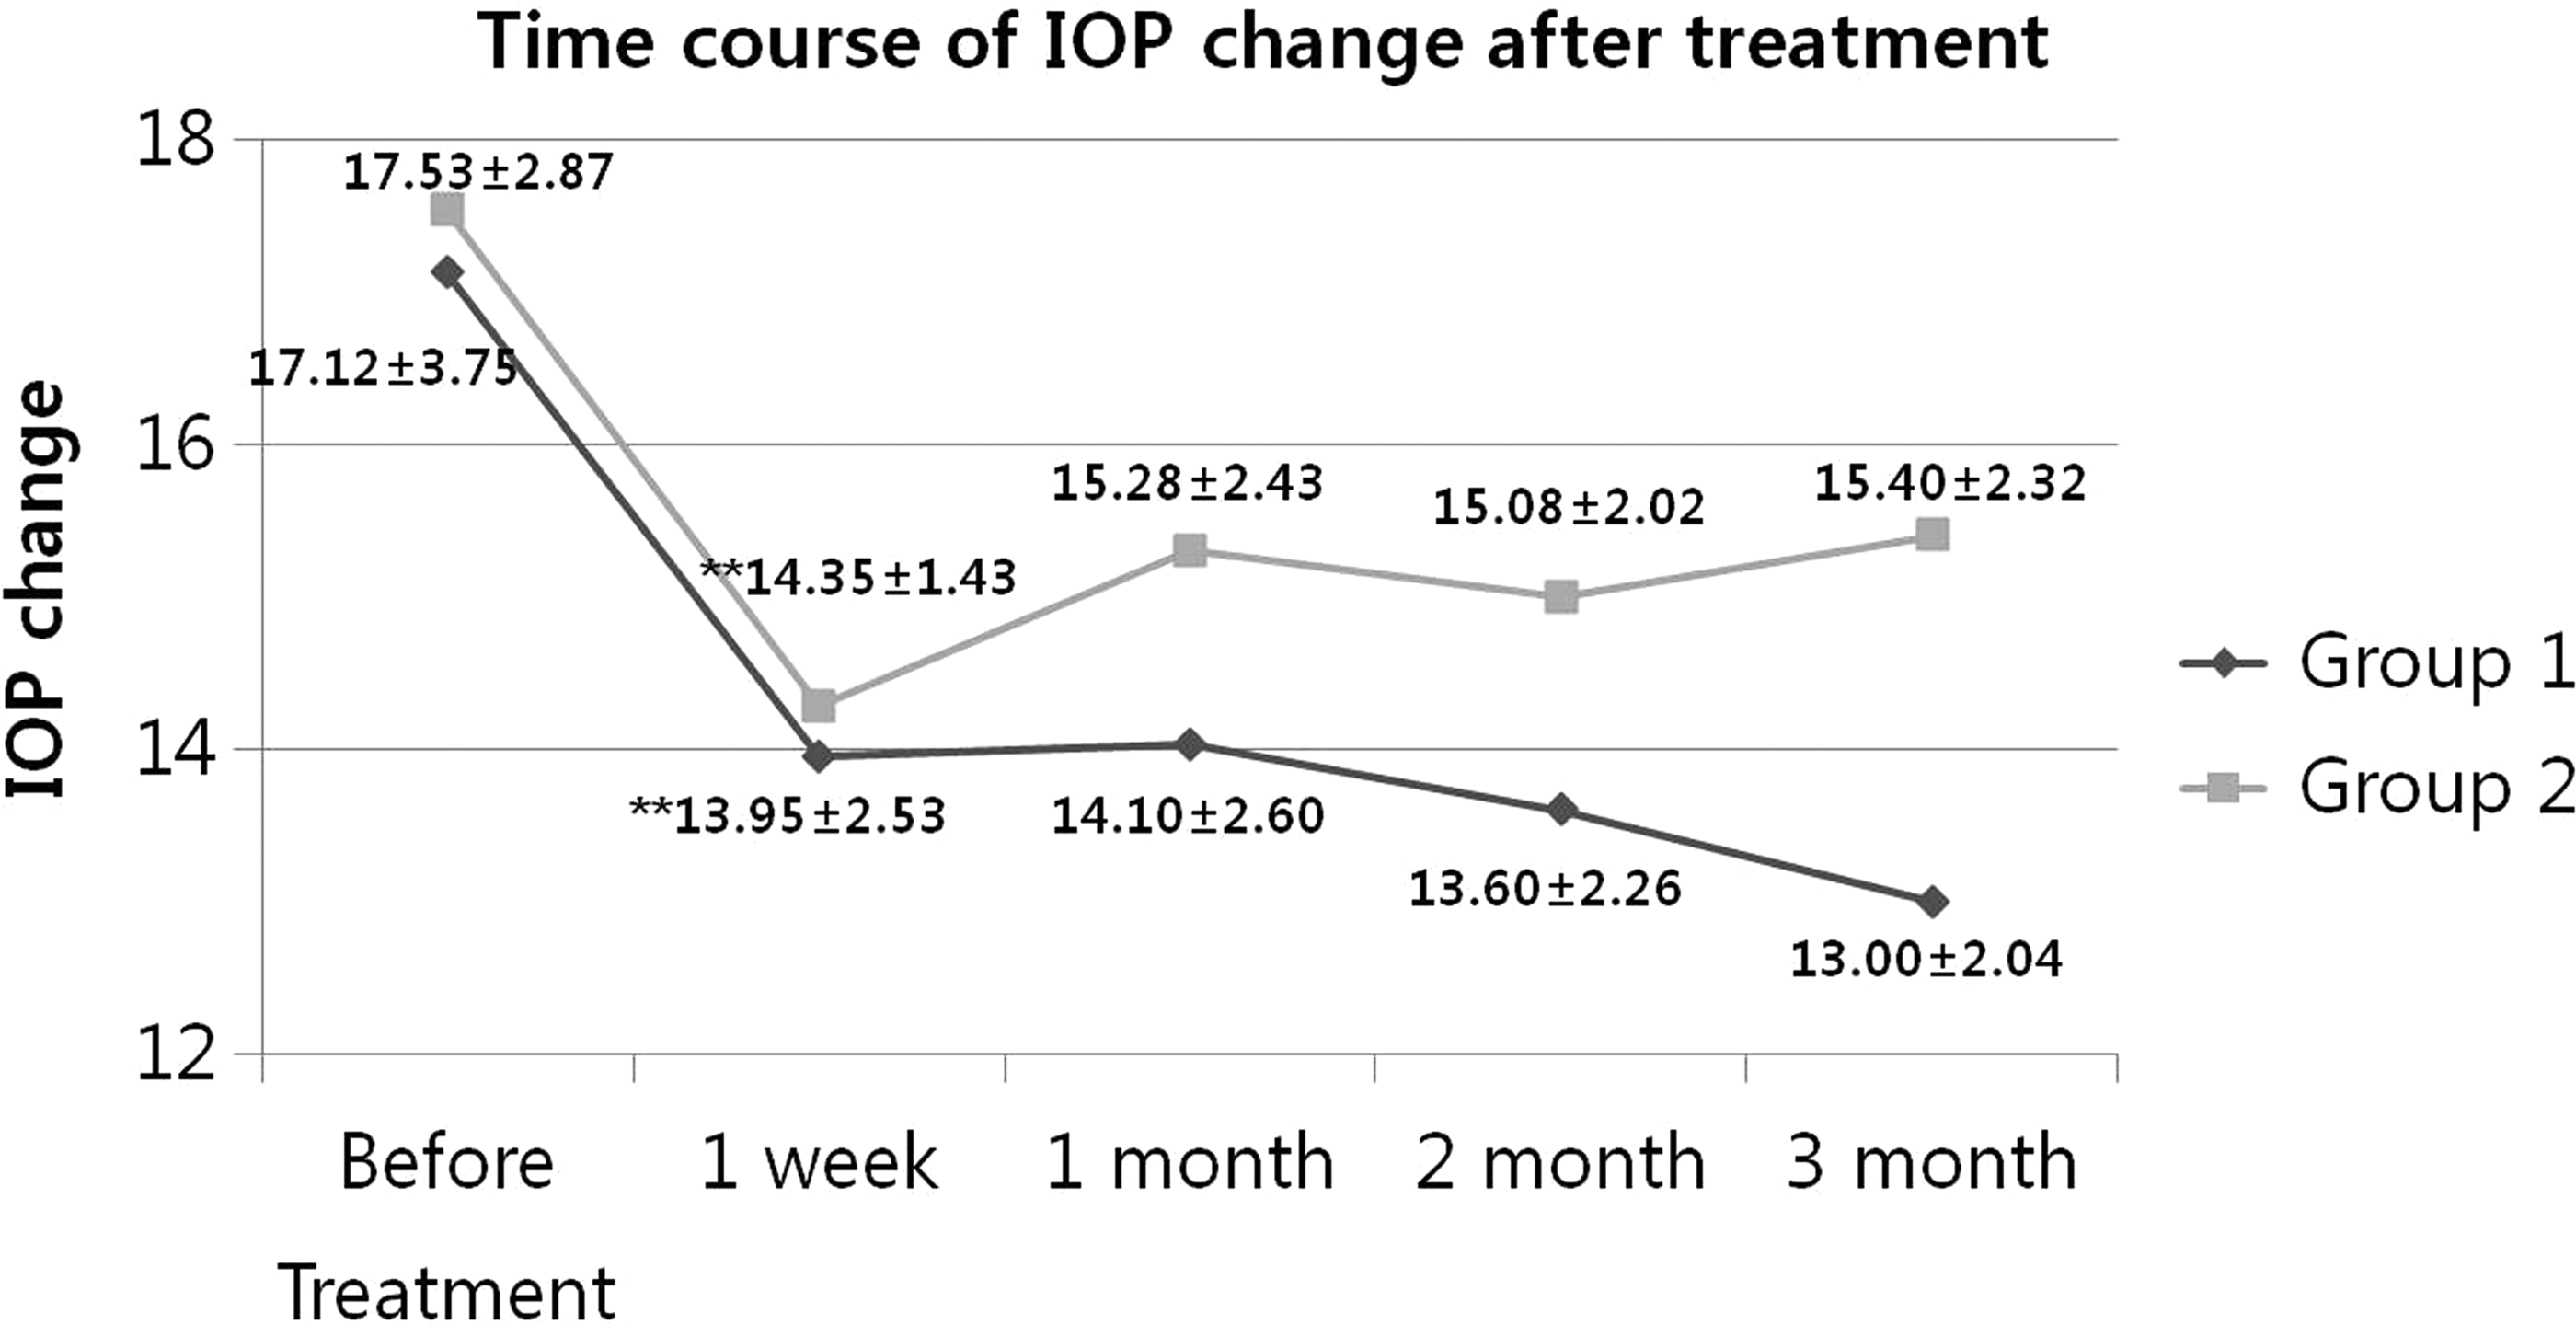
Intraocular pressure measurements (mean ± SD) in the 2 treatment groups before and after administration of tafluprost and latanoprost. **P < 0.05, compared with 2 groups. Group 1 = Initiation of glaucoma treatment with tafluprost. Group 2 = Initiation of glaucoma treatment with latanoprost.
Figure 2 presents mean OPA findings in the 2 groups at baseline, 1 week, 1–3 months. At 3 months, the mean decrease in OPA from baseline in the tafluprost group was −0.79 mmHg (34.3%) compared with −0.57 mmHg (21.5%) in the latanoprost group. The OPA-reducing effect was stronger in the tafluprost group than the latanoprost group, but the difference was not statistically significant (P = 0.17). OPA decreased gradually in the latanoprost group over the follow-up period, while OPA in the tafluprost group decreased rapidly after 1 week of treatment. Therefore, significant differences appeared in OPA between the 2 groups at 1 week and 3 months (P = 0.003 and P = 0.047, respectively).
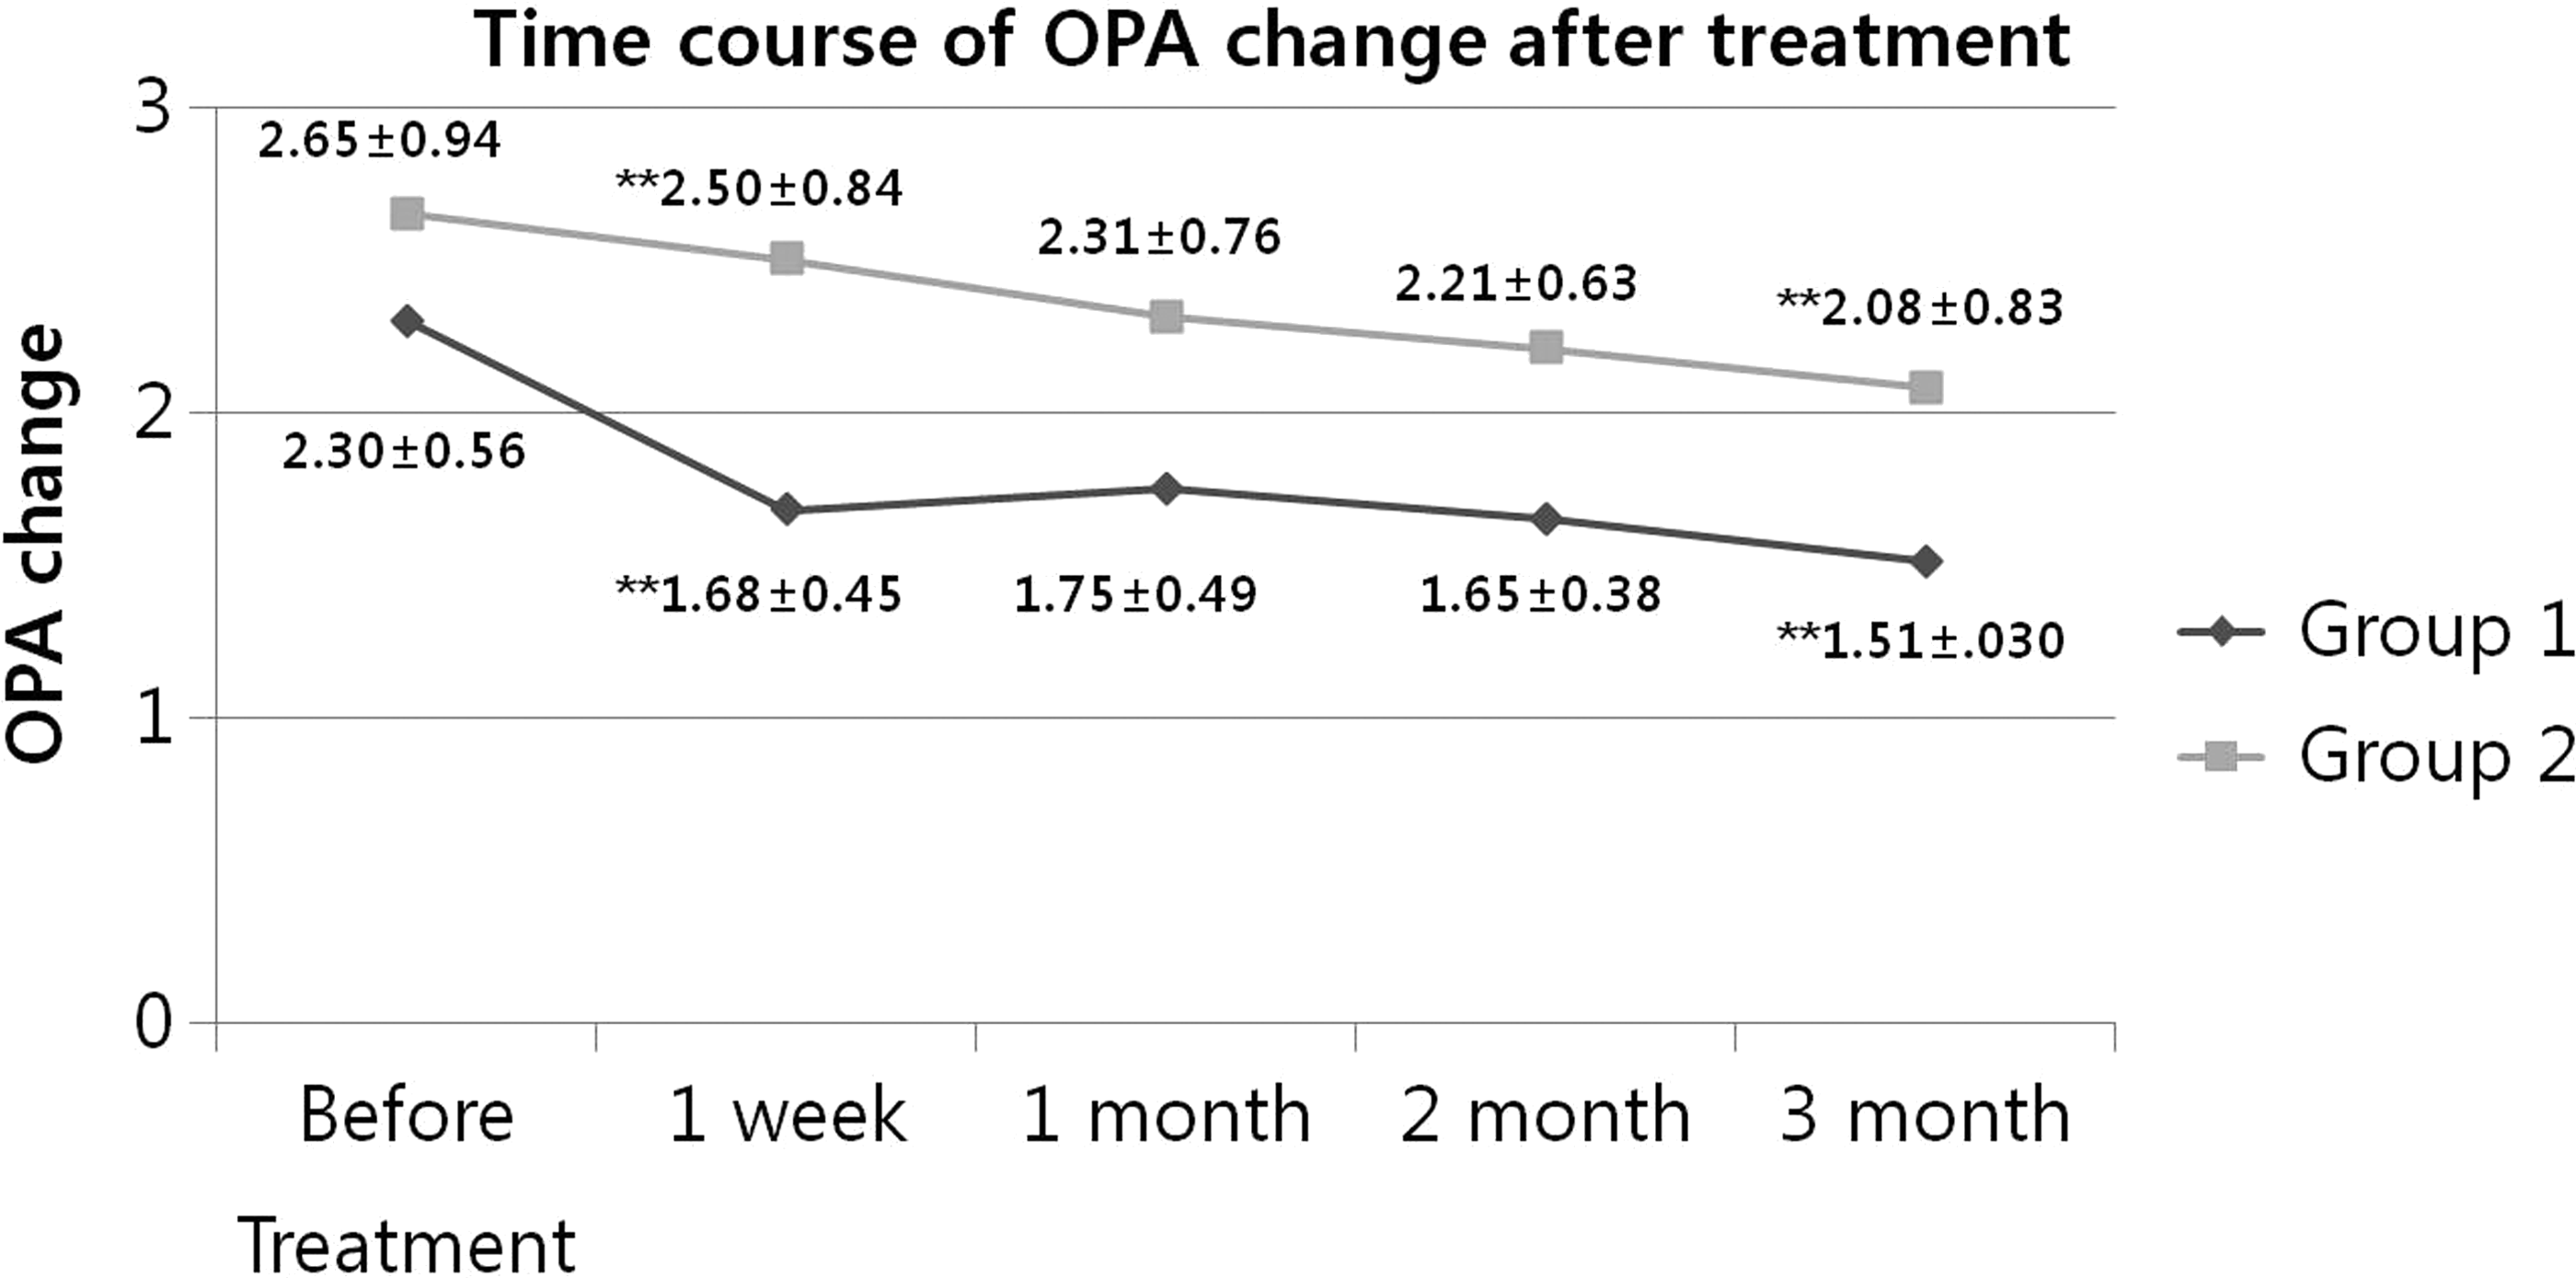
Ocular pulse amplitude (OPA) measurements (mean ± SD) in the 2 treatment groups before and after administration of tafluprost and latanoprost. **P < 0.05, compared with 2 groups. Group 1 = Initiation of glaucoma treatment with tafluprost. Group 2 = Initiation of glaucoma treatment with latanoprost.
Figure 3 compares cOPA, representing the value of OPA excluding the influence of IOP, between the 2 groups: cOPA = OPA–(ΔIOP × 0.12)(18,19). At 3 months, the mean decrease in cOPA from baseline in the tafluprost group was −1.27 mmHg (55.2%), whereas it was −0.84 mmHg (31.7%) in the latanoprost group. This difference in cOPA between the 2 groups was statistically significant (P < 0.001). A stronger effect with regard to reduced cOPA during the follow-up period was observed in the tafluprost group compared with the latanoprost group. The difference between the 2 groups was significant at 3 months (P < 0.001) and was of borderline significance at the other time points (P = 0.06, P = 0.08, P = 0.06).
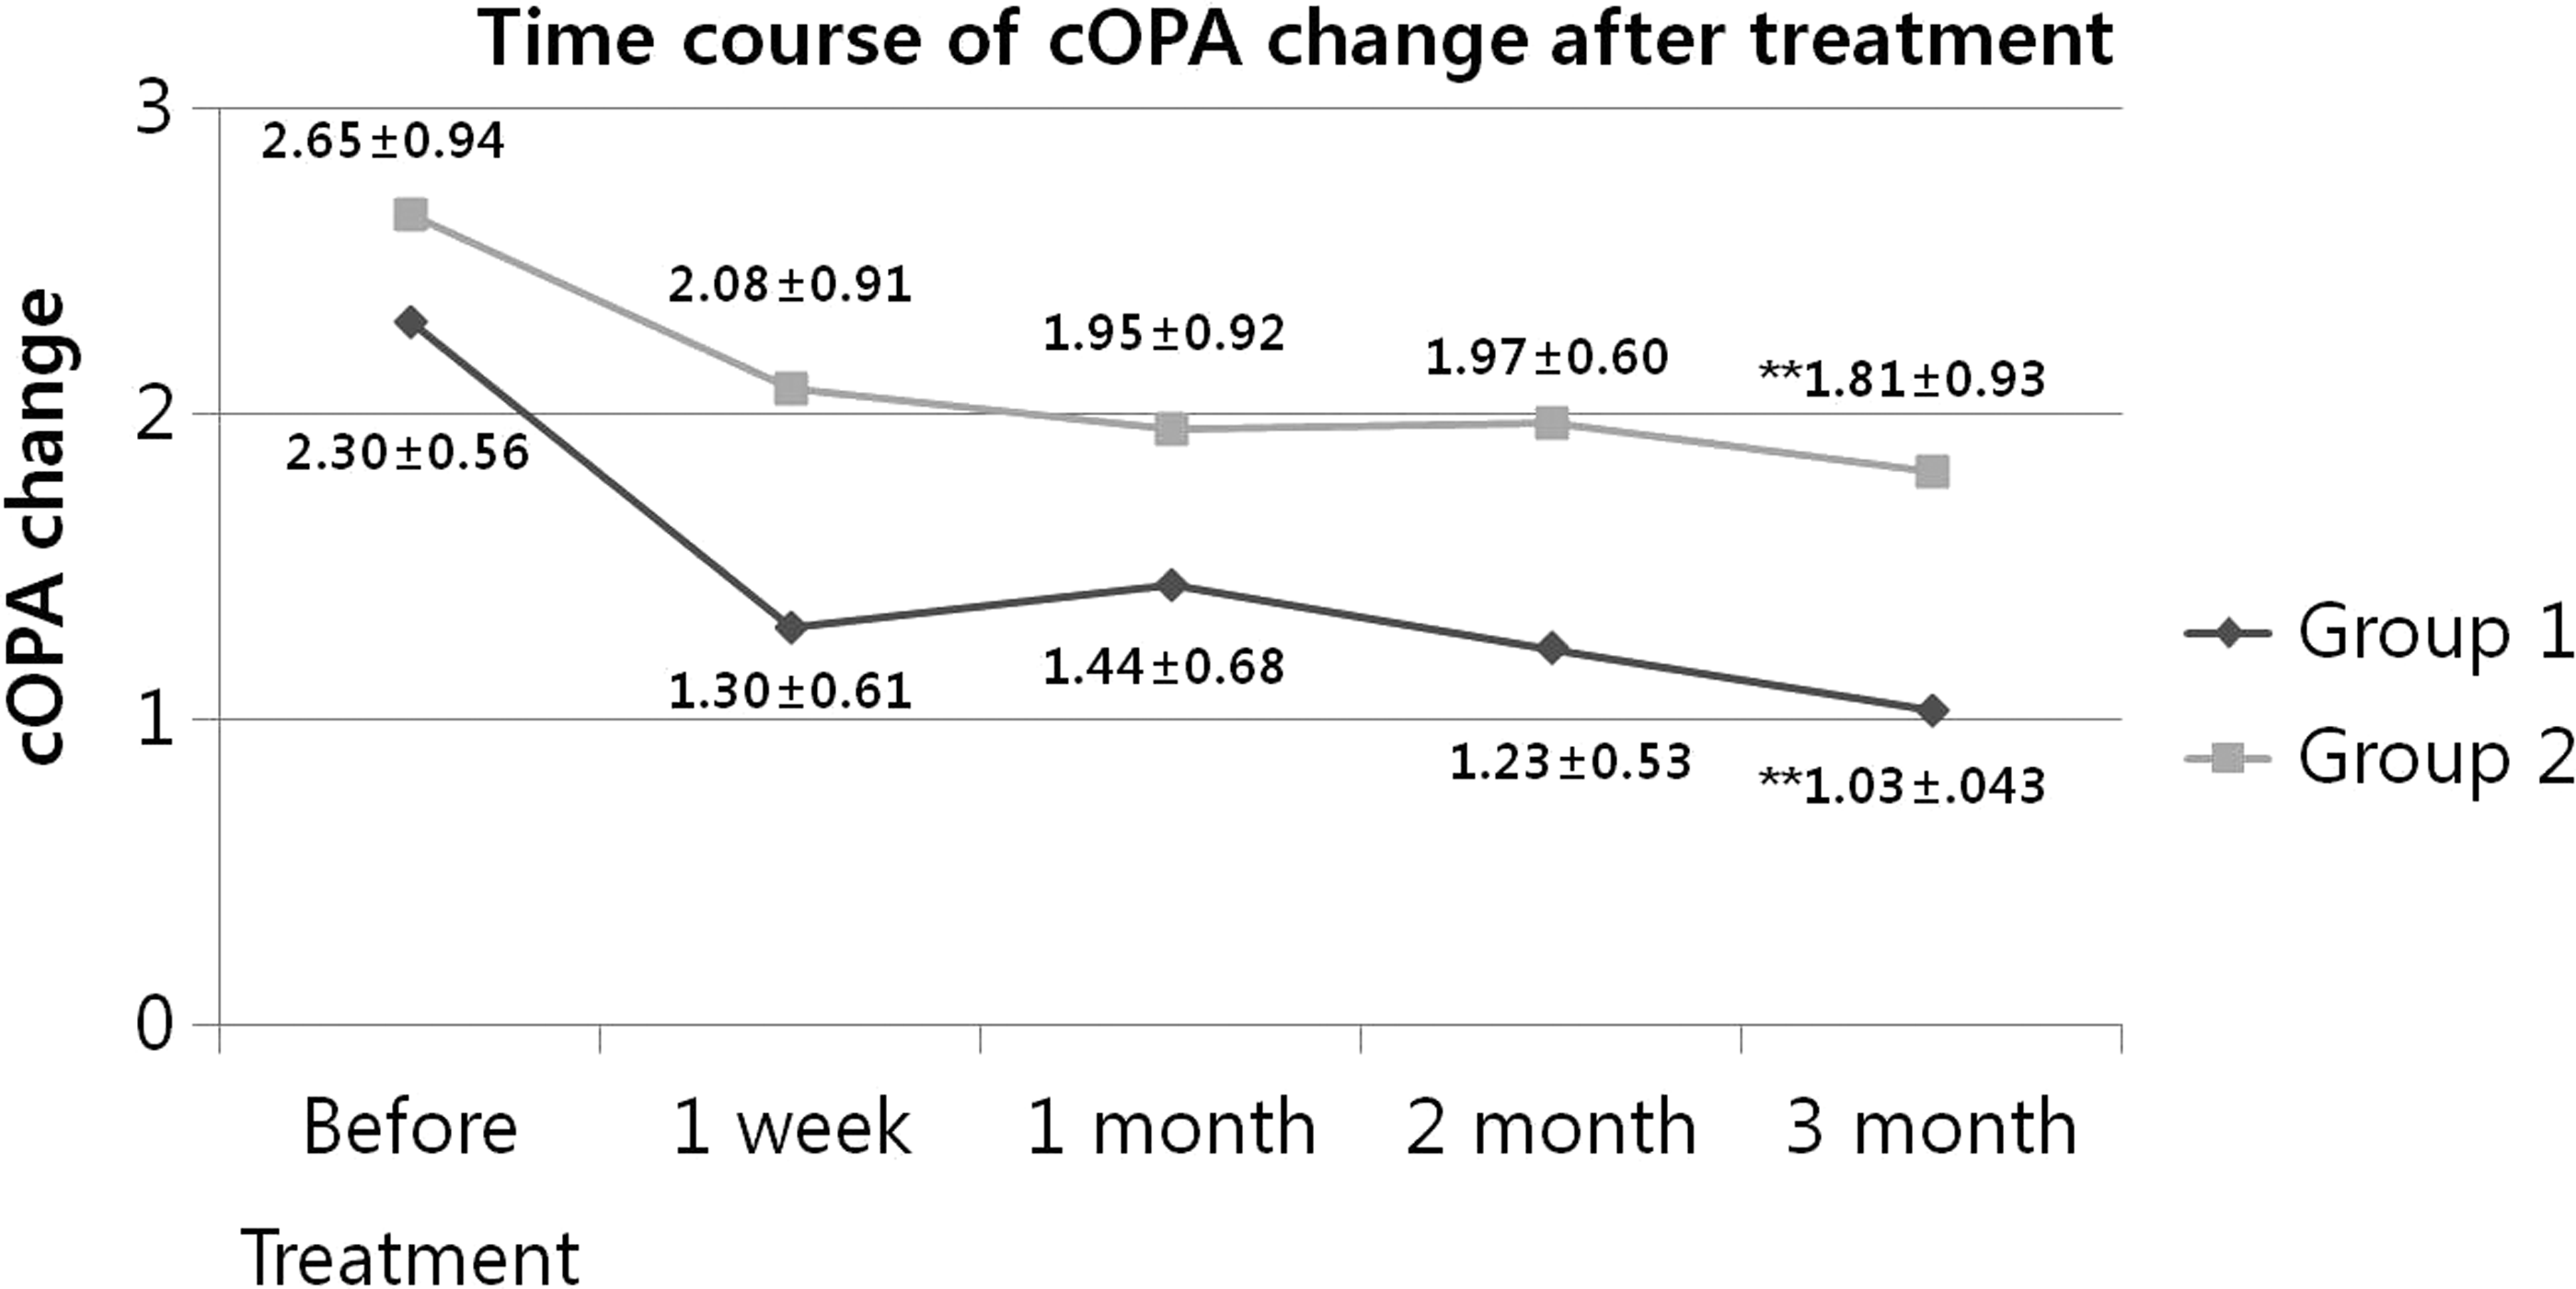
Corrected OPA measurements (mean ± SD) in the 2 treatment groups before and after administration of tafluprost and latanoprost. **P < 0.05, compared with 2 groups. Group 1 = Initiation of glaucoma treatment with tafluprost. Group 2 = Initiation of glaucoma treatment with latanoprost.
Discussion
The pathophysiology of glaucoma has been studied since the 19th century. At present, IOP is considered the main risk factor for the progression of glaucoma neuropathy, although some other systemic risk factors have been associated with increased prevalence of glaucoma damage, including systemic hypotension with nocturnal pressure drops, vasospasm (cold hands and feet, Raynaud's phenomenon, migraine), low perfusion pressure, and cardiovascular diseases. 21 All currently available treatments target IOP reduction. Recently, researchers have investigated the role OPA plays in the progression of glaucoma, but the results have been inconclusive. Weizer et al. found a correlation between OPA and severity of glaucoma, and concluded that high OPA seems to be related to less severe glaucoma. 22 Schwenn et al. found that a low OPA was more likely to be present in NTG than in POAG, ocular hypertension, or normal eyes. 23 Kynigopoulos et al. found a relationship between low OPA and the presence of functional and structural damage in POAG. 24 However, changes in blood volume and ocular rigidity during systolic and diastolic phases cause IOP fluctuation, which is recorded as OPA. As a result, at the same measured IOP value, patients with higher OPA may have larger IOP fluctuations during measurement. Large IOP fluctuation is reportedly a risk factor for progression of glaucoma, and OPA is reported to be positively correlated with IOP.25–27 Patients with higher OPA may be assumed to have larger IOP fluctuations.
Fluorine has become a widespread and important drug component, and its introduction is expected to enhance the physicochemical properties and the adsorption, distribution, metabolism, and excretion of a given compound. 28 Among the PGF2α analogs, tafluprost has a unique chemical structure. It has long been believed that the 15-hydroxyl group is essential for the biological activities of prostaglandins, and indeed, latanoprost has a hydroxyl group at the carbon 15 position. 29 Tafluprost, the first PGF2α analog to defy this commonly held belief, has difluorine at the carbon 15 position. Hiroaki et al. reported that tafluprost exerted an inhibitory effect on the endothelin-1-induced impairment of optic nerve head blood flow, which was more prolonged than those of travoprost and latanoprost in rabbit eyes. 30 In the present study, we found significant reductions of IOP and OPA together in both tafluprost and latanoprost groups, and a greater effect was observed in the tafluprost group. Therefore, tafluprost can be considered for patients with progression of glaucomatous changes and high OPA, despite well-controlled IOP.
Some studies have demonstrated that decreased OPA is related to the development or the severity of glaucoma. Vulsteke et al. reported that low OPA was correlated with moderate-to-severe glaucomatous visual field loss, and Stalmans et al. reported that OPA was reduced in NTG and POAG patients compared with healthy controls.31,32 In addition, Weizer et al. reported that decreased OPA is correlated with an increased cup/disc ratio. 22 However, all of these studies included older subjects with advanced glaucoma and patients who were receiving medical treatment or intraocular surgery, including glaucoma surgery. Therefore, the cause of this reduction in OPA in these patients is thought not to be atherosclerosis, but rather systemic, and thus, partially primary, vascular dysregulation leading to both low perfusion pressure and insufficient autoregulation. This, in turn, may lead to unstable ocular perfusion and consequently to ischemia and reperfusion damage. Von Schulthess et al. reported that OPA decreased initially after successful trabeculectomy in POAG and pseudoexfoliation glaucoma patients followed up for 3 months postoperatively; so, having had previous glaucoma surgery may have affected the results among these patients. 33 In contrast, the present study had a younger mean patient age and included those newly diagnosed with mild glaucoma.
Our study had some limitations. The major limitations were its small sample size and short-term follow-up period. More clinical research will be required to evaluate long-term results, with a larger study population and long-term follow-up. Another limitation was that we did not determine the effects of OPA reduction on functional and structural changes with progression of glaucoma.
In conclusion, tafluprost and latanoprost used to treat glaucoma have strong OPA-lowering effects as well as IOP-lowering effects. Moreover, tafluprost has a stronger effect than latanoprost. Therefore, it can be used for patients in need of IOP reduction and at risk of glaucoma progression.
Footnotes
Acknowledgment
The authors have no vested interest of any kind in the materials or services referred to in this article. This work was supported by the Soonchunhyang University Research Fund.
Author Disclosure Statement
No competing financial interests exist.