
Abstract
Abstract
Purpose:
The application of induced pluripotent stem cell-derived retinal pigmented epithelium (iPSC-RPE) in patients with retinal degenerative disease is making headway toward the clinic, with clinical trials already underway. Multiple groups have developed methods for RPE differentiation from pluripotent cells, but previous studies have shown variability in iPSC propensity to differentiate into RPE.
Methods:
This study provides a comparison between 2 different methods for RPE differentiation: (1) a commonly used spontaneous continuously adherent culture (SCAC) protocol and (2) a more rapid, directed differentiation using growth factors. Integration-free iPSC lines were differentiated to RPE, which were characterized with respect to global gene expression, expression of RPE markers, and cellular function.
Results:
We found that all 5 iPSC lines (iPSC-1, iPSC-2, iPSC-3, iPSC-4, and iPSC-12) generated RPE using the directed differentiation protocol; however, 2 of the 5 iPSC lines (iPSC-4 and iPSC-12) did not yield RPE using the SCAC method. Both methods can yield bona fide RPE that expresses signature RPE genes and carry out RPE functions, and are similar, but not identical to fetal RPE. No differences between methods were detected in transcript levels, protein localization, or functional analyses between iPSC-1-RPE, iPSC-2-RPE, and iPSC-3-RPE. Directed iPSC-3-RPE showed enhanced transcript levels of RPE65 compared to directed iPSC-2-RPE and increased BEST1 expression and pigment epithelium-derived factor (PEDF) secretion compared to directed iPSC-1-RPE. In addition, SCAC iPSC-3-RPE secreted more PEDF than SCAC iPSC-1-RPE.
Conclusions:
The directed protocol is a more reliable method for differentiating RPE from various pluripotent sources and some iPSC lines are more amenable to RPE differentiation.
Introduction
I
The first iPSC clinical trial is underway in Japan to treat wet age-related macular degeneration (AMD) after several groups showed an improvement in vision following cellular injection in rat models.8–11 AMD affects 7.2 million people in the United States and is the leading cause of blindness in the elderly population.12,13 There are 2 forms of the disease, wet, or exudative, and dry, or atrophic, AMD. Wet AMD is characterized by neovascularization within the retina, while dry AMD presents with drusen, which are lipid deposits of unknown origin. 14 Both forms are associated with death or dysfunction of the retinal pigmented epithelium (RPE), a monolayer of cells situated between the choroid and the neural retina. The RPE is responsible for maintaining the health of the photoreceptors; therefore, when the RPE becomes compromised, the photoreceptors begin to die resulting in a loss of vision. 15
As iPSC-RPE begin to be used in clinical trials, it is imperative that a more complete understanding of these cells is achieved to fully comprehend the variability known to exist between lines. 16 In addition, there are currently several methods for deriving RPE from hESCs and iPSCs; however, there needs to be more in-depth analysis of derivation methods for different lines of iPSCs.17,18 In this study, we provide a comparison of 3 iPSC-RPE lines and 2 differentiation protocols: a spontaneous continuously adherent culture (SCAC) differentiation method10,18–22 and a directed differentiation protocol.23,24 Although we began this study with 5 iPSC lines, 2 lines did not yield RPE from the SCAC method and therefore could not be analyzed.
Characterization of different lines and methods will contribute to establishing release assays for clinical production of cells. This will be important because many groups are planning to create human leukocyte antigen (HLA)-matched super banks of iPSCs to avoid the long derivation and testing time taken to create autologous patient-specific cells. 25 It is thought that HLA matching will dampen any immune response following transplantation. 26 Determining proper release criteria will expedite the efficiency of creating quality, transplant-ready, HLA-matched iPSC-RPE.
Methods
Cell Culture
Human pluripotent stem cell culture
Epstein–Barr Virus (EBV) vector-derived iPSC lines, DF4-3-7T, DF6-9-9T, DF19-9-11T,6,27 and 1 patient-specific iPSC line (iPSC-12) 28 were kindly donated from the James Thomson and David Gamm groups (WiCell Research Institute), and the MyCell iPSC line (no. 1013.201) was acquired from Cellular Dynamics International MyCell iPSC Services. The iPSC-12 line was derived from a patient with gyrate atrophy (GA) and carries a deleterious mutation in the ornithine aminotransferase (OAT) gene, as described in Howden et al. 29 In this study, the following nomenclature was used for 4 of the iPSC lines for the purposes of clarity: iPSC-1 (DF4-3-7T), iPSC-2 (DF19-9-11T), iPSC-3 (MyCell), and iPSC-4 (DF6-9-9T). iPSC-12 retained the original name. iPSC were generated from human fibroblasts (iPSC-1, iPSC-2, iPSC-4, iPSC-12) or T cells (iPSC-3) by transfection with oriP/EBNA1-containing vectors encoding 7 transcription factors (OCT4, SOX2, NANOG, LIN28, KLF4, c-Myc, SV40LT), as previously described.6,29
The hESC lines used for comparison were obtained from WiCell (H9s) and the University of California, San Francisco (UCSF4s; NIH registry No. 0044). All iPSC and hESC lines were maintained in a feeder-free system on Matrigel (BD Biosciences) in mTeSR1 media (Stem Cell Technologies). Cells were kept at 37°C 5% CO2 in normoxic conditions, and media were changed every other day.
RPE: SCAC differentiation method
Pluripotent stem cell lines were overgrown for 8–14 days, after which the mTeSR1 medium was changed to the xeno-free XVIVO-10 medium without basic fibroblast growth factor (bFGF; Lonza). Comparison of XVIVO-10 medium and DMEM+KOSR medium showed that the use of XVIVO-10 medium improved the yield of pigmented cells using the SCAC method. The XVIVO-10 medium was changed every other day for 90 days; pigmentation appeared ∼1 month after medium switch. Following 90 days in culture, nonpigmented cells were manually dissected away from RPE pigmented spots. Cells were washed with phosphate-buffered saline (PBS; Life Technologies), leaving only the pigmented patches adhering to the plate. Remaining pigmented cells were enzymatically digested using TrypLE Express (Life Technologies) for 5 min at 5% CO2 37°C. Cells were collected, diluted in 1:10 volumes of XVIVO-10 medium, triturated, and then spun at 1,000 rpm for 5 min. The resulting pellet was resuspended in the XVIVO-10 medium, strained through a 30 μM sieve, and seeded onto Matrigel-coated plates at 1.0 × 10⁵ cells/cm2 creating a homogenous population of enriched RPE cells. The XVIVO-10 medium was changed every 2–3 days, and cells were maintained at 5% CO2 37°C in normoxic conditions. After the RPE matured in culture for 30 days, cells were passaged using TrypLE Express and plated again at 1.0 × 10⁵ cells/cm2 on a Matrigel-coated surface in the XVIVO-10 medium, as described earlier. Cells were passaged using this method until passage 2 when they were cryopreserved generating intermediate cell banks (ICBs).
RPE: directed differentiation protocol
Pluripotent stem cells were directed to differentiate to RPE in 14 days as previously described.23,24 Briefly, iPSCs and hESCs were passaged with EDTA (Life Technologies) using the methods described by Beers et al. 30 and seeded onto Matrigel-coated 12-well plates in the DMEM/F12 medium containing 1× N2, 1× B27, and 1× NEAA (basal medium) (Life Technologies). From days 0–2 of differentiation, the basal medium contained 10 mM nicotinamide (NIC; Sigma-Aldrich), 50 ng/mL noggin, 10 ng/mL Dkk1, and 10 ng/mL IGF1 (R&D Systems, Inc.). From days 2–4, the basal medium contained 10 mM nicotinamide, 10 ng/mL noggin, 10 ng/mL Dkk1, 10 ng/mL IGF1, and 5 ng/mL bFGF. From days 4–6, 10 ng/mL Dkk1, 10 ng/mL IGF1, and 100 ng/mL Activin A (Peprotech) were added to the basal medium. From days 6–8, the basal medium contained 100 ng/mL Activin A and 10 μM SU5402 (Santa Cruz Biotechnology, Inc.). From days 8–14, the basal medium contained 100 ng/mL Activin A, 10 μM SU5402, and 3 μM CHIR99021 (Stemgent).
On day 14, cells lacking RPE morphology were manually scraped away using a pipette tip, leaving only RPE-like cells in the culture dish. The adherent RPE-like cells were enzymatically digested using TrypLE Express for 5 min at 5% CO2 37°C. Cells were collected, strained, and seeded onto Matrigel-coated plates in the XVIVO-10 medium at 1.0 × 10⁵ cells/cm2, using the methods described earlier for the SCAC method. The XVIVO-10 medium was changed every 2–3 days, and cells were maintained at 5% CO2 37°C in normoxic conditions. RPE cells were expanded by passaging every 30 days (as described above) and cryopreserved at passage 2 to generate ICBs.
Creation of ICBs
Cells were frozen down before reaching confluence, 2–4 days after plating, at passage 2. Cells were lifted using TrypLE Express for 5 min at 5% CO2 37°C, gently scraped, triturated, and diluted in 1:10 volumes of XVIVO-10 medium. Cells were spun down at 1,000 rpm for 5 min and then resuspended in the CryoStor CS10 freezing medium (Stem Cell Technologies) at 3–6 × 10⁶ cells/mL. One-milliliter aliquots were stored in cryovials, put into a slow rate freezing device, and stored in the −80°C freezer for 24 h, following which cells were moved to liquid nitrogen for long-term storage. ICBs were created of each viable iPSC-RPE line (reference Table 1 for nonviable iPSC-RPE). The hESC-RPE lines used for comparison were passaged and handled using the same methods as the iPSC-RPE. All cells used in analysis were thawed cells from ICBs, plated at passage 3, and seeded at 1.5 × 10⁶ cells/cm2. ICBs were created using at least 3 separate enrichments and expansions for each iPSC-RPE line. n = 3 for all experiments, represents data from these separate enrichments.
(+++) represents high RPE yield, (++) and (+) represent moderate to low RPE yield, and (−) indicates insufficient quantities of RPE were derived for characterization. iPSC, induced pluripotent stem cell; RPE, retinal pigmented epithelium; SCAC, spontaneous continuously adherent culture.
Real-time quantitative polymerase chain reaction
iPSC-RPE and hESC-RPE ICB cells and human fetal RPE [fRPE, kindly provided by Lincoln Johnson (Center for the Study of Macular Degeneration, UCSB) and Dean Bok (Jules Stein Eye Institute, UCLA)] were thawed and plated on Matrigel and cultured for 30 days. Fetal RPE were cultured using the medium and methods of Maminishkis et al. 31 Cell lysates were collected using RLT Plus buffer with 1% β-mercaptoethanol, and total RNA was purified using Qiagen's RNeasy Plus Kit (Qiagen). Photomicrographs were taken at day 30. The iScrpit cDNA Synthesis Kit (Bio-Rad) was used to create 1 μg of cDNA. Expression of genes of interest was then evaluated in triplicate using the same TaqMan gene expression assays as cited in Croze et al. 32 Specific genes of interest (markers of RPE and non-RPE), tissue-specific expression (of non-RPE markers), and TaqMan assay ID information can be found in Supplementary Table S1; Supplementary Data are available online at www.liebertpub.com/jop. The relative level of expression for each gene was determined by normalizing to the geometric mean of the housekeeping gene set using CFX Manager (Bio-Rad) and Excel software.
Next-generation sequencing (RNA-seq) and bioinformatics
Directed- and SCAC-derived iPSC-3-RPE and fRPE were plated and cultured as described earlier. On day 30, total RNA was purified as described for real-time quantitative polymerase chain reaction (qRT-PCR). RNA quality control and sequencing were performed by the Biological NanoStructures Lab at the California NanoSystems Institute at UC Santa Barbara. Quality of the RNA was verified using a TapeStation Instrument (Agilent Technologies, Inc.), and all samples showed RNA Integrity Number (RIN) ≥9.4. RNA concentrations were determined using the Qubit 2.0 Fluorometer (Invitrogen), and the TruSeq Stranded mRNA kit (Illumina) was used for library preparation of 0.4–1.2 μg RNA/sample. Pooled libraries were sequenced using a 1 × 75 bp single read, HIGH output run on an Illumina NextSeq 500 desktop sequencer.
Read alignment and transcript assembly and differential expression (DE) analysis were performed using the TopHat Alignment and Cufflinks Assembly and DE applications in the Illumina BaseSpace (https://basespace.illumina.com/home/index), respectively.33,34 Differentially expressed genes were filtered (fold change ≥ 2; q-value ≤ 0.05) using the DE Gene Browser within the Cufflinks app. To determine functional sets of genes differentially expressed between RPE samples, Kyoto Encyclopedia of Genes and Genomes (KEGG) pathway-based enrichment analysis was performed using WebGestalt (http://bioinfo.vanderbilt.edu/webgestalt/),35,36 with the human genome used as a reference set. P-values for significantly enriched terms were determined using a hypergeometric test and adjusted using the Benjamini–Hochberg procedure (P < 0.05).
Immunocytochemistry
Passage 3 iPSC-RPE and hESC-RPE were seeded onto Matrigel-coated 8-chambered slides. On day 30 postseeding, the cells were washed with PBS and fixed with 4% paraformaldehyde in 0.1 M sodium cacodylate buffer (pH 7.4) for 15 min at 4°C. The fixed cells were then washed with PBS, blocked, and permeabilized with PBS containing 5% bovine serum albumin (BSA) and 0.2% Triton X-100 for 1 h at 4°C. The cells were then probed with primary antibodies against Na+/K+ ATPase, beta 1 (1:100; Abcam), MITF (1:100; Abcam), orthodenticle homeobox 2 (OTX2) (1:4000; Millipore), RPE65 (1:100; Abcam), PMEL (1:100; Dako), zona occludens 1 (ZO-1) (1:100; Life Technologies), or TRA1-81 (1:100; Millipore) in PBS with 5% BSA overnight at 4°C. Following 3 washes to remove the primary antibodies, cells were incubated with the appropriate Alexa Fluor-conjugated secondary antibody (1:300; Life Technologies) for 1 h at 4°C. Labeled cells were then washed with PBS and nuclei were counterstained with Hoechst. Cells were imaged using either an Olympus BX51 upright microscope or an Olympus FluoView 1000 Spectral Confocal microscope.
Rod outer segment phagocytosis assay
iPSC-RPE, hESC-RPE, and fRPE were cultured using the medium and methods of Maminishkis et al. 31 Human umbilical vein endothelial cells (HUVECs; ATCC) were grown in the endothelial cell growth medium with supplement mix (EGM; PromoCell). Experimental quadruplicates and biological triplicates for each cell line were plated onto 0.1% gelatin-coated wells and cultured for 30 days. The rod outer segment (ROS) phagocytosis assays were performed according to the methods of Croze et al. 32 One epifluorescent image was taken of each well, in quadruplicate, for each condition, for each line. Images were taken at a low objective magnification focused on the center of the well, representing internalized fluorescein isothiocyanate (FITC)-labeled ROS (external and bound ROS were quenched using Trypan blue). Fluorescent intensity was measured as integrated pixel density with a rolling ball radius of 50 after the subtraction of background signal for each image using Fiji software. The fRPE cells served as positive controls and the HUVEC line was used as a negative control. All experiments were normalized to a single fRPE experimental data set. The anti-αVβ5 condition had significantly lower internalization than ROS and ROS + IgG in every cell line, except for the negative control HUVECs.
Pigment epithelium-derived factor enzyme-linked immunosorbent assay
Thawed ICB iPSC-RPE, hESC-RPE, and fRPE were grown on gelatin-coated wells in the medium described in Maminishkis et al., plus 0.5× Normocin (InvivoGen). 31 On day 30, media were collected following a 24-h exposure to the cells. The amount of human pigment epithelium-derived factor (PEDF) was determined by ELISA according to the manufacturer's instructions (BioProducts MD, LLC.). The plate growth area and media volume were used when calculating PEDF levels as expressed by ng/mm2.
Statistical analyses
Mann–Whitney analyses were run between differentiation methods within the same iPSC-RPE line. Kruskal–Wallis, with Dunn's multiple comparison post hoc tests, was run to compare between lines within the same differentiation method. Significance was claimed when P < 0.05. Each data set represents 3 enrichments derived and examined for each pluripotent line and method, n = 3. Error bars represent standard error of the mean ( ± SEM). Internal triplicates were also run within individual enrichments for qRT-PCR and ELISA and internal quadruplicates for the ROS phagocytosis analysis. ICC images are representative images taken from one enrichment derivation per line and method.
Results
RPE generation compared between SCAC and directed differentiation methods
Comparison between differentiation methods
Five iPSC lines derived without vector integration (iPSC-1, iPSC-2, iPSC-3, iPSC-4, iPSC-12) were subjected to either the directed or SCAC differentiation methods, and cryopreserved as iPSC-RPE in ICBs at passage 2 (Fig. 1A); thawed RPE cells were expanded to passage 3 following cryopreservation. Using the more rapid, directed differentiation protocol yields RPE in roughly half the time of the SCAC method. Whereas the directed method allowed expansion of all 5 original iPSC-RPE lines tested in sufficient amounts for banking and characterization, 2 lines (iPSC-4 and iPSC-12) did not generate RPE using the SCAC differentiation method (Table 1).
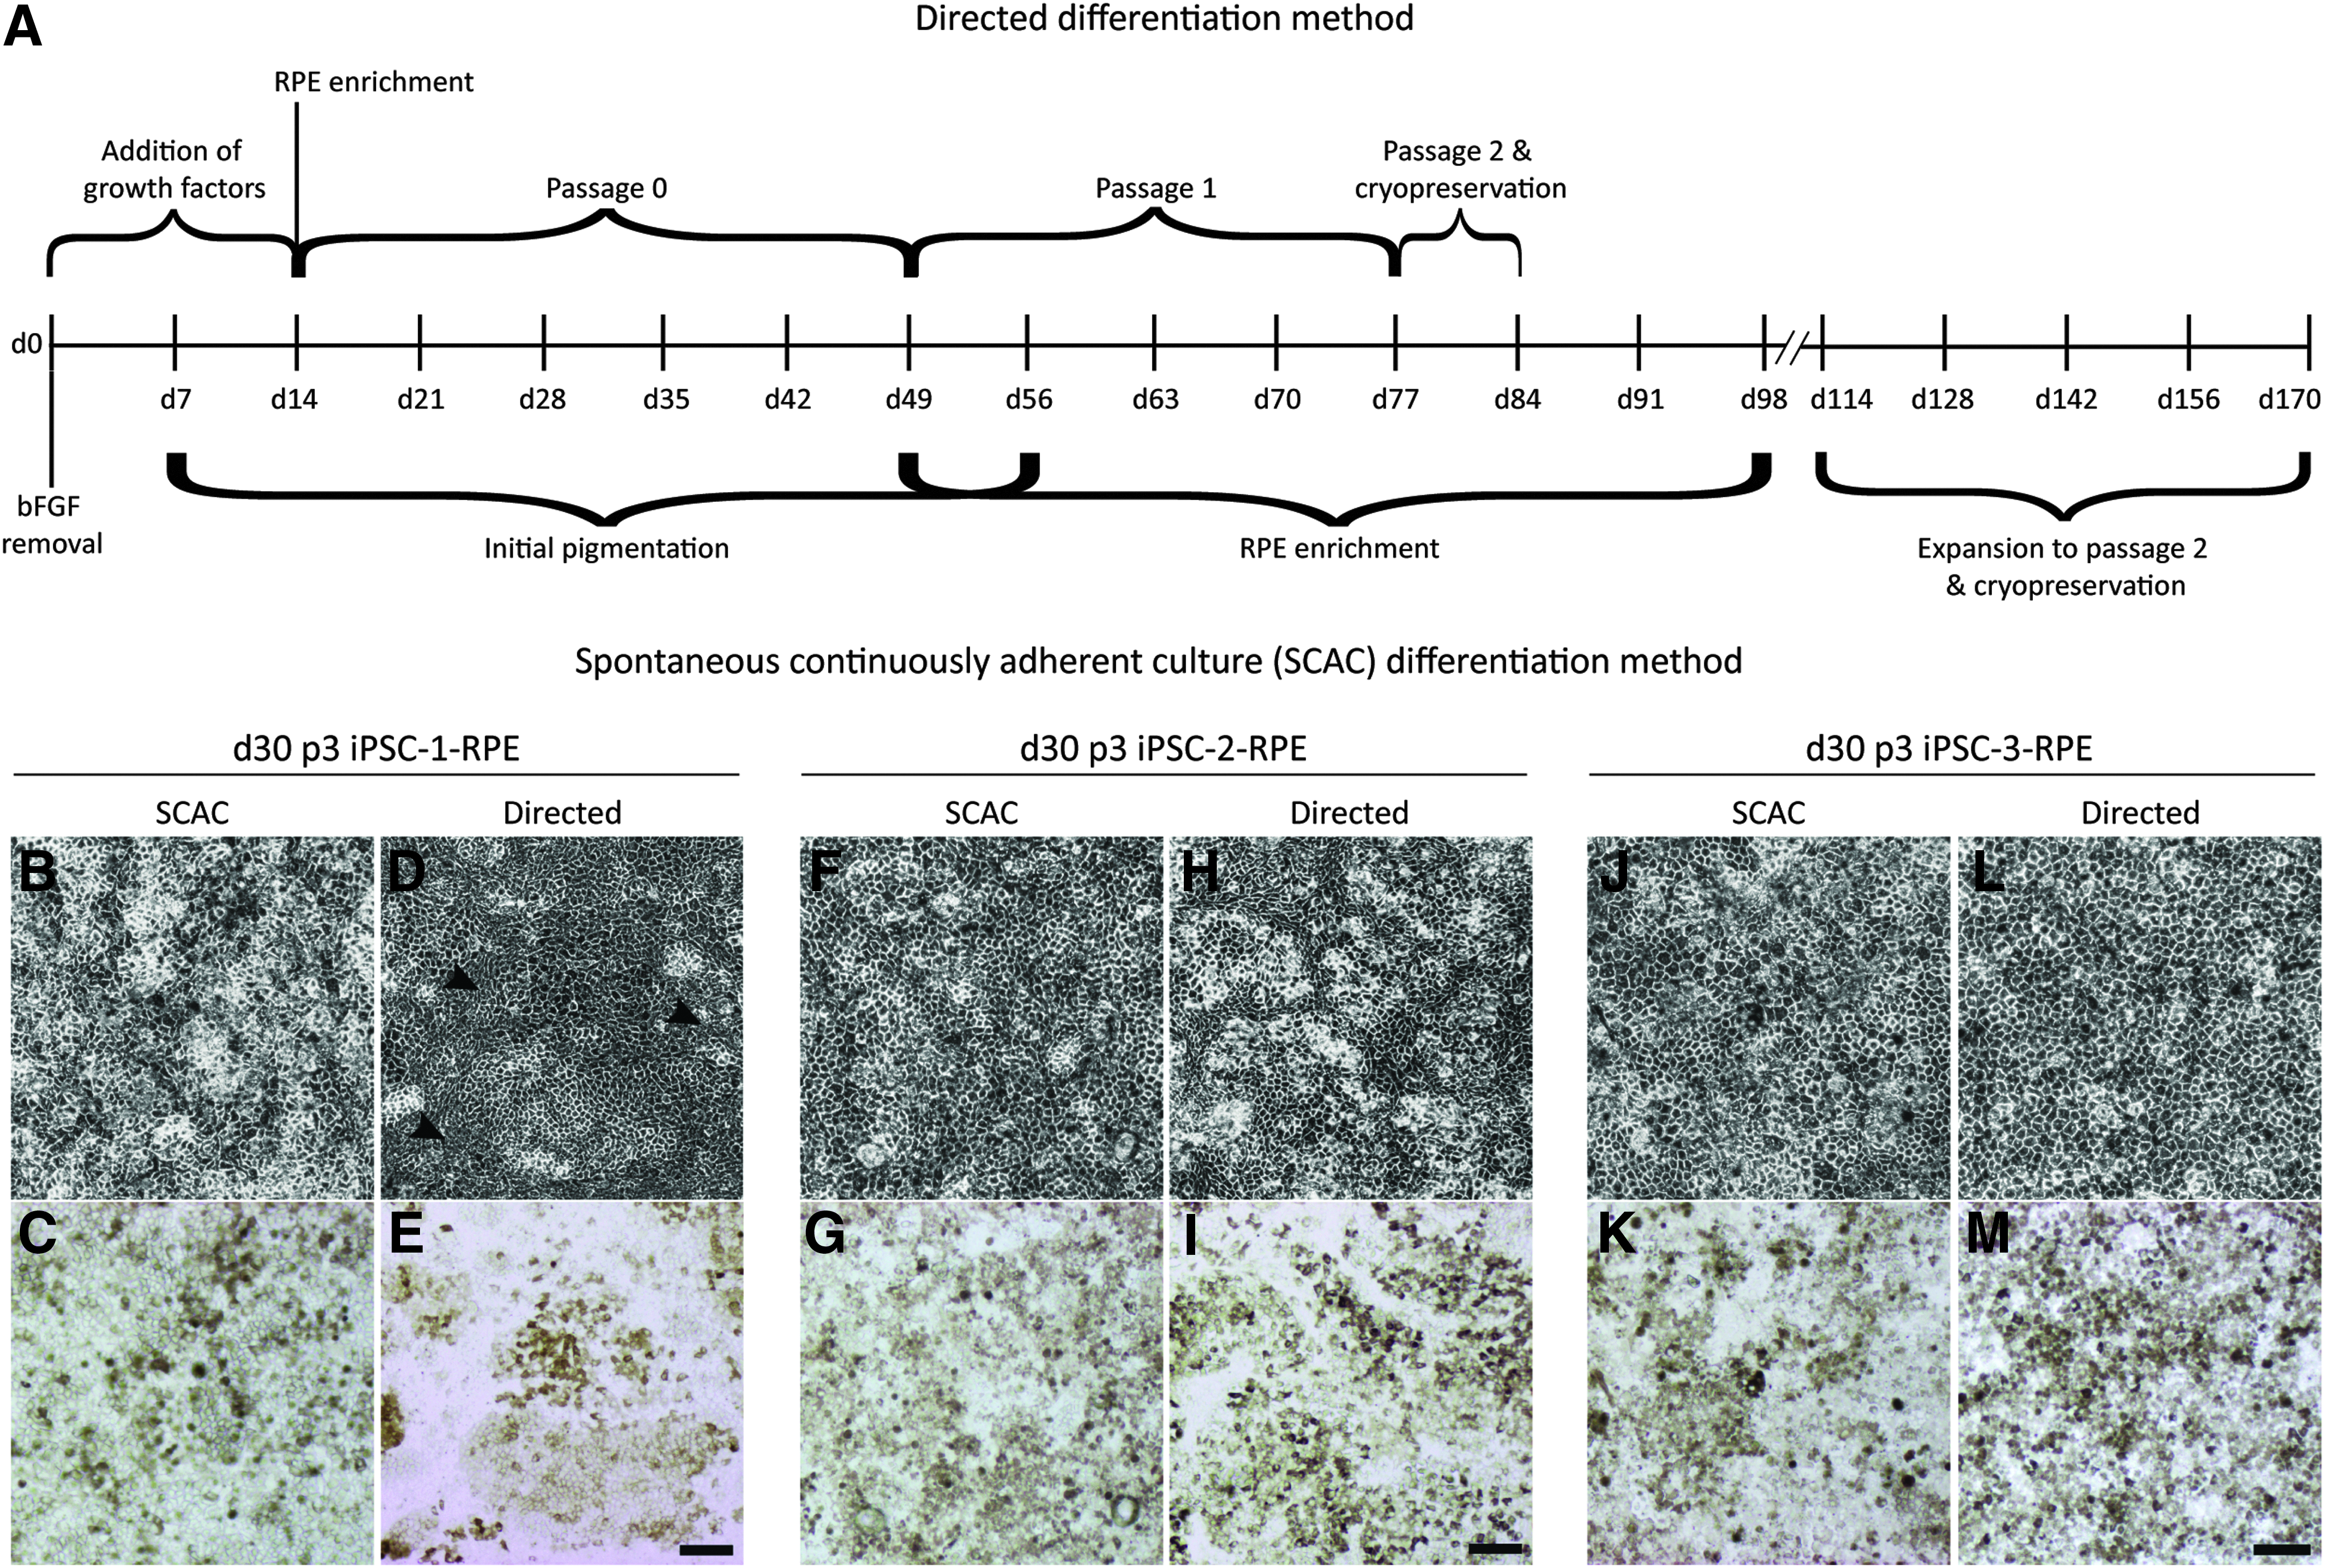
Timeline of differentiation methods and gross morphology of passage 3 iPSC-RPE on day 30.
Comparison between iPSC-RPE lines
We went on to compare the RPE from the 3 iPSC lines (iPSC-1, iPSC-2, iPSC-3) that generated cells using both the differentiation methods. Three random images were taken per well of each passage 3, day 30 culture and visually assessed for areas of small compact “cobblestone” morphology and clusters of cells lacking phase-bright tight junction borders. The directed iPSC-2- and iPSC-3-RPE and all SCAC-derived iPSC-RPE yielded pigmented cells with the expected morphology (Fig. 1B, C, F–M). In contrast, the directed iPSC-1-RPE yielded patches of cells lacking phase-bright tight junctions (Fig. 1D, arrowheads) and showed a visible reduction in pigmentation (Fig. 1E).
Gene expression profiles between RPE lines and iPSC-RPE derivation methods
RNA sequencing
To further investigate differences between directed- and SCAC-derived RPE, gene expression profiles were compared to fRPE through RNA-seq. Clustering analysis showed that the directed- and SCAC-derived iPSC-3-RPE was generally similar to fRPE, but more similar to each other than to fRPE (Supplementary Fig. S1). Parameters were applied to filter the total number of differentially expressed (DE) genes found in each comparison group, yielding 143 DE genes between directed- and SCAC-derived RPE, 1,217 DE genes between SCAC-derived RPE and fRPE, and 1,367 DE genes between directed-derived RPE and fRPE (Table 2). A total of 23,609 genes were detected, and hence, the DE genes are 0.6%, 5.2%, and 5.7% of the total genes, respectively.
n = 3.
DE, differentially expressed; dir, directed differentiation; fRPE, human fetal retinal pigmented epithelium; iPSC, induced pluripotent stem cell; sp, spontaneous differentiation.
To more closely examine functional sets of genes that differed between RPE, a pathway-based approach was implemented using KEGG pathway enrichment analysis. We first compared iPSC-3-RPE (differentiated by both methods) to the fRPE control; a summary of these results can be found in Table 3. The iPSC-3-RPE showed an overall downregulation of genes in the TGFβ, Wnt, and JNK/p38 signaling pathways, however, a group of genes associated with the MAPK/ERK pathway was found to be upregulated. Activated MAPK/ERK signaling has been linked to RPE cell proliferation, 37 which corroborates the notable upregulation of cell cycle markers in iPSC-3-RPE. Furthermore, there was significant downregulation of RPE-specific genes involved in retinol metabolism (RPE65 and LRAT), components of tight junctions (claudins), and integrin receptor subunits in iPSC-3-RPE, indicating a potential lack of maturity in these cells.
N/A indicates no significant change compared to control. n = 3.
ECM, extracellular matrix; fRPE, human fetal retinal pigmented epithelium; iPSC, induced pluripotent stem cell; KEGG, Kyoto Encyclopedia of Genes and Genomes; MAPK, mitogen-activated protein kinase; SCAC, spontaneous continuously adherent culture; TGFβ, transforming growth factor beta.
It should be noted that with the exception of the integrin α1 and β7 subunits, fold changes were similar between directed- and SCAC-derived iPSC-3-RPE. The iPSC-3-RPE also expressed lower levels of complement-related genes (C3 and CFB). In addition, these cells may produce different extracellular matrix (ECM) components than fRPE as shown by the DE of collagen and laminin genes. Interestingly, we found significant upregulation of T-cell-related genes (iPSC-3 were reprogrammed from T cells) only in SCAC-derived iPSC-RPE, which may indicate that residual somatic lineage markers are suppressed when more directed differentiation methods are used; however, this needs further testing.
Next, we used the same pathway-based method to analyze DE genes in iPSC-3-RPE derived by directed or SCAC methods, a summary of which can be found in Table 4. Of note, all enriched genes were upregulated in SCAC-derived iPSC-3-RPE. This analysis revealed upregulation of genes involved in calcium signaling and multiple metabolic pathways, including several genes for lipases and oxidases, among others. Interestingly, a gene (LIPC) with a known, but not completely understood,38–41 association with AMD was upregulated in SCAC iPSC-3-RPE.
n = 3.
FPKM, fragments per kilobase of transcript per million mapped reads; iPSC, induced pluripotent stem cell; KEGG, Kyoto Encyclopedia of Genes and Genomes; RPE, retinal pigmented epithelium; SCAC, spontaneous continuously adherent culture.
qRT-PCR: comparison between differentiation methods
To compare cells derived from all 3 iPSC lines, qRT-PCR was performed to validate RPE (Fig. 2A–G) and non-RPE transcript expression (Supplementary Fig. S2A, B), using fRPE as a positive control. No statistical differences were found between methods, within each line. The directed method showed decreased levels of mature RPE markers, RPE65 (Fig. 2A) and BEST1 (Fig. 2B), compared to the SCAC method within each line; however, these differences did not reach statistical significance.
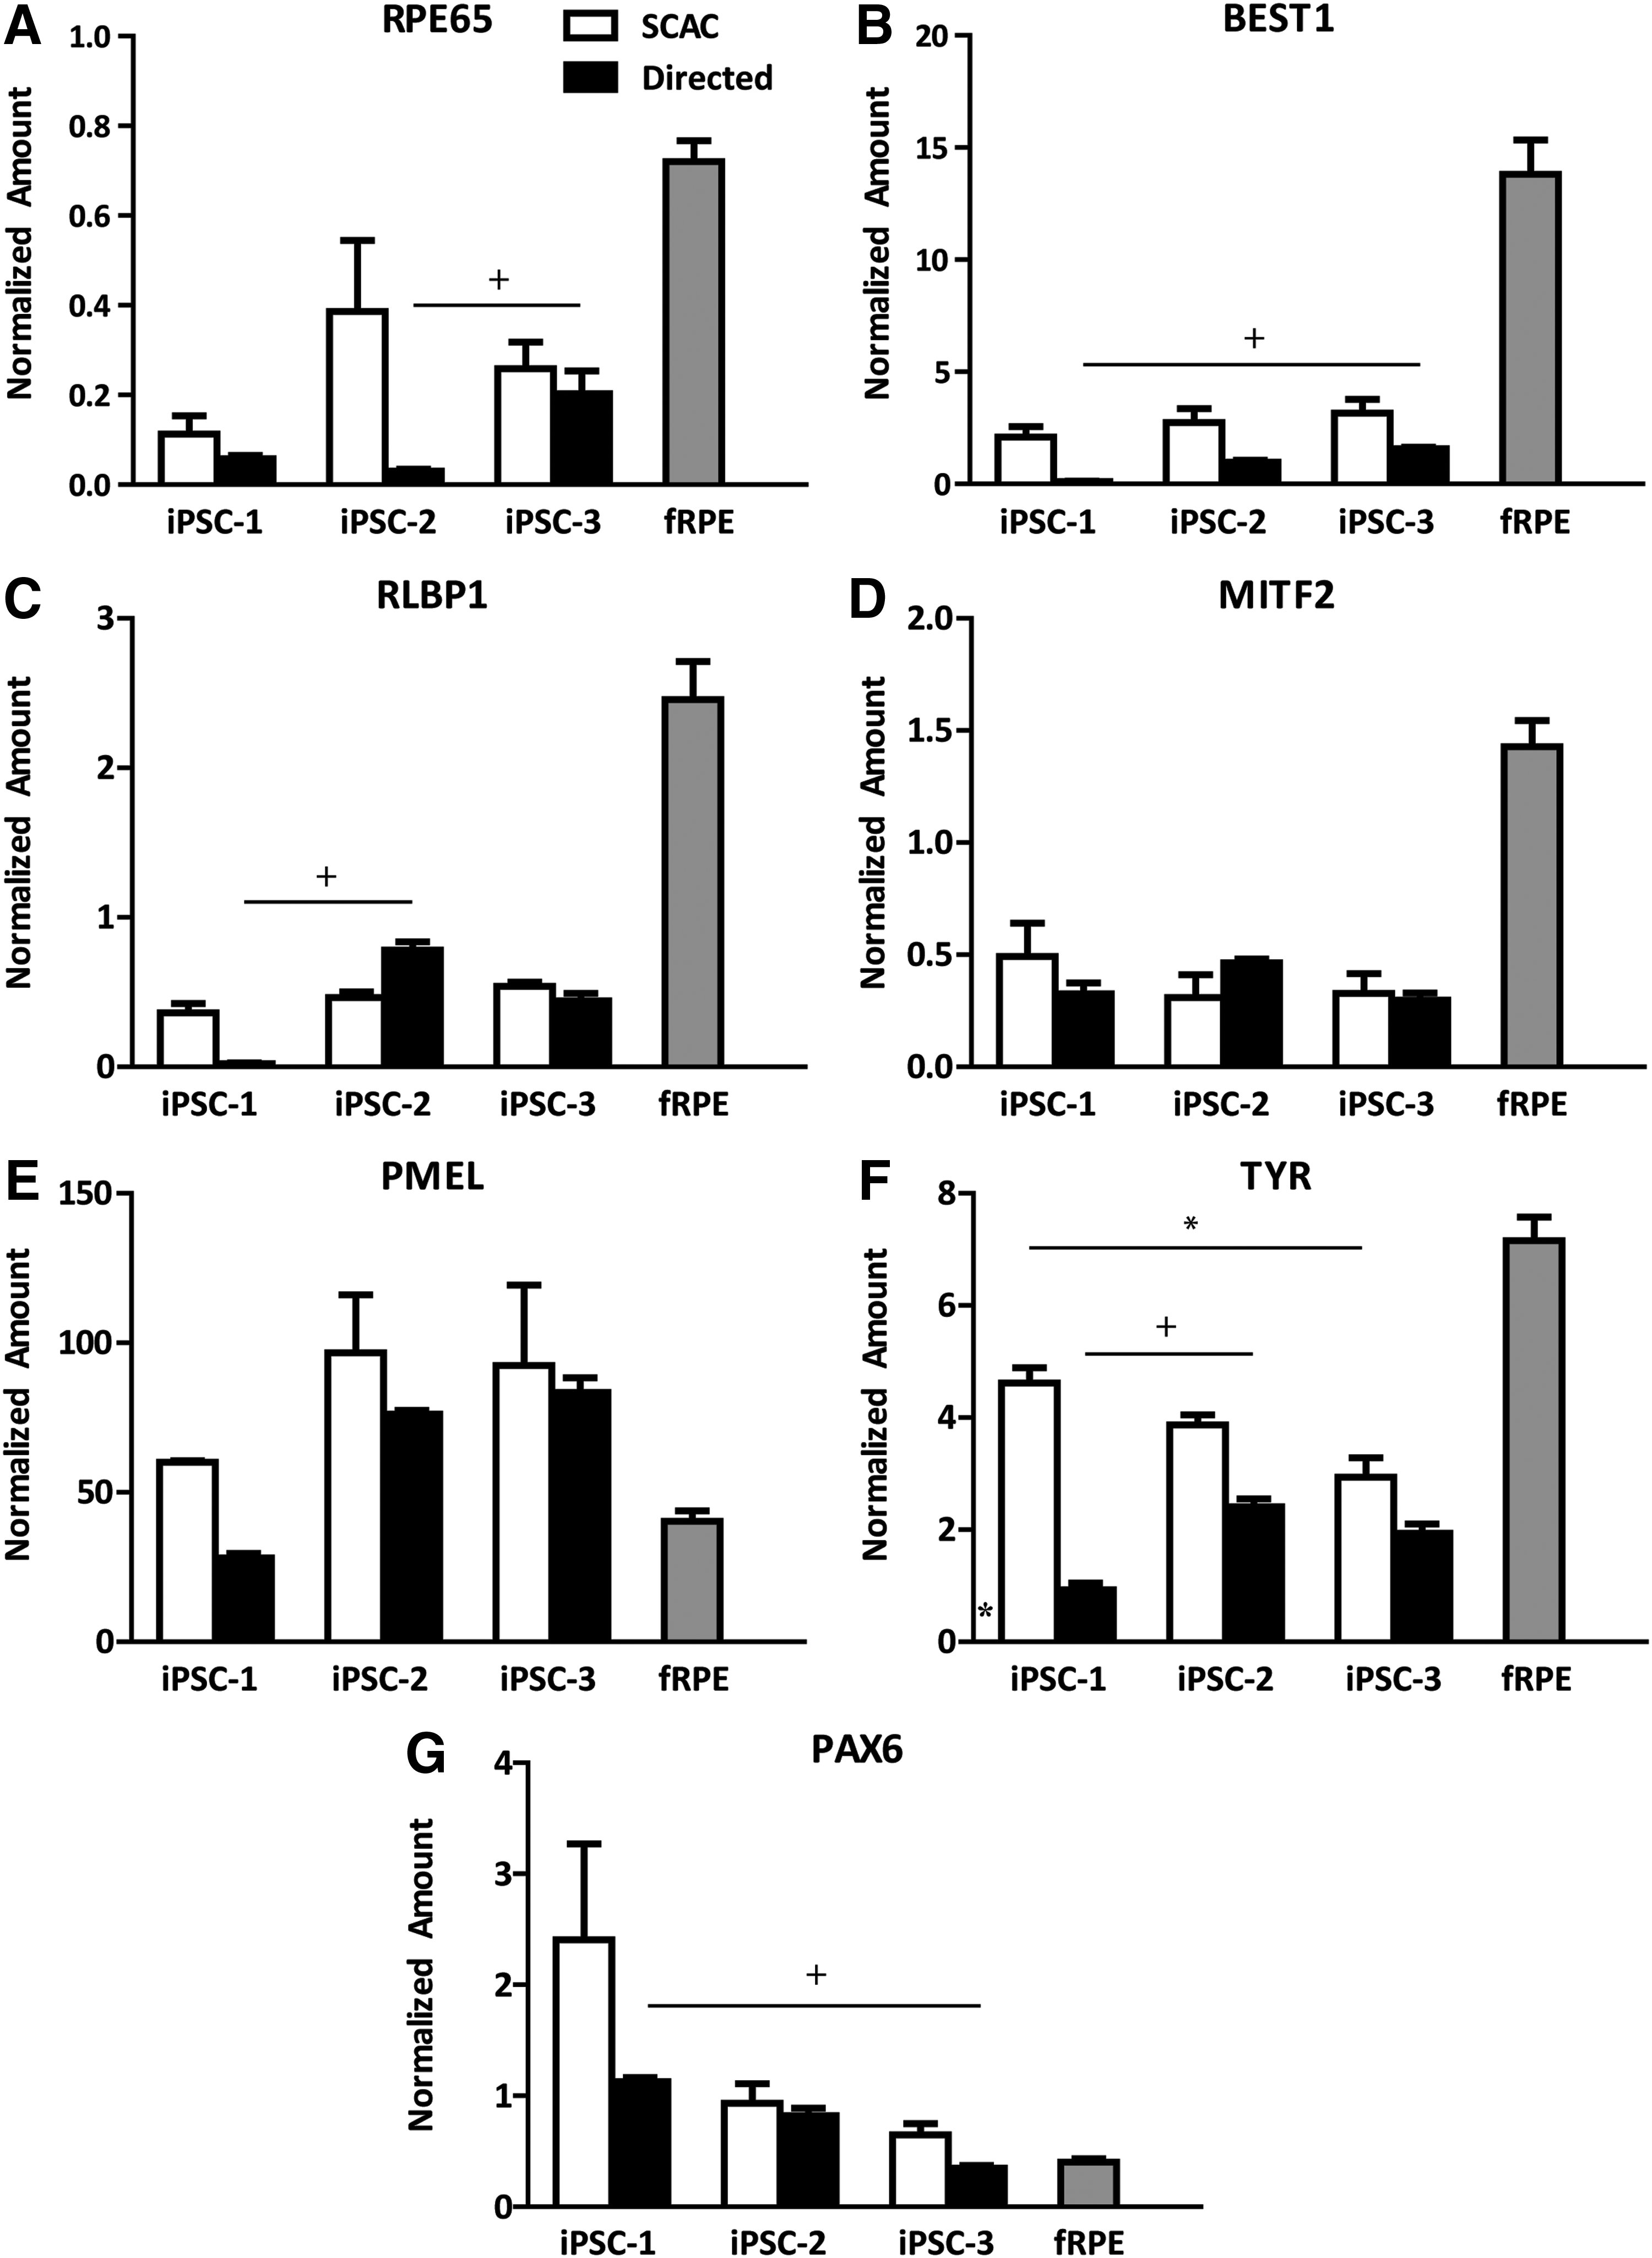
Gene expression in passage 3 iPSC-RPE on day 30.
To examine whether the directed iPSC-RPE lines can mature with extended culture, iPSC-1- and iPSC-2-RPE cells were grown for 60 days following thaw. Only iPSC-1 and iPSC-2 lines were examined since they had the largest discrepancies in RPE-specific transcript levels. RPE65 expression was analyzed at 30 and 60 days post-thaw and an increase in expression was observed for both directed iPSC-1- and iPSC-2-RPE; however this difference did not reach significance (Supplementary Fig. S3). RPE65 gene expression levels in the 60-day iPSC-2 cultures were more similar to 30-day fRPE (Fig. 2A).
qRT-PCR: comparison between iPSC-RPE lines derived using the SCAC method
Only one statistical difference was detected within the SCAC method between iPSC-RPE lines. SCAC iPSC-3-RPE expressed less TYR, a pigmentation enzyme, than SCAC iPSC-1-RPE (Fig. 2F).
qRT-PCR: comparison between iPSC-RPE lines derived using the directed method
Several statistical differences were detected when comparing iPSC-RPE lines derived by the directed method. RPE65, a mature RPE marker, was increased in directed iPSC-3-RPE compared to directed iPSC-2-RPE (Fig. 2A). BEST1, another mature RPE marker, showed higher levels in directed iPSC-3-RPE than directed iPSC-1-RPE (Fig. 2B). Directed iPSC-2-RPE had increased expression of RLBP, a visual cycle gene, and TYR, compared to directed iPSC-1-RPE (Fig. 2C, F). Directed iPSC-3-RPE showed a decrease in the neural retina transcript, PAX6, than directed iPSC-1-RPE (Fig. 2G).
Normalized expression levels of RPE markers and markers of potential contaminating cell types in directed- and SCAC-derived hESC-RPE are shown in Supplementary Table S2. All potential contaminant cell-type transcript levels for all lines and methods were below background levels.
Protein localization in iPSC-RPE is similar between lines and methods, with one exception
Despite differences in gene expression profiles, localization of RPE proteins appeared similar in all cell lines regardless of the differentiation method used, with the exception of directed differentiation-derived iPSC-1-RPE. In all other cell lines, MITF and OTX2 transcription factors showed nuclear localization (Fig. 3A, B). Similarly, PMEL and RPE65 were localized to the cytoplasm (Fig. 3C, D), as expected, and ZO-1, a marker for tight junctions, showed positive staining at the perimeter of the cell (Fig. 3E). Protein expression and localization in iPSC-2- and iPSC-3-RPE derived by either the directed or SCAC methods were analogous, and both cell lines were comparable to control hESC-RPE (Supplementary Fig. S4). fRPE has been extensively characterized for protein localization and hence used for all quantitative analyses herein, but not for ICC comparison. The SCAC-derived iPSC-1-RPE also exhibited expected protein localization, which was comparable to other SCAC-derived iPSC- and hESC-RPE lines.

Protein localization in passage 3 iPSC-RPE on day 30. Immunofluorescence staining for
iPSC-1-RPE derived by the directed method showed abnormal, non-nuclear staining of MITF (Fig. 3A). In some cells, ZO-1 was absent or localized to the cytoplasm (Fig. 3E), indicating a potential loss of junctional integrity, which has been previously observed in RPE cell lines after exposure to oxidative stressors 42 and epithelial–mesenchymal transition. 43 PMEL and RPE65 localized as expected in directed iPSC-1-RPE (Fig. 3C, D), however, only patches of cells stained positive for both markers, while others were devoid of signal. These findings parallel results depicted in Fig. 1, showing patches of iPSC-1-RPE cells lacking phase-bright tight junctions (arrowheads). Importantly, none of the cell lines derived by either method expressed TRA1-81, a marker for pluripotent cells (data not shown).
To look further at the polarity of the iPSC-RPE monolayer, directed- and SCAC-derived iPSC-3-RPE cells were stained for apically abundant Na+/K+ ATPase and imaged using confocal microscopy. Orthogonal views revealed basal nuclei 10 and punctate, predominantly apical localization of the ATPase transporter in iPSC-3-RPE derived by both methods (Fig. 3F).
Functional comparison of SCAC and directed differentiation methods
RPE has numerous critical functions that maintain photoreceptor health. 15 To determine the functionality of the iPSC-RPE lines and elucidate any discrepancies between lines, we performed established tests to examine phagocytic abilities and PEDF secretion. PEDF secretion was detected by performing an ELISA using medium collected from each iPSC-RPE line. Phagocytosis was determined by internalization of FITC-labeled bovine-isolated ROS. Importantly, cells were also treated with a function blocking αVβ5 antibody, the critical integrin associated with phagocytosis in RPE. 44
Comparison between differentiation methods
There were no statistical differences detected between methods within iPSC-RPE lines in PEDF secretion or phagocytosis (Fig. 4A, B). In all iPSC-RPE lines and fRPE, the anti-αVβ5 antibody significantly reduced phagocytosis compared to the ROS condition (P ≤ 0.05; Fig. 4B), indicating that iPSC-RPE phagocytose by the same mechanism known to be used in vivo. 44
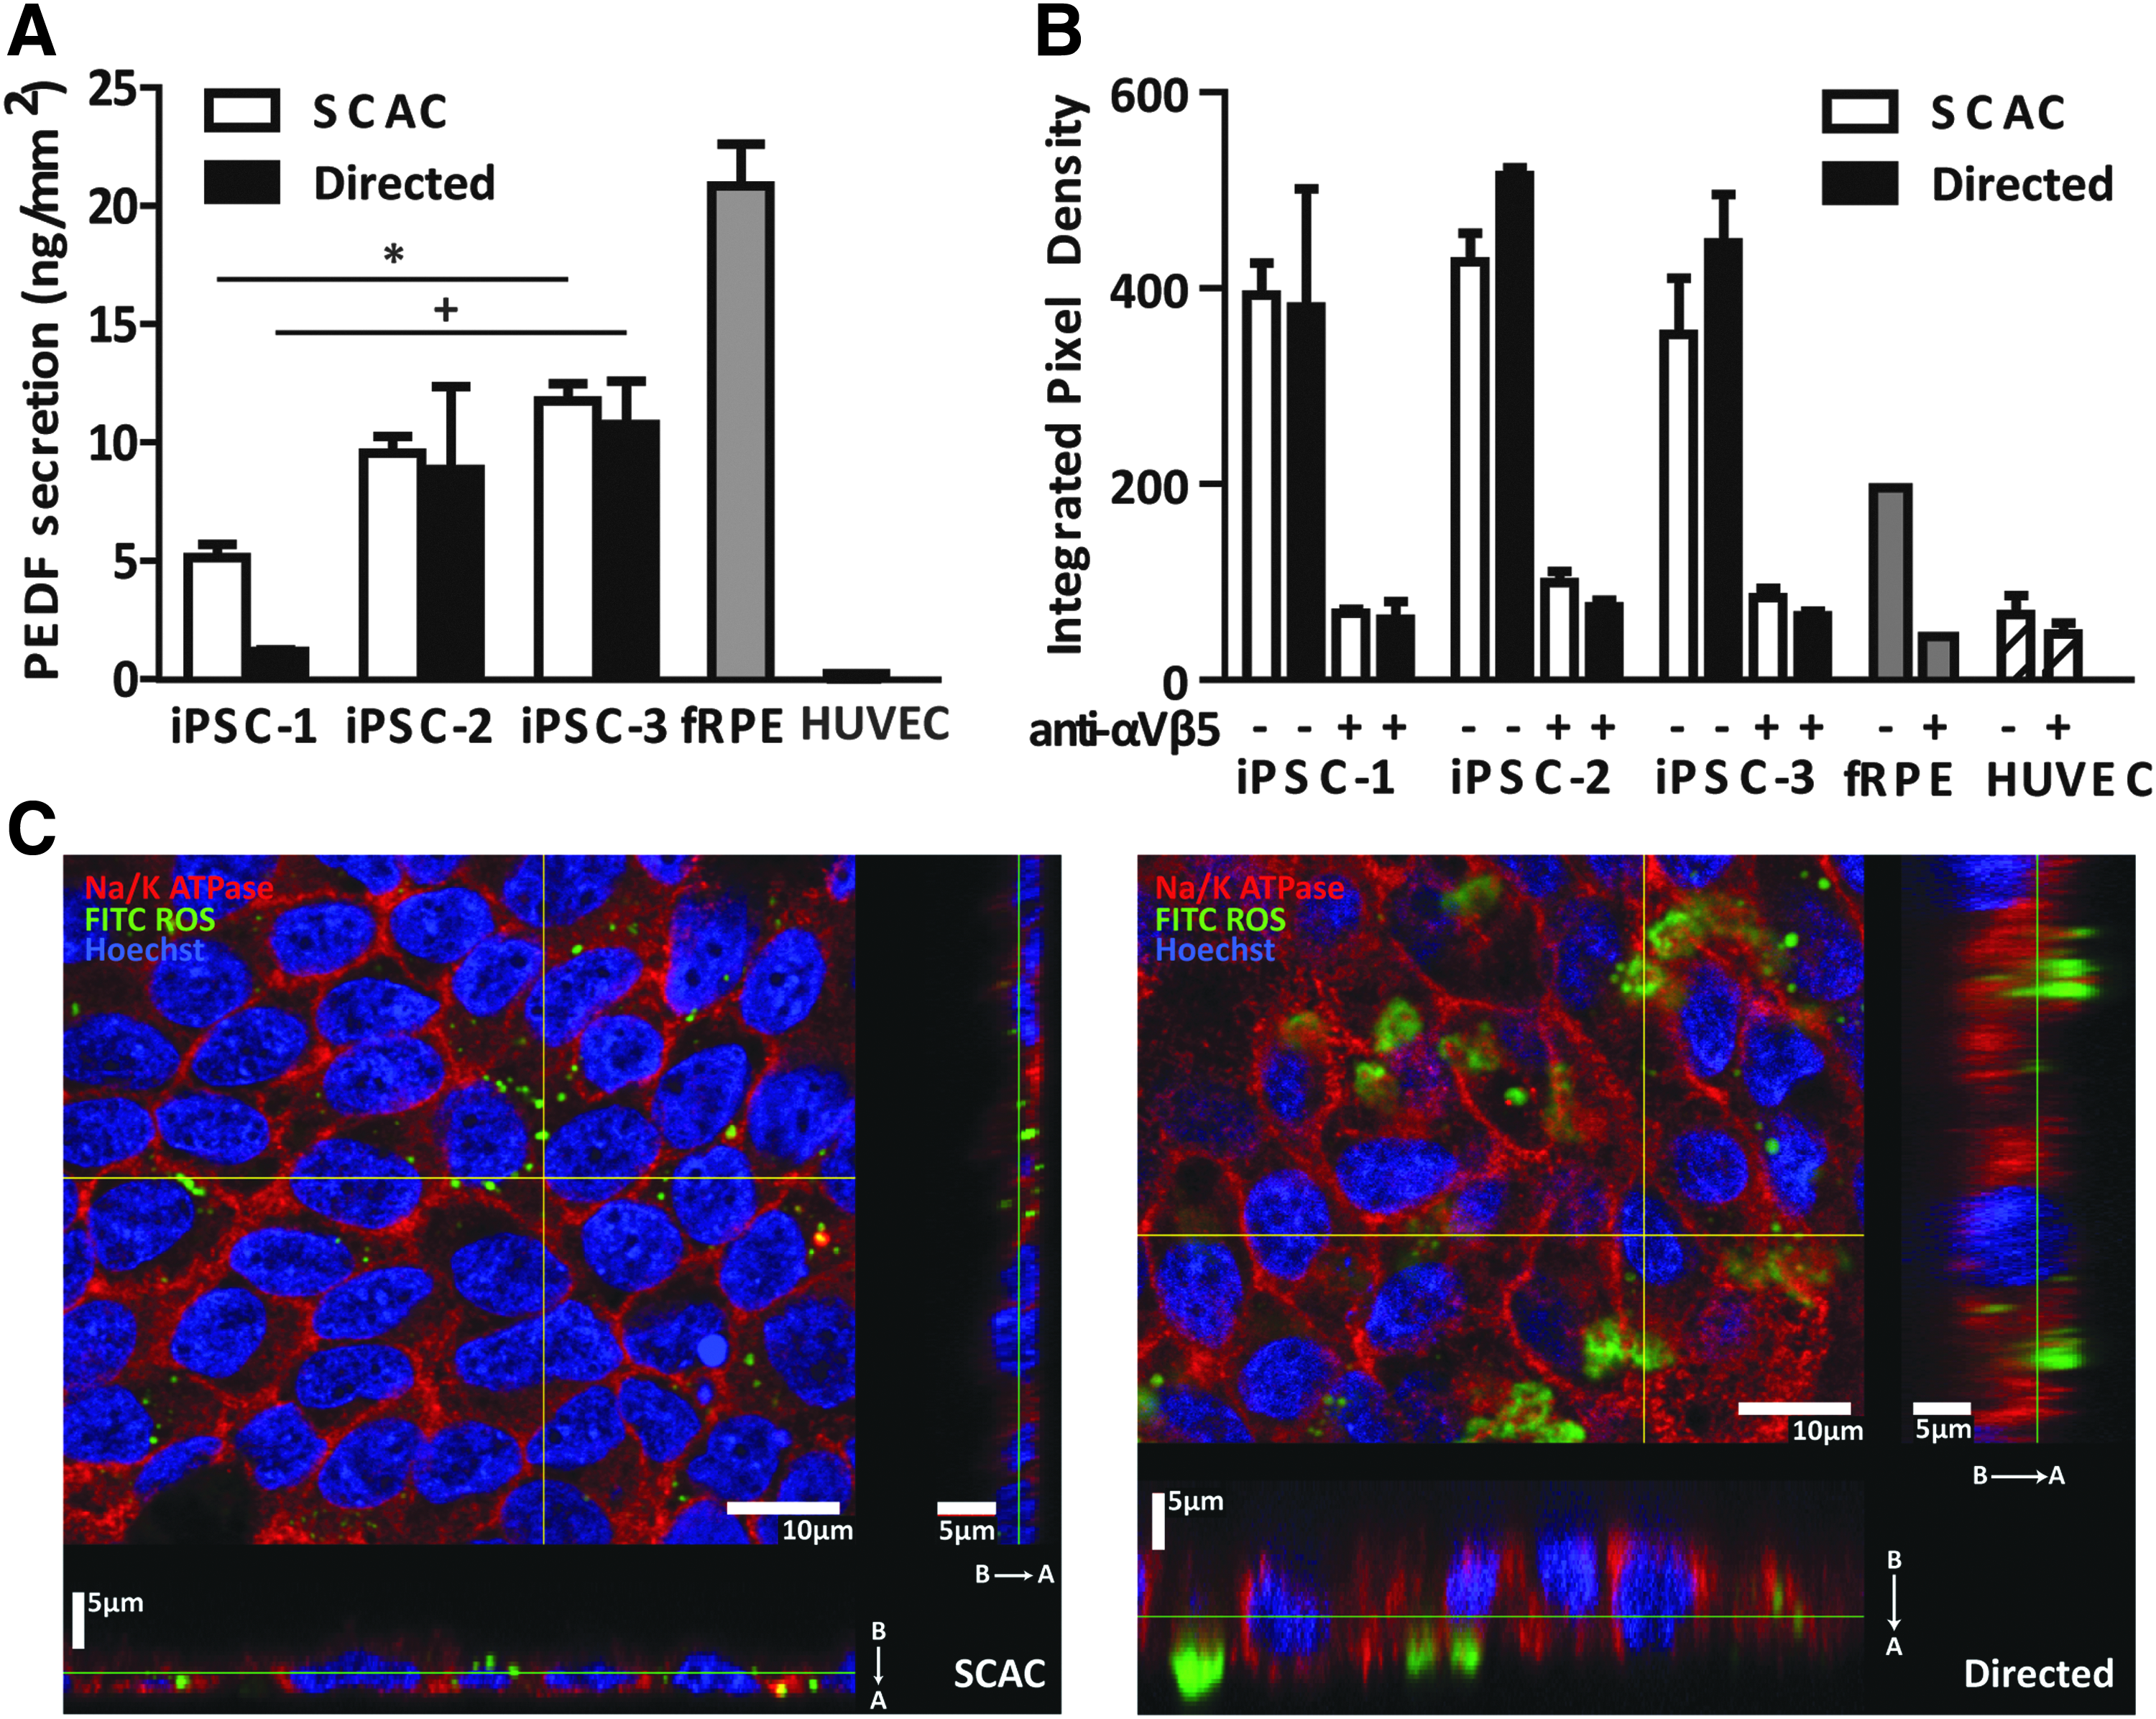
Functional analysis of passage 3 iPSC-RPE on day 30.
Comparison between iPSC-RPE lines
PEDF secretion for the SCAC-derived iPSC-1-RPE line was significantly lower than SCAC-derived iPSC-3-RPE (Fig. 4A). Similarly, PEDF secretion for directed iPSC-1-RPE was significantly decreased compared to directed iPSC-3-RPE (Fig. 4A).
There was no significant difference in phagocytosis among iPSC-RPE lines derived using the same method. iPSC-RPE showed consistently higher levels of phagocytosis when compared to fRPE, used as a positive control, similar to what has been reported for hESC-RPE; although this trend was not significant.23,24,32
To verify ROS internalization, directed- and SCAC-derived iPSC-3-RPE cells were imaged using confocal microscopy. Orthogonal views show internal localization of FITC-labeled ROS in iPSC-3-RPE derived by both methods (Fig. 4C). Importantly, confocal images revealed FITC-ROS were not internalized when cells were treated with the anti-αVβ5 antibody (Supplementary Fig. S5).
Discussion
As iPSC technology continues to broaden in application for regenerative studies and more iPSC-derived cellular products move toward the clinic, it will be important to identify protocols for consistent differentiation and establish release analyses to assess quality and minimize variability between lines. Using a multitude of assays to examine RPE maturity and function, this study provides an extensive comparison between multiple iPSC-RPE lines derived by different methods.
It was found that whereas 2 of 5 iPSC lines did not yield RPE using the SCAC method, all 5 iPSC lines generated RPE using the directed differentiation protocol. However, no significant differences were found between derivation methods within the same iPSC-RPE line once RPE was successfully derived. Furthermore, we observed line-to-line variation when using the same method. Similar variation between lines has been previously reported for RPE16,21,45 and other cell types derived from iPSC.45–49 The SCAC method secreted higher levels of PEDF in iPSC-3-RPE compared to iPSC-1-RPE. The directed method showed superior mature RPE transcript expression and PEDF secretion in iPSC-3-RPE. These findings hold clinical relevance as the SCAC method used herein is highly similar to the Current Good Manufacturing Practices (cGMP)-compliant conditions currently used to generate clinical-grade hESC-RPE; furthermore, characterizing directed-derived RPE from a broader pool of stem cells is a necessary step toward using these cells therapeutically.
RNA-seq data showed that fRPE and iPSC-RPE are quite similar, with only about 5% of genes expressed differentially. In addition, RNA-seq data showed overall downregulation of genes related to retinol metabolism, tight junctions, and integrin-ECM interaction in iPSC-3-RPE when compared to fRPE. These data also revealed that iPSC-3-RPE maintained expression of cell cycle markers on day 30 at passage 3, which could suggest incomplete maturation/differentiation of these cells. These data are supported by previous findings that show iPSC-RPE maintains hypermethylation of cell adhesion-related genes (hypomethylated in fRPE) 50 and gene expression profiles indicative of an immature RPE differentiation status 51 when compared to fRPE. The lagging maturity of the directed cells could explain the decreased RPE65 expression trend seen in Fig. 2A. As protocols are developed to push pluripotent cells toward RPE and other lineages in less time, it will be important to keep this question in mind—how fast should we speed up development in vitro? We showed that maturing directed iPSC-1- and iPSC-2-RPE for an additional 30 days boosts expression of RPE65, indicating that longer time in culture may be essential for cells to develop properly.
These results are in agreement with some studies showing that iPSC are not as efficient in generating RPE23,52,53 and may take slightly longer to differentiate to retinal lineages than hESC,48,54 but are contradictory to a recent study by Kamao et al., which found that most differentiated iPSC-RPE lines (with one exception) secreted higher levels of PEDF than fRPE. 9 We found no such statistical difference, and that fRPE shows higher trends of secretion. Inconsistencies between this study and ours could be due to the differentiation methods used and source or processing of fRPE tissue. Their RPE derivation protocol differs from our SCAC method by taking a more directed approach (they report using small molecules to promote RPE differentiation) and differs from our directed method by using different media compositions and exogenous signals to selectively stimulate RPE/retinal differentiation. 9 Notably, Kamao et al. also showed variation in PEDF secretion between iPSC-RPE lines. 9
Discrepancies in qRT-PCR expression and PEDF secretion data between iPSC-RPE lines within the directed group further underscore the need for standardized assays that accurately test RPE quality. iPSC-1-RPE derived by the directed method showed the lowest expression of mature RPE markers and PEDF secretion levels, although phagocytosis was comparable to other lines (Figs. 2 and 4). In addition, directed iPSC-3-RPE showed the highest levels of mature RPE markers and PEDF secretion (Figs. 2 and 4). These data suggest that a PEDF ELISA might be an easy, efficient, and accurate way to determine RPE quality following derivation from different pluripotent sources without extensive characterization.
Importantly, we found that all 5 iPSC lines originally used for this study could be coaxed to differentiate to RPE using the directed protocol, while 2 lines were unable to generate usable quantities of RPE with SCAC differentiation. In addition, lineage-specific T-cell markers were found to be upregulated in SCAC-derived iPSC-3-RPE, but not in the directed contingent, indicating iPSC-3 retain or re-express these markers during spontaneous differentiation. These results suggest that some iPSC lines may require a more directed approach to (1) produce enough cells for characterization and (2) further silence residual somatic cell lineage makers; both of which could make a case for using directed methods over a longer, spontaneous approach.
The original source of donor cells and the method of reprogramming are possible explanations for differences in the differentiation capacity between iPSC lines. iPSC-3 were derived from T cells, while iPSC-1 and iPSC-2 were derived from foreskin fibroblasts. 6 Previous studies have shown RPE and neuroretinal cell types can be differentiated from T-cell- and fibroblast-derived iPSCs21,23,48,53–58; however, characterized RPE has not been compared based on somatic cell origin. Interestingly, iPSC-1, iPSC-2, and iPSC-4, all derived from the same foreskin fibroblast line,1,6 showed differences in RPE generation capacity; specifically, iPSC-4 were unable to generate enough RPE for characterization using SCAC without contaminating cell types in the culture. This suggests that the method of reprogramming somatic cells to iPSCs may be a strongly contributing factor to RPE differentiation variability between lines.
All 3 foreskin fibroblast-derived iPSC lines (iPSC-1, iPSC-2, and iPSC-4) were reprogrammed using EBV-based episomal systems; however, different transgene arrangements and combinations of episomal vectors were used to induce pluripotency for each line. 6 It has been suggested that maintaining a balance between transgene expression levels is crucial for efficient reprogramming. 58 Thus, it is possible that iPSC-1 and iPSC-4 lines may not be efficiently reprogrammed compared to iPSC-2 and as a consequence may have more restricted differentiation and expansion capacity as RPE. In addition, iPSC-12 showed a limited ability to generate RPE, which may not be entirely surprising as the patient from whom these iPSC were derived had a known mutation in the OAT locus, resulting in GA (an RPE/retinal degenerative disorder). 29 Experiments are ongoing to fully understand why this line did not generate RPE by the SCAC method. These results highlight the importance of creating reliable methods for RPE differentiation from pluripotent sources and that each line is rigorously characterized for variability before use.
In summary, these data present a comparison between RPE differentiation methods for multiple iPSC lines. Our results indicate that some iPSC lines may require directed differentiation to generate RPE, and that prolonged culture time may be necessary to achieve a fully mature RPE. As iPSC-RPE becomes more clinically applicable, these results have potentially important implications for developing standardized release assays, optimizing iPSC reprogramming methods, and developing superior iPSC lines for clinical use.
Footnotes
Acknowledgments
This work was supported by the Foundation Fighting Blindness Wynn-Gund Translational Research Acceleration Program, the Garland Initiative for Vision at UC Santa Barbara, the California Institute for Regenerative Medicine (CIRM; grants DR1-01444, CL1-00521, TB1-01177, TG2-01151, and FA1-00616), Fight for Sight, and a grant to the UC Santa Barbara Institute for Collaborative Biotechnologies from the U.S. Army Research Office (Grant W911NF-09-0001). The content within does not necessarily reflect the position or policy of the government, and endorsement should not be inferred. L.L.L. was a fellow of the Vermont Community Foundation. R.H.C. and T.N.C. were CIRM fellows and V.P.N. was a fellow of the CIRM Bridges program. The authors thank Dr. Sherry Hikita, Michelle Maloney, Cassidy Hinman, and staff of the Laboratory for Stem Cell Biology and Engineering (UCSB) for providing pluripotent stem cells and advice on stem cell and RPE maintenance and culturing. In addition, they thank Dr. YerPeng Tan of the BNL (UCSB) and Dr. Mary Raven of the NRI-MCDB Microscopy Facility (UCSB; NIH Grant 1S10OD010610-01A1).
Authors Contributions
L.L.L.—conception and design, collection and/or assembly of data, data analysis and interpretation, manuscript writing, and final approval of manuscript.
R.H.C.—conception and design, collection and/or assembly of data, data analysis and interpretation, manuscript writing, and final approval of manuscript.
Q.H.—collection and/or assembly of data and data analysis and interpretation.
V.P.N.—collection and/or assembly of data and data analysis and interpretation.
T.N.C.—conception and design, collection and/or assembly of data, and data analysis and interpretation.
B.O.P.—collection and/or assembly of data.
D.M.G.—conception and design, collection and/or assembly of data, data analysis and interpretation, manuscript writing, final approval of manuscript, and financial support.
D.O.C.—conception and design, collection and/or assembly of data, data analysis and interpretation, manuscript writing, final approval of manuscript, and financial support.
Author Disclosure Statement
No competing financial interests exist.
References
Supplementary Material
Please find the following supplemental material available below.
For Open Access articles published under a Creative Commons License, all supplemental material carries the same license as the article it is associated with.
For non-Open Access articles published, all supplemental material carries a non-exclusive license, and permission requests for re-use of supplemental material or any part of supplemental material shall be sent directly to the copyright owner as specified in the copyright notice associated with the article.