
Abstract
Abstract
Purpose:
Memantine (MEM) acts on the glutamatergic system by blocking N-methyl-
Methods:
Cells were plated, pretreated for 6 h with 30 μM of MEM, and then exposed for 24 h to 200, 100, 50, and 25 μM of HQ while MEM was still present. Cell viability (CV), reactive oxygen species (ROS), mitochondrial membrane potential (ΔΨm), and lactate dehydrogenase (LDH) release assays were performed.
Results:
HQ-treated cells showed a dose-dependent decrease in CV and ΔΨm, but an increase in ROS production and LDH levels in both cell lines. MEM pretreatment reversed the CV in 50, 100, and 200 μM doses in ARPE-19 cells and at all HQ concentrations in MIO-M1 cells compared to HQ-treated cultures. ROS production was reversed in all HQ concentrations in both cell lines. ΔΨm was significantly increased after MEM pretreatment only in 50 μM HQ concentration for both cell lines. LDH levels were decreased at 50 and 25 μM HQ in ARPE-19 and MIO-M1 cells, respectively.
Conclusion:
HQ-induced toxicity is concentration dependent in ARPE-19 and MIO-M1 cultures. MEM exerts protective effects against HQ-induced toxicity on human retinal pigment epithelial and Müller cells in vitro.
Introduction
P
Memantine (MEM) is an N-methyl-
Smoking is considered one of the most important risk factors for developing AMD. Smokers have 2- to 3-fold higher risk to develop AMD compared to never-smokers. 34 Smoking has an association with both the wet and dry forms of advanced AMD.35,36 The risk declines by 6.7% after 1 year of smoking cessation, and the risk goes down by another 5% if the no-smoking habit continues. Finally, after 10 years of not smoking, an extra 4.2% risk reduction is added.37,38
Inflammation and oxidative stress caused by cigarette smoke are thought to play a role in developing AMD.39,40 Chemicals and carcinogens are found in gas-phase smoke and/or the retained tar within cigarette filters.41,42 Hydroquinone (HQ), a semiquinone mixture, is the most common component found in cigarette` tar, 43 with each cigarette filter having up to 155 mg of HQ. 44 In the industrial work place, HQ is found in X-ray films, photographic paper, and is used as a reducing agents in most petrochemical and rubber products. Clinically, HQ can be used to treat hyperpigmented photodamaged skin. 45
Even in the absence of direct exposure to the chemical, human urine can contain low parts-per million levels of HQ due to exposure to benzene. 46 Surprisingly, increases in plasma and urine HQ levels that are even higher than after 30 min of smoking 4 cigarettes can occur after oral ingestion of wheat products and pears. 47 In vitro studies have shown HQ toxicity on retinal and vascular cell cultures.48–50 Studies with male F344 rats reported nephrotoxicity and tumorigenicity after HQ exposure.51,52 In an experimental animal model of dry AMD, ingestion of HQ causes formation of sub-RPE deposits and thickening of Bruch`s membrane. 53 HQ-induced oxidative stress leads to decreased activity of matrix metalloproteinase 2 (MMP-2), 54 upregulation of both vascular endothelial growth factor and pigment epithelium-derived factor, and downregulation of monocyte chemoattractant protein 1 (MCP1) both in vitro and in a mice model. 55 Reversing the effects of HQ on cultured cells has been studied previously.32,56 The zonulae occludentes junctions between RPE cells represent the outer blood/retinal barrier. The RPE, which is adjacent to Bruch's membrane, is responsible for light absorption, phagocytosis of photoreceptor outer segments, and maintaining the subretinal space by transporting/secreting ions and mediators between the various retinal layers. 57 Loss of the RPE cells is the early sign of developing AMD. The ARPE-19 cell line has been shown to have similar functional and structural properties of human RPE cells, which makes the cell line valuable for in vitro experiments. 58
Müller cells, often considered the skeleton of the retina, are glial cells that secrete factors essential in maintaining integrity of the blood/retinal barrier.59,60 Other functions include funneling light through the retina so as to reach photoreceptors 61 and synthesizing retinoic acid. 62 The MIO-M1 cell line, established at Moorfield Institute of Ophthalmology, has been shown by confocal microscopy to have known markers of Müller cells, including epidermal growth factor receptor, alpha-smooth muscle actin, glutamine synthetase, and glial fibrillary acidic protein (GFAP). 63 Therefore, this cell line is very suitable to study the effects of different pharmacological substances on Müller cells in vitro.
The aim of this study was to determine if MEM had protective properties against the cytotoxic effects of HQ on the human ARPE-19 and MIO-M1 cell lines.
Methods
Cell culture
ARPE-19 cells (ATCC, Manassas, VA) were cultured in Dulbecco's modified Eagle's medium (DMEM) mixture 1:1 Ham's F-12 medium (Corning–Cellgro; Mediatech, Manassas, VA), containing 10% fetal bovine serum (FBS), penicillin G 100 U/mL, streptomycin sulfate 0.1 mg/mL, gentamicin 10 mg/mL, and amphotericin B 2.5 mg/mL. Serum-free medium was used after cells reached monolayer confluence. Human MIO-M1 cells, obtained from the Department of Cell Biology of the University College, London, 63 were grown in Dulbecco's modified Eagle's medium 1 × with high glucose (DMEM+GlutaMAX; Gibco, Carlsbad, CA). Initially, cells were cultured in 10% FBS, penicillin G 100 U/mL, and streptomycin sulfate 0.1 mg/mL, but to keep the cells in the nonproliferating phase, the culture media were changed to 2% FBS. Both cultured ARPE-19 and MIO-M1 cells were kept under standard incubating conditions: 37°C and 5% carbon dioxide.
MEM pretreatment
The ARPE-19 and MIO-M1 cells received 6 h pretreatment with MEM 30 μM dissolved in media. This dose was shown in our previous study to have maximum protective effects. 32 A stock concentration of 20 mM of commercially available HQ powder (Reagent Plus; Sigma Aldrich) was made by solubilization in dimethyl sulfoxide (DMSO). Then, cells were exposed to HQ at concentrations of 200, 100, 50, and 25 μM and incubated another 24 h at 37°C. The MEM was present in the media throughout the culture periods. The controls for these experiments include cells treated with the DMSO, equivalent for 200 μM HQ, and also untreated cells.
Cell viability assay
ARPE-19 and MIO-M1 cells (5 × 10⁵ cells/well) were plated in 6-well plates for 24 h and treated as described above. Cells were harvested using trypsin-EDTA 0.2% for 5 min, centrifuged for 5 min at 1,000 rpm, and then resuspended in 1 mL of culture medium. Cell viability (CV) was assessed by trypan blue dye-exclusion with an automated ViCell cell viability analyzer (Beckman Coulter, Inc., Fullerton, CA).
Reactive oxygen species assay
The reactive oxygen species (ROS) assay, measuring levels of hydrogen peroxide, peroxyl radicals, and peroxynitrite anions, was performed using the fluorescent dye 2′,7′-dichlorodihydrofluorescein diacetate (H2DCFDA; Invitrogen-Molecular Probes, Eugene, OR). 64 The fluorescent signal was determined using the fluorescent image scanning unit FMBio III (Hitachi Solutions America) with excitation (EX, 550 nm) and emission (EM, 600 nm) filters.
Mitochondrial membrane potential assay
Detection of mitochondrial membrane potential (ΔΨm) values was performed using the JC-1 mitochondrial membrane potential detection kit (Biotium, Hayward, CA). JC-1 (5,5′,6,6′-tetrachloro-1,1′,3,3′-tetraethylbenzimidazolyl-carbocyanine-iodide) is a cationic dye that accumulates in the mitochondrial membranes of healthy cells resulting in red fluorescence (590 nm). When ΔΨm levels are reduced in stressed or damaged cells, this leads to accumulation of the JC-1 dye resulting in green fluorescence (530 nm). The ratio of red to green fluorescence is calculated to obtain the changes in ΔΨm. The fluorescent signals were measured with the fluorescent image scanning unit FMBio III (Hitachi Solutions America, San Bruno, CA) set to detect green (EX, 485 nm and EM, 535 nm) and red (EX, 550 nm and EM 600 nm) emissions.
Lactate dehydrogenase cytotoxicity assay
The lactate dehydrogenase (LDH) assay for detecting necrosis was performed using the LDH Cytotoxicity Assay Kit II (BioVision, Inc., Mountain View, CA) according to the manufacturer's protocol. This kit uses the WST (4-[3-(4-iodophenyl)-2-(4-nitrophenyl)-2H-5-tetrazolio]-1,3-benzene disulfonate) reagent for detection of LDH released from the damaged cells. NADH release from oxidized lactate by LDH reacts with WST that was measured at 450 nm optical density with a BioTek ELx808 absorbance plate reader (BioTek, Winooski, VT).
Markers for ARPE-19 and MIO-M1 cell lines
To validate our cell lines, we used real-time-qPCR (RT-qPCR) to measure expression levels of genes known to be markers for human RPE cells and human retinal Müller cells. Briefly, ARPE-19 and MIO-M1 cells were plated in 6-well plates and RNA isolated using the RNeasy Mini-Extraction kit (Qiagen, Inc., Valencia, CA). The cDNA was synthesized from 100 ng of each RNA sample using the SuperScript-VILO cDNA Synthesis Kit (Invitrogen—Life Technologies, Eugene, OR). To analyze for markers of ARPE-19 cells, RT-qPCR was performed using primers (QuantiTect Primer Assay; Qiagen, Inc.) for bestrophin1 (BEST1, Gene ID 7439, NM_004183), 65 cellular retinaldehyde-binding protein-1 (CRALBP, Gene ID 6017, NM_000326),58,65 and keratin-18 (KRT18, Gene ID 3875, NM_000224) a marker for RPE differentiation. 65
The markers for MIO-M1 cells were actin, alpha 2, smooth muscle, aorta (ACTA2, Gene ID 59, NM_00114945), and GFAP (Gene ID 2670, NM_002055). 63 However, low levels of CRALBP can also be found in Müller cells. 63
Each of the marker genes was compared to the housekeeper gene hydroxymethylbilane synthase (HMBS, Gene ID 3145, NM_000190, NM_001024382, NM_001258208, and NM_001258209). Then, the fold differences between the ARPE-19 cells and MIO-M1 cells were calculated. The samples were run in triplicate and the experiment repeated twice.
The RT-qPCR was performed using Power SYBR Green Master Mix (Applied Biosystems—Life Technologies, Eugene, OR) on a StepOnePlus Q-PCR system (Applied Biosystems—Life Technologies). ΔCt values for each marker gene of interest were calculated through normalization to the internal control HMBS. ΔΔCt values were obtained through comparison of ARPE19 and MIO-M1 ΔCt values. Folds were calculated with the formula 2ΔΔCt.
In ARPE-19 cells, the expression level for BEST1 was 88-fold higher than for MIO-M1 cells; the CRALBP expression levels were 6.4-fold higher in ARPE-19 cells versus MIO-M1 cells. Finally, the ARPE-19 cells also had higher expression of KRT18 (62-fold) compared to MIO-M1 cells. Multiple attempts using primers from 2 different companies were made to amplify the RPE65 gene, but the ARPE-19 cells expressed only low-level, variable products. This was not surprising since it has been reported that cultured cells hardly ever express the RPE65 gene, and when it is expressed in vitro the peak expression time point is ∼42 days in culture. 66 The MIO-M1 cells show significantly higher expression levels of the ACTA2 (3.4-fold) and the GFAP (21.6-fold) genes compared to the ARPE-19 cells.
Our findings demonstrate that the ARPE-19 cells had high expression levels for markers (BEST1, CRALB, and KRT18) for this specific cell type. The MIO-M1 cells produce high levels of the Müller cell markers (ACTA2 and GFAP), but also expressed some levels of CRALBP, which was expected. These studies thereby validate that our cultures produced markers consistent with RPE and Müller cells.
Statistical analyses
Data were analyzed with unpaired t-test and 1-way ANOVA using the GraphPad Prism version 5.00 for Windows (GraphPad Software, San Diego, CA; www.graphpad.com). P ≤ 0.05 (*) statistically significant; P ≤ 0.01 (**) very significant; and P ≤ 0.001 (***) extremely significant. Error bars in the graphs represent SEM for the triplicate performed experiments.
Results
CV studies
For ARPE-19 cells, the mean percentage CV values were 17.03 ± 1.18, 59.43 ± 0.54, 74.57 ± 2, and 94.57 ± 1.16 for 200, 100, 50, and 25 μM HQ, respectively, compared to 96.23 ± 1.75 for the DMSO equivalent (amount of DMSO in the 200 μM HQ sample) (Table 1). Pretreatment with 30 μM MEM resulted in an increase in CV for the 200 μM HQ (54.57 ± 1.83, P = 0.0003), 100 μM HQ (89.53 ± 1.64, P = 0.005), and 50 μM (92.17 ± 0.67, P = 0.006) when compared to the DMSO-equivalent cultures (Fig. 1A). The 25 μM HQ-treated cultures were not changed (97.27 ± 0.71, P = 0.28).

Cell viability assay.
DMSO, dimethyl sulfoxide; HQ, hydroquinone; MEM, memantine.
In MIO-M1 cells, the mean percentage CV values for 200, 100, 50, and 25 μM HQ-treated MIO-M1 cells were 31.83 ± 0.32, 36.27 ± 0.65, 61.07 ± 0.49, and 89.30 ± 0.3, respectively, compared to 91.33 ± 0.7 at DMSO-equivalent cultures. The CV values were increased after MEM pretreatment at all concentrations: 200 μM had 83.73 ± 2.42 (P = 0.002), 100 μM had 83.27 ± 1.3 (P = 0.0002), 50 μM had 84.17 ± 2.04 (P = 0.012), and 25 μ M HQ was 90.40 ± 0.06 (P = 0.049) compared to the HQ-alone treated samples (Fig. 1B).
ROS assay
In ARPE-19 cell line, ROS production levels were increased after HQ treatment with relative fluorescence values (RFV) of 13733 ± 759.3, 13377 ± 622.6, 11932 ± 367.7, and 10344 ± 388.3 for HQ at 200, 100, 50, and 25 μM concentrations, respectively, compared to the DMSO-equivalent value of 3807 ± 258.2 (Fig. 2A) (Table 2). The ROS levels were decreased significantly with MEM pretreatment for all of the HQ-treated cultures. The RFV was 9469 ± 876.8 (P = 0.0026) at 200 μM, 5710 ± 938.0 (P = 0.002) at 100 μM, 3986 ± 838.2 (P = 0.006) at 50 μM, and 3566 ± 447.2 (P = 0.01) at 25 μM of HQ + MEM-treated cultures (Fig. 2A).
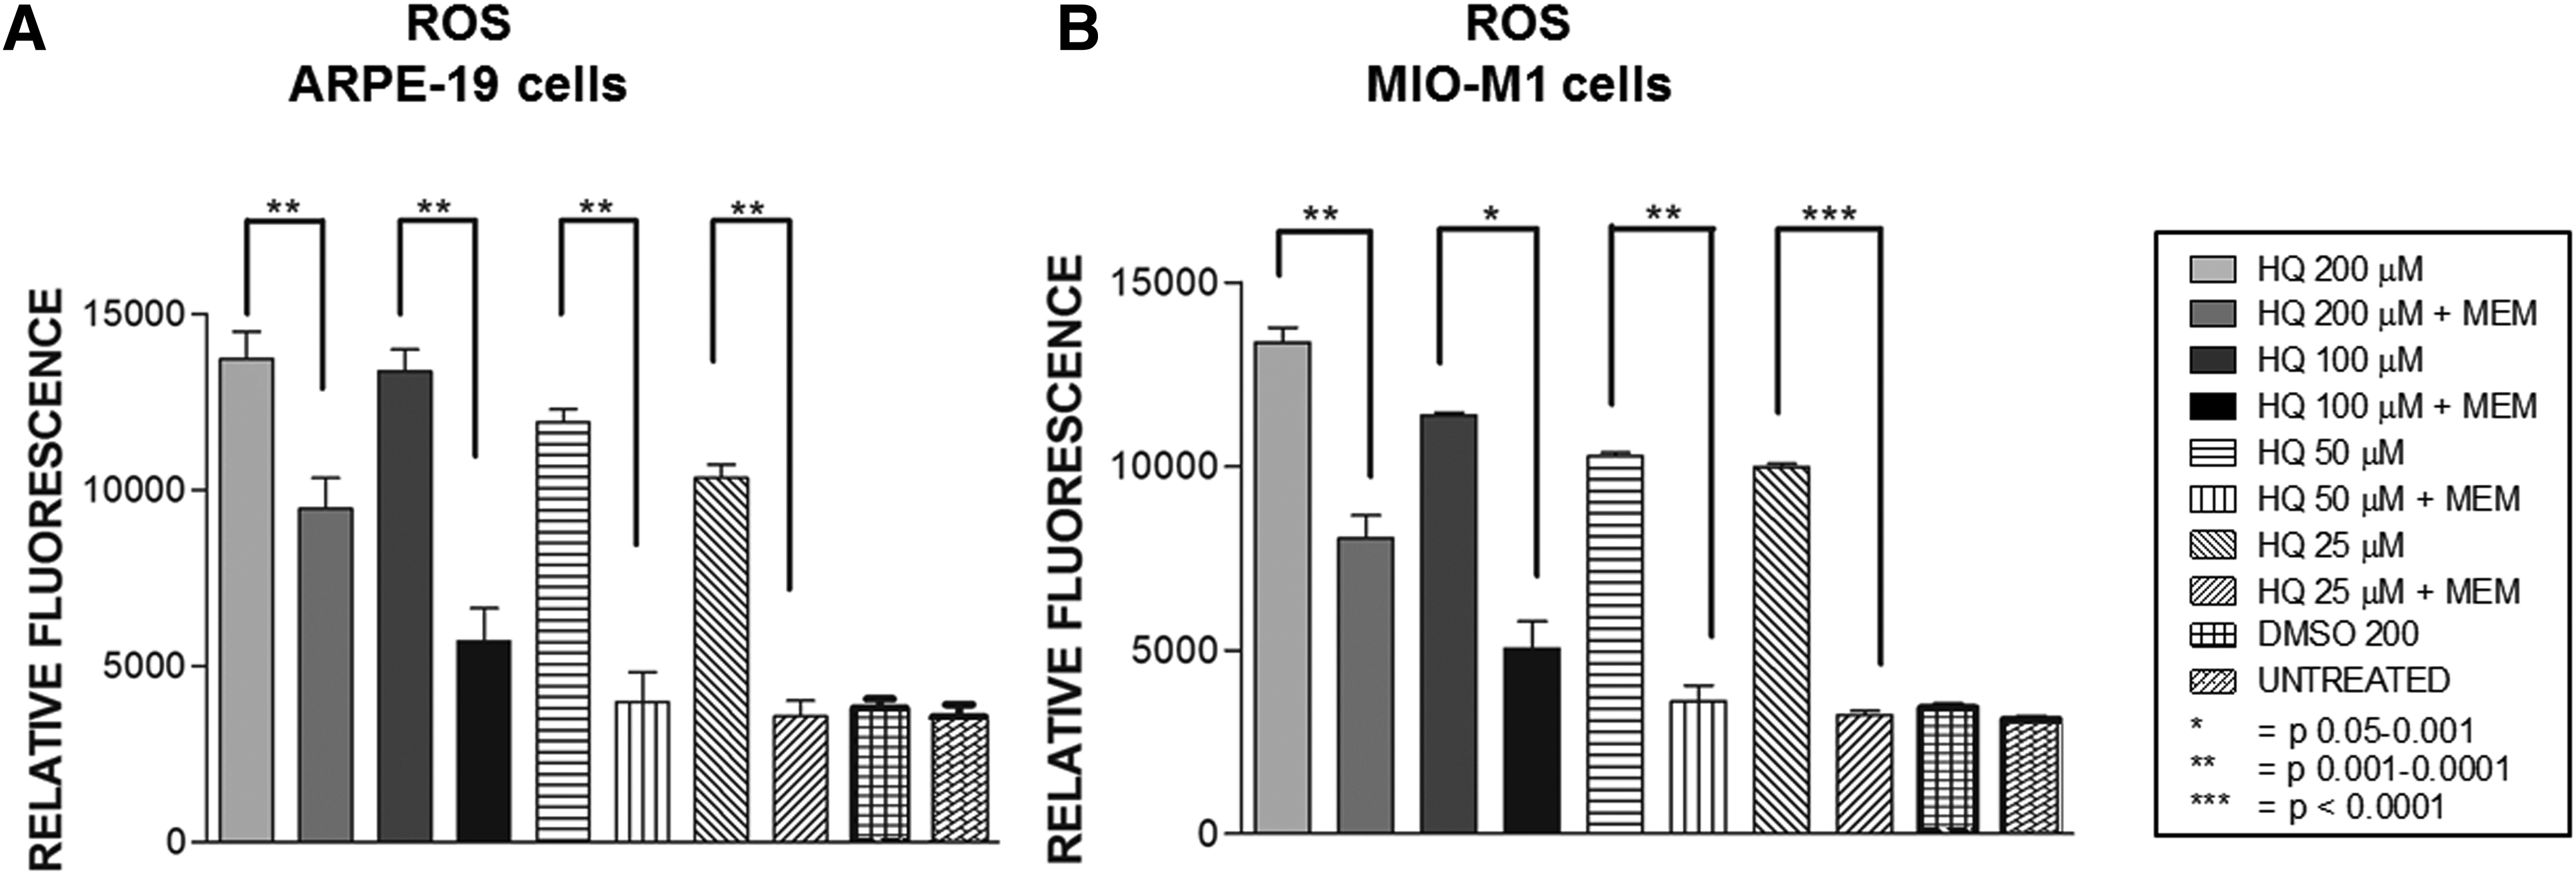
ROS production assay.
Similar protective effects by MEM were found in MIO-M1 cells treated with varying concentrations of HQ (Fig. 2B). The RFV of 13369 ± 396.5 for 200 μM HQ-treated, 11377 ± 83.14 for 100 μM HQ-treated, 10266 ± 102.5 at 50 μM HQ-treated, and 9977 ± 89.63 at 25 μM HQ-treated compared to the DMSO-equivalent cultures with the RFV of 3421 ± 48.42. These values were significantly decreased after MEM pretreatment at all concentrations; the values were 8036 ± 618.4 (P = 0.004), 5043 ± 739.5 (P = 0.011), 3599 ± 431.7 (P = 0.003), and 3232 ± 113.9 (P = 0.0001) for MEM plus 200, 100, 50, and 25 μM of HQ, respectively (Fig. 2B).
Mitochondrial membrane potential assay
The ΔΨm fluorescence ratios in the ARPE-19 cells exposed to 200, 100, 50, or 25 μM of HQ were 3654 ± 71.73, 3941 ± 77.02, 5167 ± 33.32, and 7543 ± 78.03, respectively, compared to the DMSO-equivalent-treated cells (9180 ± 75.62, Fig. 3A) (Table 3). These values were corrected only at 50 μM HQ-treated cells after 6 h of MEM pretreatment with value of 6951 ± 58.74 (P = 0.0006) when compared to the HQ-equivalent value. The other MEM-treated samples did not show significant changes in ΔΨm fluorescence levels compared to the HQ-treated counterparts; MEM +200 μM HQ treated at 3713 ± 61.36 (P = 0.17), MEM +100 μM HQ treated at 4112 ± 99.83 (P = 0.43), and MEM +25 μM HQ treated at 7517 ± 46.67 (P = 0.49) (Fig. 3A).
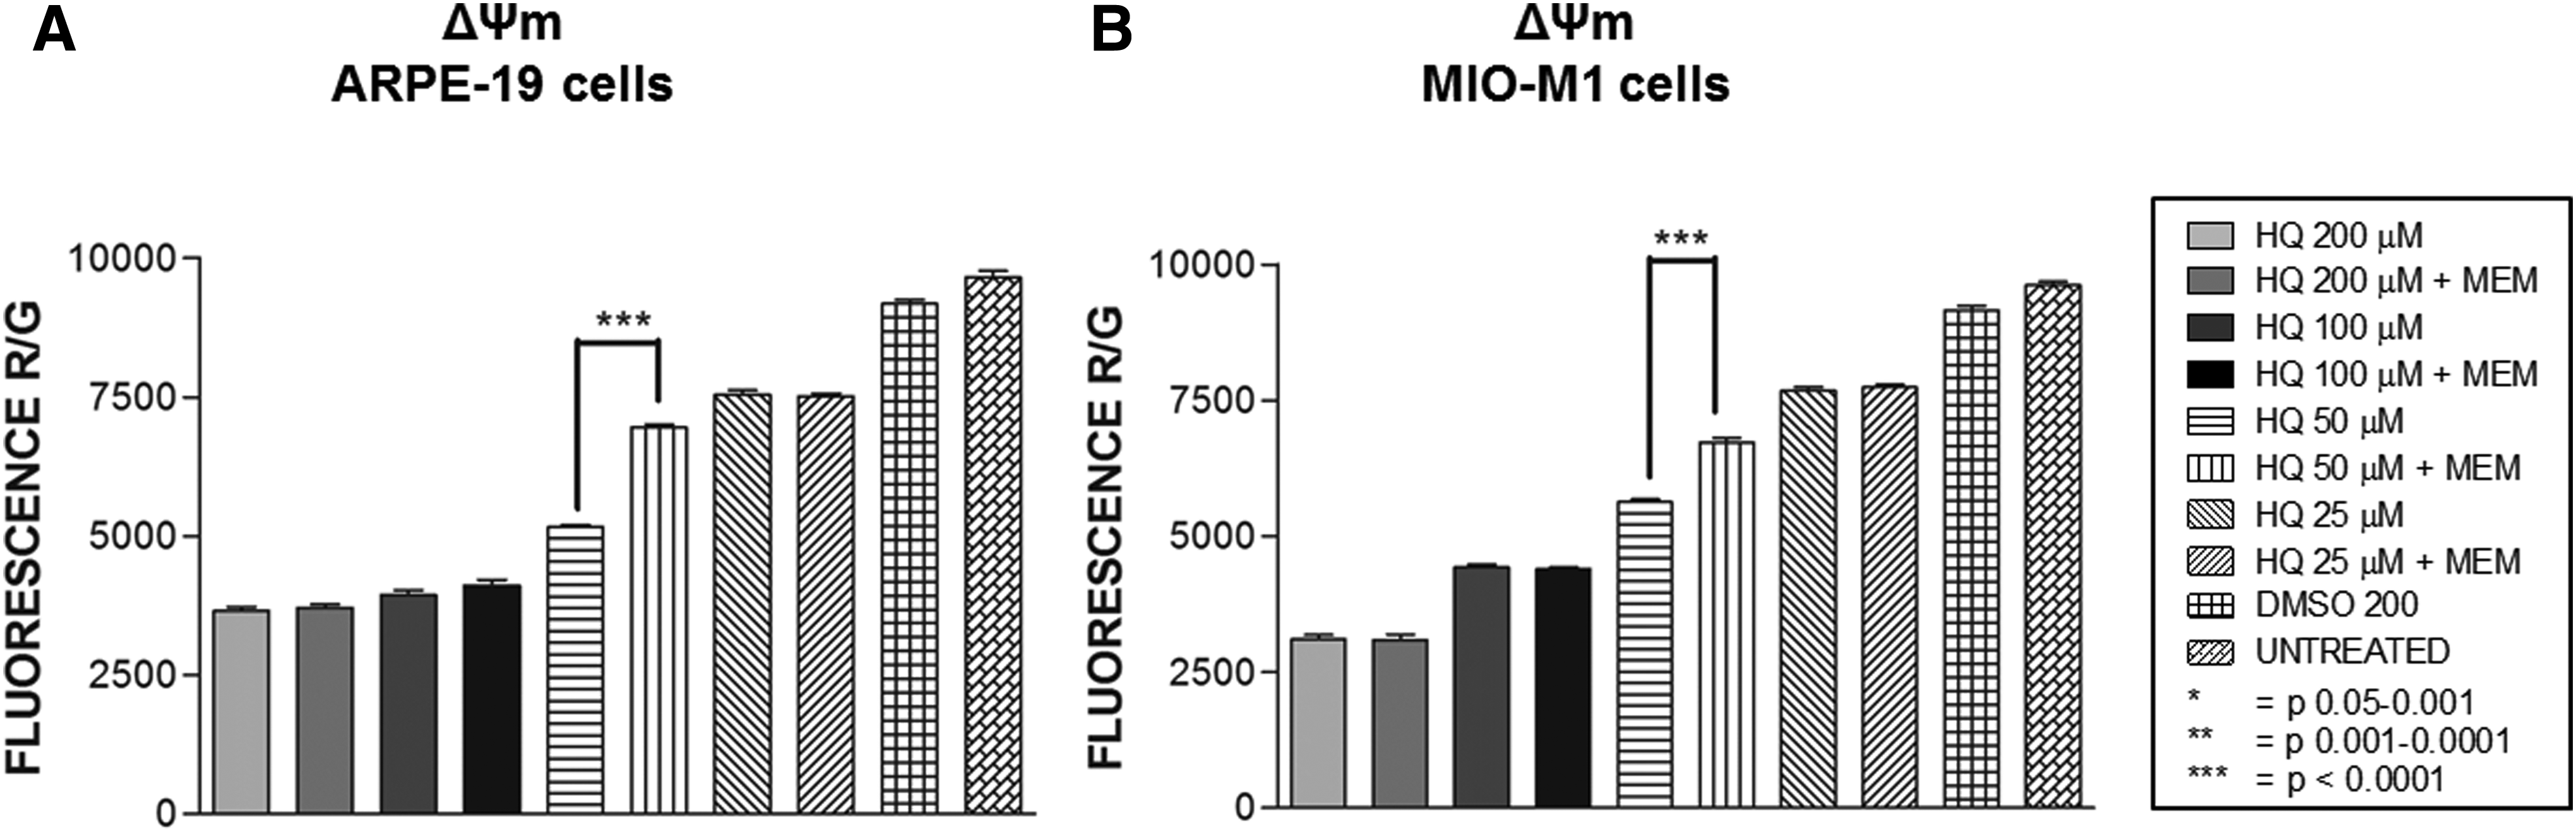
Mitochondrial membrane potential (ΔΨm) assay.
ΔΨm fluorescence ratios for MIO-M1 cells treated with 200, 100, 50, or 25 μM of HQ alone were 3104 ± 85.34, 4420 ± 59.60, 5626 ± 53.41, and 7673 ± 70.50, respectively, compared to the DMSO-equivalent cells (9154 ± 82.10). As was seen in the ARPE-19 cell line, the fluorescence ratio of only the 50 μM HQ + MEM cultures was increased to 6729 ± 74.14 (P = 0.0005) compared to its HQ-treated values. The other values were not significantly changed, for the MEM +200 μM HQ-treated values (3099 ± 93.06, P = 0.61), MEM +100 μM HQ-treated values (4390 ± 41.31, P = 0.74), and MEM +25 μM HQ-treated values (7740 ± 54.61, P = 0.52) compared to the HQ-treated counterparts (Fig. 3B).
LDH release assay
Conditioned media of ARPE-19 cells treated with 200, 100, 50, or 25 μM of HQ alone showed LDH levels of 5.4 ± 0.067, 4.7 ± 0.088, 4.1 ± 0.049, and 2.1 ± 0.13, respectively, compared to the DMSO-equivalent-treated cells, 1.6 ± 0.06 (Table 4). The LDH levels were decreased significantly in the MEM +50 μM HQ cultures (2.3 ± 0.036, P = 0.002). However, the values for the other samples were not significantly changed; values for MEM +200 μM HQ treated were 5.4 ± 0.23 (P = 0.8), MEM +100 μM HQ treated showed 4.6 ± 0.034 (P = 0.8), and MEM +25 μM HQ treated was 1.5 ± 0.13 (P = 0.1) compared to the HQ-alone samples (Fig. 4A).
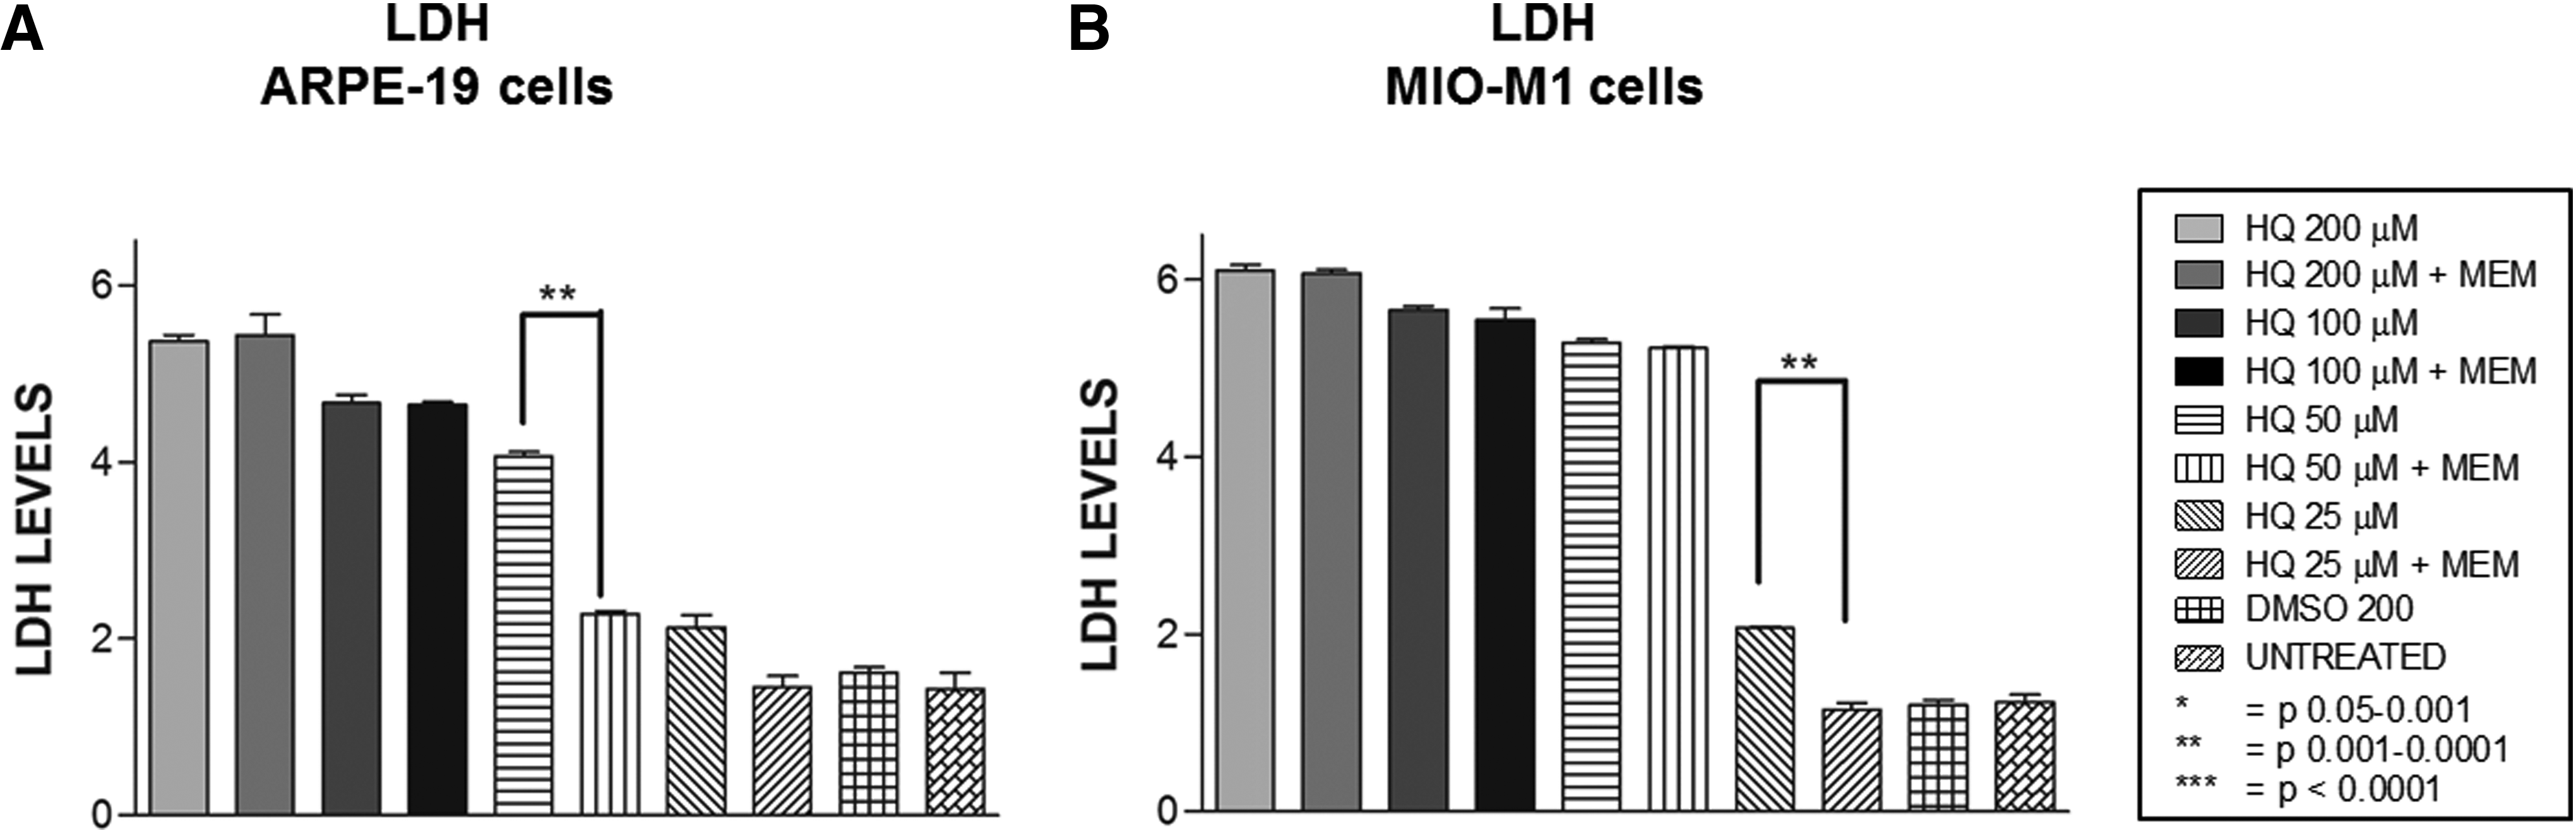
LDH release assay.
Conditioned media of MIO-M1 cells treated with different concentrations of HQ alone showed LDH levels of 6.1 ± 0.058, 5.7 ± 0.043, 5.3 ± 0.041, and 2.1 ± 0.013 for 200, 100, 50, or 25 μM, respectively, compared to the DMSO-equivalent-treated cells (1.2 ± 0.058). The levels of LDH decreased significantly after pretreatment with MEM only at the 25 μM HQ-treated cultures (1.2 ± 0.076, P = 0.006). The MEM +200 μM, MEM +100 μM, and MEM +50 μM HQ values (56.1 ± 0.035, P = 0.42); 5.5 ± 0.13, P = 0.57; and 5.2 ± 0.022, P = 0.32, respectively) were not significantly different from the HQ treated (Fig. 4B).
Discussion
Previous studies have shown that HQ had toxic effects on cultured human RPE cells (ARPE-19),49,56 human Müller retinal cells (MIO-M1),50,56 human microvascular endothelial cells, and rat neurosensory retinal cells (R-28). 49 The present study demonstrates that MEM has dose-dependent protective properties in human ARPE-19 and MIO-M1 cells that were stressed with HQ. Previously, Mansoor et al., reported that MEM had antiapoptotic effects and decreased the ROS production after treating with catechol and benzo(e)pyrene, components from cigarette smoke, on cultured ARPE-1933 and Müller cells. 32 MEM was also shown to be beneficial in other ocular cells in vitro. For example, a glaucoma study showed MEM provided protection against RGC death.24,67
Clinical studies with patients have reported that the therapeutic effects of MEM in aging patients with neuropsychiatric diseases are through antiapoptosis, decreasing extracellular deposition of fibrillogenic amyloid-beta peptides (Abeta),16–18 and inhibiting of microglial activation.19,20
In our study, both ARPE-19 and MIO-M1 cells showed increased cell viabilities at all concentrations of HQ after pretreatment with MEM. The largest reversals of CV were seen in the ARPE-19 cell cultures treated with 200 μM HQ (17.03% to 54.57%), and in MIO-M1 cell cultures treated with 100 μM HQ (36.27% to 83.27%). Since smoking is the most common reversible risk factor for developing AMD, and HQ is a major component of smoking, then it may be reasonable to use MEM in those AMD patients unable to quit and still smoking.
MEM successfully reversed in both cell lines the elevated ROS levels induced by HQ treatment. This demonstrated that HQ stimulated the oxidative stress pathway, 56 but MEM could block it. In contrast, MEM was not successful in reversing the HQ-induced decline in ΔΨm, as seen by the fact that only at the single dose of 50 μM HQ were the ARPE-19 or MIO-M1 cells protected by MEM. This suggests that MEM effects were greater at blocking ROS production and less at providing stability to the mitochondrial membrane potential.
LDH production reflects the degree of necrosis in cultured cells. In ARPE-19 and MIO-M1 cells, the HQ treatment induced an increase of LDH levels in a dose-dependent manner. It was only at the lower HQ concentrations (50 μM HQ for ARPE-19 and 25 μM for MIO-M1) that MEM pretreatment had any protective effects (LDH levels decrease in ARPE-19 cultures from 4.1 ± 0.049 to 2.3 ± 0.36; MIO-M1 had decreased levels from 2.1 ± 0.013 to 1.2 ± 0.076). These results demonstrate that the degree of necrosis and cell damage resulting from HQ toxicity can only be slightly reversed by pretreatment with MEM. Jantas-Skotniczna et al. showed that MEM attenuated the staurosporine-induced activation of caspase-3 and LDH release in hippocampal cultured neurons, moderately inhibited LDH only in striatal culture, and partially inhibited staurosporine-induced neuronal injury in neocortical cultures. 68
There have been only a limited number of studies to identify potential drugs capable of reversing HQ toxicity. It was shown in ARPE-19 and MIO-M1 cells that brimonidine exhibited protective properties against the HQ toxicity by increasing the CV and mitochondrial membrane potential, while decreasing the LDH and ROS levels. 56 However, to date, no other inhibitors have been reported that block the HQ cytotoxic effects.
A limitation to our study is the use of transformed cell lines (ARPE-19 and MIO-M1) to address retinal biology because these cultures can be very different from the nontransformed retinal cells. Using array analyses, Tian et al. showed that ARPE-19 cells have different gene expression profiles than the native RPE cells and the patterns can be modulated by varying the substrate and serum levels. 69 Therefore, while valuable information can be gained from ARPE-19 studies, future studies are needed to validate the protective effects of MEM using RPE cells grown on transwell inserts that have developed physiological polarity and cultured primary cells.
In summary, our results demonstrate that (1) HQ-induced toxicity is directly proportion to the concentration used; (2) HQ toxicity is mediated through multiple pathways, including mitochondrial membrane alteration, oxidative stress, and the necrosis pathway; and (3) MEM can protect both human RPE cells and Müller cells from HQ-induced damage through lowering ROS production levels and to a lesser extent through stabilization of the mitochondrial membrane potential. Future studies should include evaluation of MEM protective effects in the in vivo models for a better understanding of the potential uses of this drug.
Footnotes
Author Disclosure Statement
M.T.M., C.R., K.S., S.R.A., G.A.L., and M.C.K.: No competing financial interests exist. B.D.K.: Consultant to Alcon, Alimera, Allegro, Allergan, Genentech, Glaukos, GSK, Neurotech, Novagali, Novartis, Ophthotech, Pfizer, Regeneron, Santen, SecondSight, Teva, ThromboGenics.