
Abstract
Abstract
Purpose:
To present a semiquantitative ocular scoring system comprising elements and criteria that address many of the limitations associated with systems commonly used in preclinical studies, providing enhanced cross-species applicability and predictive value in modern ocular drug and device development.
Methods:
Revisions to the ocular scoring systems of McDonald–Shadduck and Hackett–McDonald were conducted by board-certified veterinary ophthalmologists at Ocular Services On Demand (OSOD) over the execution of hundreds of in vivo preclinical ocular drug and device development studies and general toxicological investigations. This semiquantitative preclinical ocular toxicology scoring (SPOTS) system was driven by limitations of previously published systems identified by our group's recent review of slit lamp-based scoring systems in clinical ophthalmology, toxicology, and vision science.
Results:
The SPOTS system provides scoring criteria for the anterior segment, posterior segment, and characterization of intravitreal test articles. Key elements include: standardized slit lamp settings; expansion of criteria to enhance applicability to nonrabbit species; refinement and disambiguation of scoring criteria for corneal opacity, fluorescein staining severity, and aqueous flare; introduction of novel criteria for scoring of aqueous and anterior vitreous cell; and introduction of criteria for findings observed with drugs/devices targeting the posterior segment. A modified Standardization of Uveitis Nomenclature (SUN) system is also introduced to facilitate accurate use of SUN's criteria in laboratory species.
Conclusions:
The SPOTS systems provide criteria that stand to enhance the applicability of semiquantitative scoring criteria to the full range of laboratory species, in the context of modern approaches to ocular therapeutics and drug delivery and drug and device development.
Introduction
C
These systems and others were compared in our recent comprehensive literature review of slit lamp-based scoring systems in clinical ophthalmology, ocular toxicology, and vision science. That review identified 138 published systems for assessment of the general anterior segment, lens, or ocular surface. While most systems were described for the clinical evaluation of human patients, 17% (including those of McDonald–Shadduck and Hackett–McDonald) were described specifically for albino rabbits, with 11% and 4% being reported for evaluation of albino rats and mice, respectively. Systems described for pigmented strains of rabbits and rats, and larger species, such as dogs and nonhuman primates (NHPs), were infrequently described.
Likely due to lack of available systems with strain- or species-specific scoring criteria, there is an industry-wide tendency to apply systems such as those of McDonald–Shadduck and Hackett–McDonald (or modified versions thereof) to pigmented strains as well as larger laboratory species such as the dog and NHP. Importantly, these systems do not incorporate standard slit lamp settings for examiners, and use criteria that may not be completely congruous with modern approaches to ocular drug delivery or development of novel ocular therapeutics and devices. Additionally, the lack of stringent application of uniform instrument settings and the intrinsic ambiguities of applying systems to strains and species they were not specifically designed for can be amplified in extended studies that may necessitate exams being performed by multiple examiners. To address many of these limitations and improve upon current approaches to clinical evaluation and semiquantitative scoring in the full range of albino and pigmented species used in modern ocular drug development, we present herein the semiquantitative preclinical ocular toxicology scoring (SPOTS) system as well as the SPOTS-modified SUN system.
The SPOTS System
The SPOTS system evolved from the iterative collaborative engagement of a team of scoring-harmonized, board-certified veterinary ophthalmologists, members of Ocular Services On Demand (OSOD), over the execution of hundreds of ocular drug and device development studies evaluating a wide array of test articles and devices, material platforms, and delivery routes. Harmonization was verified by the sequential scoring of all board-certified veterinary ophthalmologists using the ophthalmologist with the most extensive experience in the context of drug development studies (P.E.M.) as the gold standard in application of the scoring system employed. It expands upon or modifies many criteria employed in the systems of McDonald–Shadduck and Hackett–McDonald, introduces novel anterior chamber (AC) and vitreous cell scoring schemes, and provides standardized slit lamp settings applicable to both table-mounted and hand-held instruments. Beyond specific parameters scored using slit lamp biomicroscopy, the SPOTS system also introduces ophthalmoscopic scoring criteria for posterior segment parameters with importance in ocular toxicology, as well as criteria for accurate monitoring of intravitreal (IVT) test articles. It should be noted that the SPOTS system utilizes criteria for real-time, analog scoring by clinicians, and not digital scoring systems or similar schemes that incorporate grading center-level analysis or other techniques for objective quantification as previously published.7–13
An important aspect of the SPOTS system is the option for integration of clinical diagrams to capture important attributes of ocular findings or test articles that are not easily addressed through scoring and tabulation, but which provide information of considerable value in drug development programs. In addition, to accurately record the severity and spatial distribution of ocular findings within the anterior and posterior segments, diagrammatic representations improve correspondence of findings across sequential observers. Furthermore, integration of diagrams is especially useful when conducting eye-targeted programs, but is typically left out (at least initially) in ocular assessments of noneye targeted therapeutics.
It needs to be acknowledged that any system employed in ocular drug or device development programs may benefit by the integration of study-specific scoring parameters into the basal scoring system being employed. While the SPOTS system provides the default system used among all OSOD veterinary ophthalmologists and vision scientists, study-specific pilot data, unanticipated clinical findings, or the specific needs of a particular program may necessitate modifications. Based on the limitations of currently published scoring systems, however, the updated and novel elements of the SPOTS system, whether implemented as published or modified, stand to improve the predictive value of ocular scoring in the context of modern drug development.
The SPOTS system comprises 3 sections: (1) anterior segment and anterior vitreous cell scoring through slit lamp biomicroscopy; (2) posterior segment scoring through indirect ophthalmoscopy; and (3) IVT test article characterization also primarily through indirect ophthalmoscopy. Complete scoring criteria are presented in Table 1.
Conjunctival swelling scored as “4” may present with varying degrees of severity, primarily depending on the degree of conjunctival exposure.
If multiple areas of opacity with varying scores are observed in an eye, the assigned Severity score should correspond to the most severely affected area.
If multiple corneal opacities are observed in an eye, diagramming of the lesions' characteristics is recommended in lieu of a corneal opacity (area) score.
In pigmented strains/species, visibility of secondary and tertiary iridal vessels may be obscured.
If multiple fluorescein stain severity scores are observed in an eye, the assigned Severity score should correspond to the most severely affected area.
If multiple fluorescein staining lesions are observed in an eye, diagramming of staining distribution is recommended in lieu of a fluorescein staining (area) score.
Diagramming of lens opacities is recommended to facilitate localization and longitudinal monitoring.
AC, anterior chamber; IVT, intravitreal; PLR, pupillary light reflex; SPOTS, semi-quantitative preclinical ocular toxicology scoring; SUN, Standardization of Uveitis Nomenclature; VCD, vertical corneal diameter.
Diagramming of retinal perivascular sheathing is recommended to facilitate clinical appearance, distribution, and longitudinal monitoring.
Diagramming of test article distribution is recommended to facilitate characterization, localization, and longitudinal monitoring.
Below we detail the elements of this system, employed by all members of OSOD's distributed preclinical consulting network. For simplicity, we highlight similarities and distinguishing attributes of the SPOTS system from the most widely referenced systems detailed by McDonald–Shadduck and Hackett–McDonald (M-S and H-M).
Section I. Anterior Segment and Anterior Vitreous Cell Scoring
Anterior segment scoring is performed using a Kowa™ SL-15 or SL-17 hand-held slit lamp or equivalent. In the conduction of drug/device development programs, hand-held slit lamps are generally preferred to table-mounted instruments for the efficient evaluation of a large number of laboratory animals which, with the exception of NHPs, are typically unanesthetized. Furthermore, laboratory species generally have skull conformations and behavioral traits that are poorly suited to examination using fixed table-mounted devices. Examinations are performed using high-beam illumination (as tolerated) and a magnification level suitable for identification of aqueous or vitreous cells in the species being examined (typically 10 × to16 × ). Diffuse illumination is used to survey the adnexa and ocular surface and evaluate the pupillary light reflex (PLR); and illumination with a slit beam is used to critically evaluate the anterior segment structures and anterior media (aqueous humor, lens, and anterior vitreous). The slit beam is set to a default width and height of 0.2 and 12 mm, respectively, with the beam angled at ∼30°–45° to the eye's vertical axial (90°) meridian. Note that at high magnification (eg, 16 × ), the examiner will not visualize the full-beam height passing through the anterior segment of the eye, unless the species being examined has a vertical corneal diameter (VCD) ≤12 mm. In those species, beam height is decreased accordingly.
Pupillary light reflex
Scoring of the PLR is similar to those of M-S and H-M, but incorporates an additional score (“3”), specifying miosis as observed with anterior uveitis, or as a class effect of certain drugs (eg, topical prostaglandin analogs or pilocarpine in dogs), complicating evaluation of pupil function. Dyscoria (misshapen pupil) is also incorporated into scoring criteria to include both functional and structural pupil abnormalities (eg, postinflammatory posterior synechia) as causes for slow or absent PLR.
Conjunctiva
Scoring divisions for the conjunctiva (eg, congestion, swelling, and discharge) are identical to those of M-S and H-M. However, previous criteria described for scoring of ocular irritation were largely developed to accommodate toxicity evaluation of nonpharmaceutical products. Furthermore, conjunctival schemes in those systems were specifically developed for recording observations in albino rabbits. In the case of conjunctival hyperemia (synonymous with “conjunctival congestion”), this is problematic since the rabbit's primary conjunctival vasculature follows a distinctly perilimbal anatomical distribution, producing clinical patterns of congestion whose characteristic features are not necessarily shared by other species. Therefore, SPOTS criteria for conjunctival hyperemia and swelling (chemosis) in rabbits have been slightly modified to more accurately denote features of irritation and reactivity commonly observed in modern ocular drug and device development. Additionally, new criteria have been added to describe patterns of conjunctival hyperemia applicable to nonrabbit species (Table 1 and Fig. 1). Scoring criteria for conjunctival discharge remain largely unchanged, but a score of 3 has been modified to specify the presence of discharge beyond the orbital rim, providing an anatomical landmark to more clearly distinguish it from an adjacent score of 2.
Corneal opacity and fluorescein staining
As in the systems of M-S and H-M, a corneal opacity [any lesions(s) reducing normal corneal transparency] and fluorescein staining are each assigned two scores, one for severity and the other for area affected. However, previous criteria describing severity of these lesions are complex, incorporating multiple descriptive features for an individual score. For example, individual scoring criteria for corneal opacity severity in the M-S and H-M systems differentiate scores based on both increasing loss of transparency and anterior to posterior (A-P) lesion distribution within the cornea. Similarly, criteria for fluorescein staining severity differentiate scores based on both description of increasing staining intensity as well as distribution. For both parameters, however, the features comprising each score may not always be clinically observed as described, complicating the examiner's ability to identify and ascribe a single score. Furthermore, the A-P distribution features described for corneal opacities in these systems, while often applicable in the evaluation of topically applied substances or drugs, may not correlate with the range of ocular responses observed following intraocular injections or other modern routes of administration. It must also be noted that opacity severity may vary across a single cornea depending on the route of drug administration or location of an intraocular device, features not accounted for in previously published systems.
The SPOTS scheme for corneal opacity severity is defined solely by opacity density (loss of transparency and obscuration of underlying anterior segment structures) without consideration of depth or distribution within the cornea. This simplifies and improves clarity of the clinical observations and, in our group's experience, promotes improved consistency across observers in a single study. For capture and documentation of other important lesion features such as stromal distribution, association with altered corneal thickness, or lesion color (eg, blue discoloration with corneal edema), the examiner should incorporate a clinical diagram. An additional option is to enhance the information contained in diagrams of any anterior segment finding(s) by incorporating standard color codes as previously published 14 (Fig. 2).
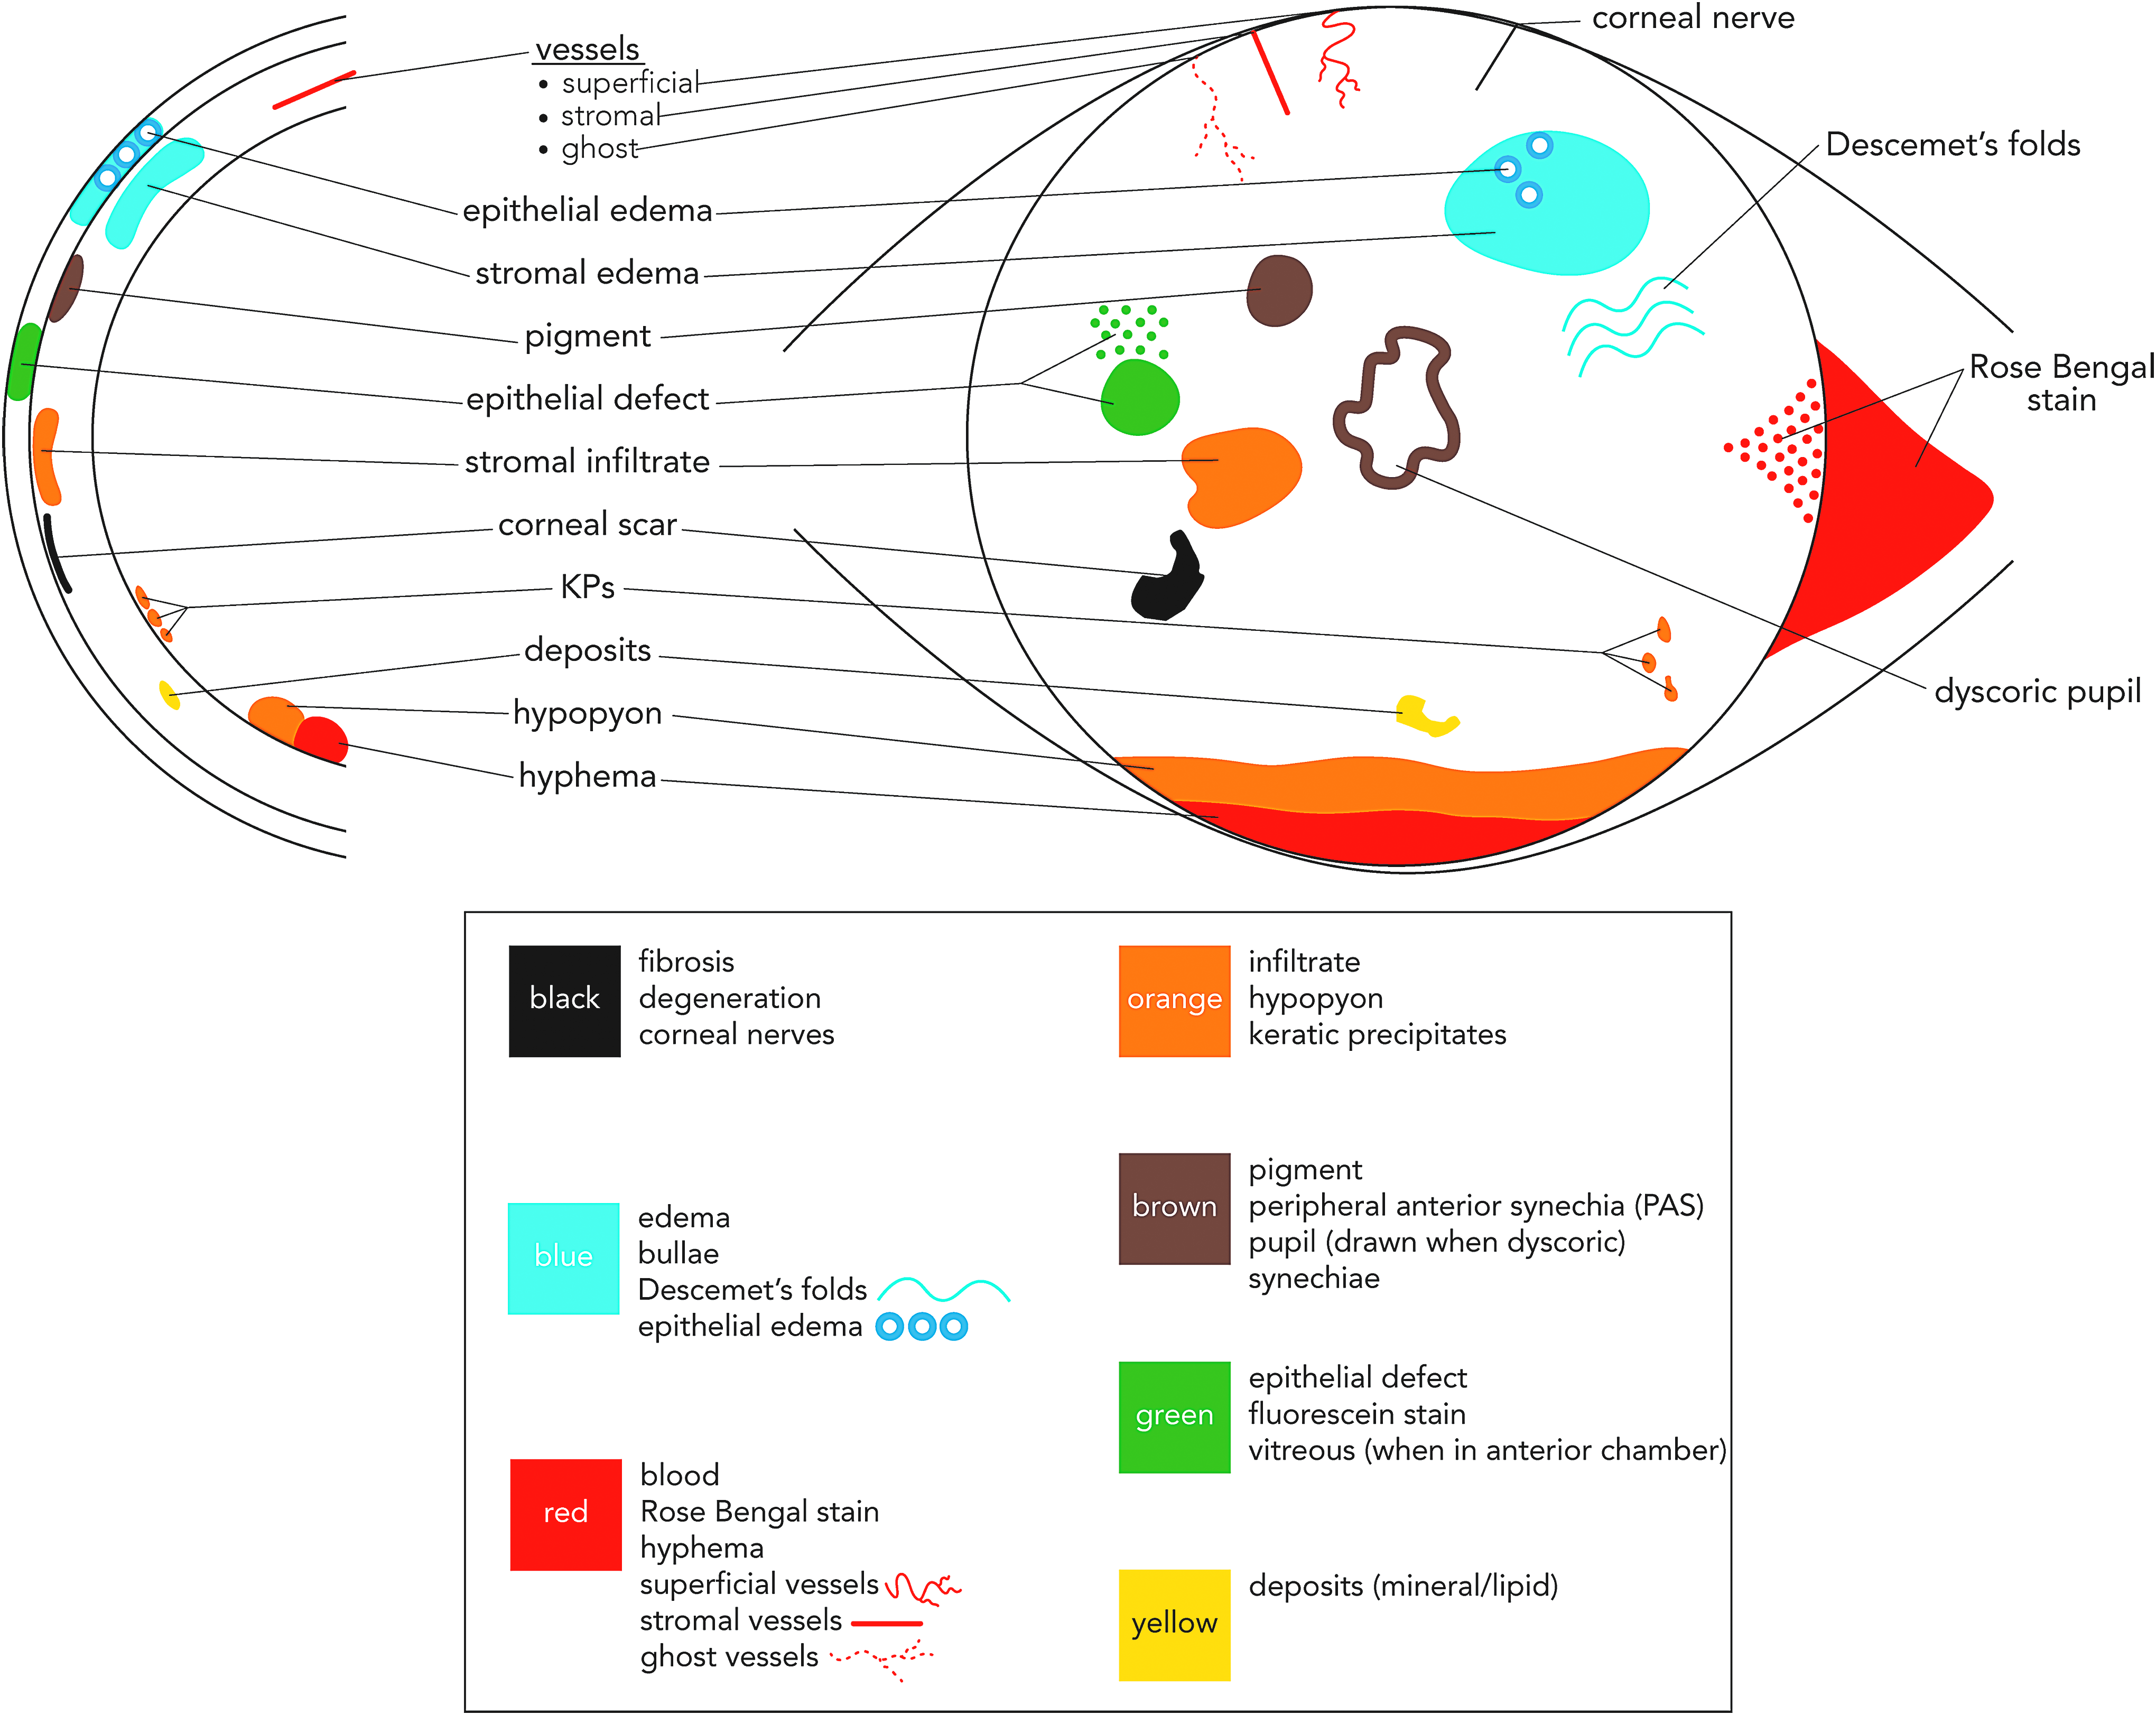
Example of corneal and anterior segment lesion diagramming using a modified standardized color-coding system. 14
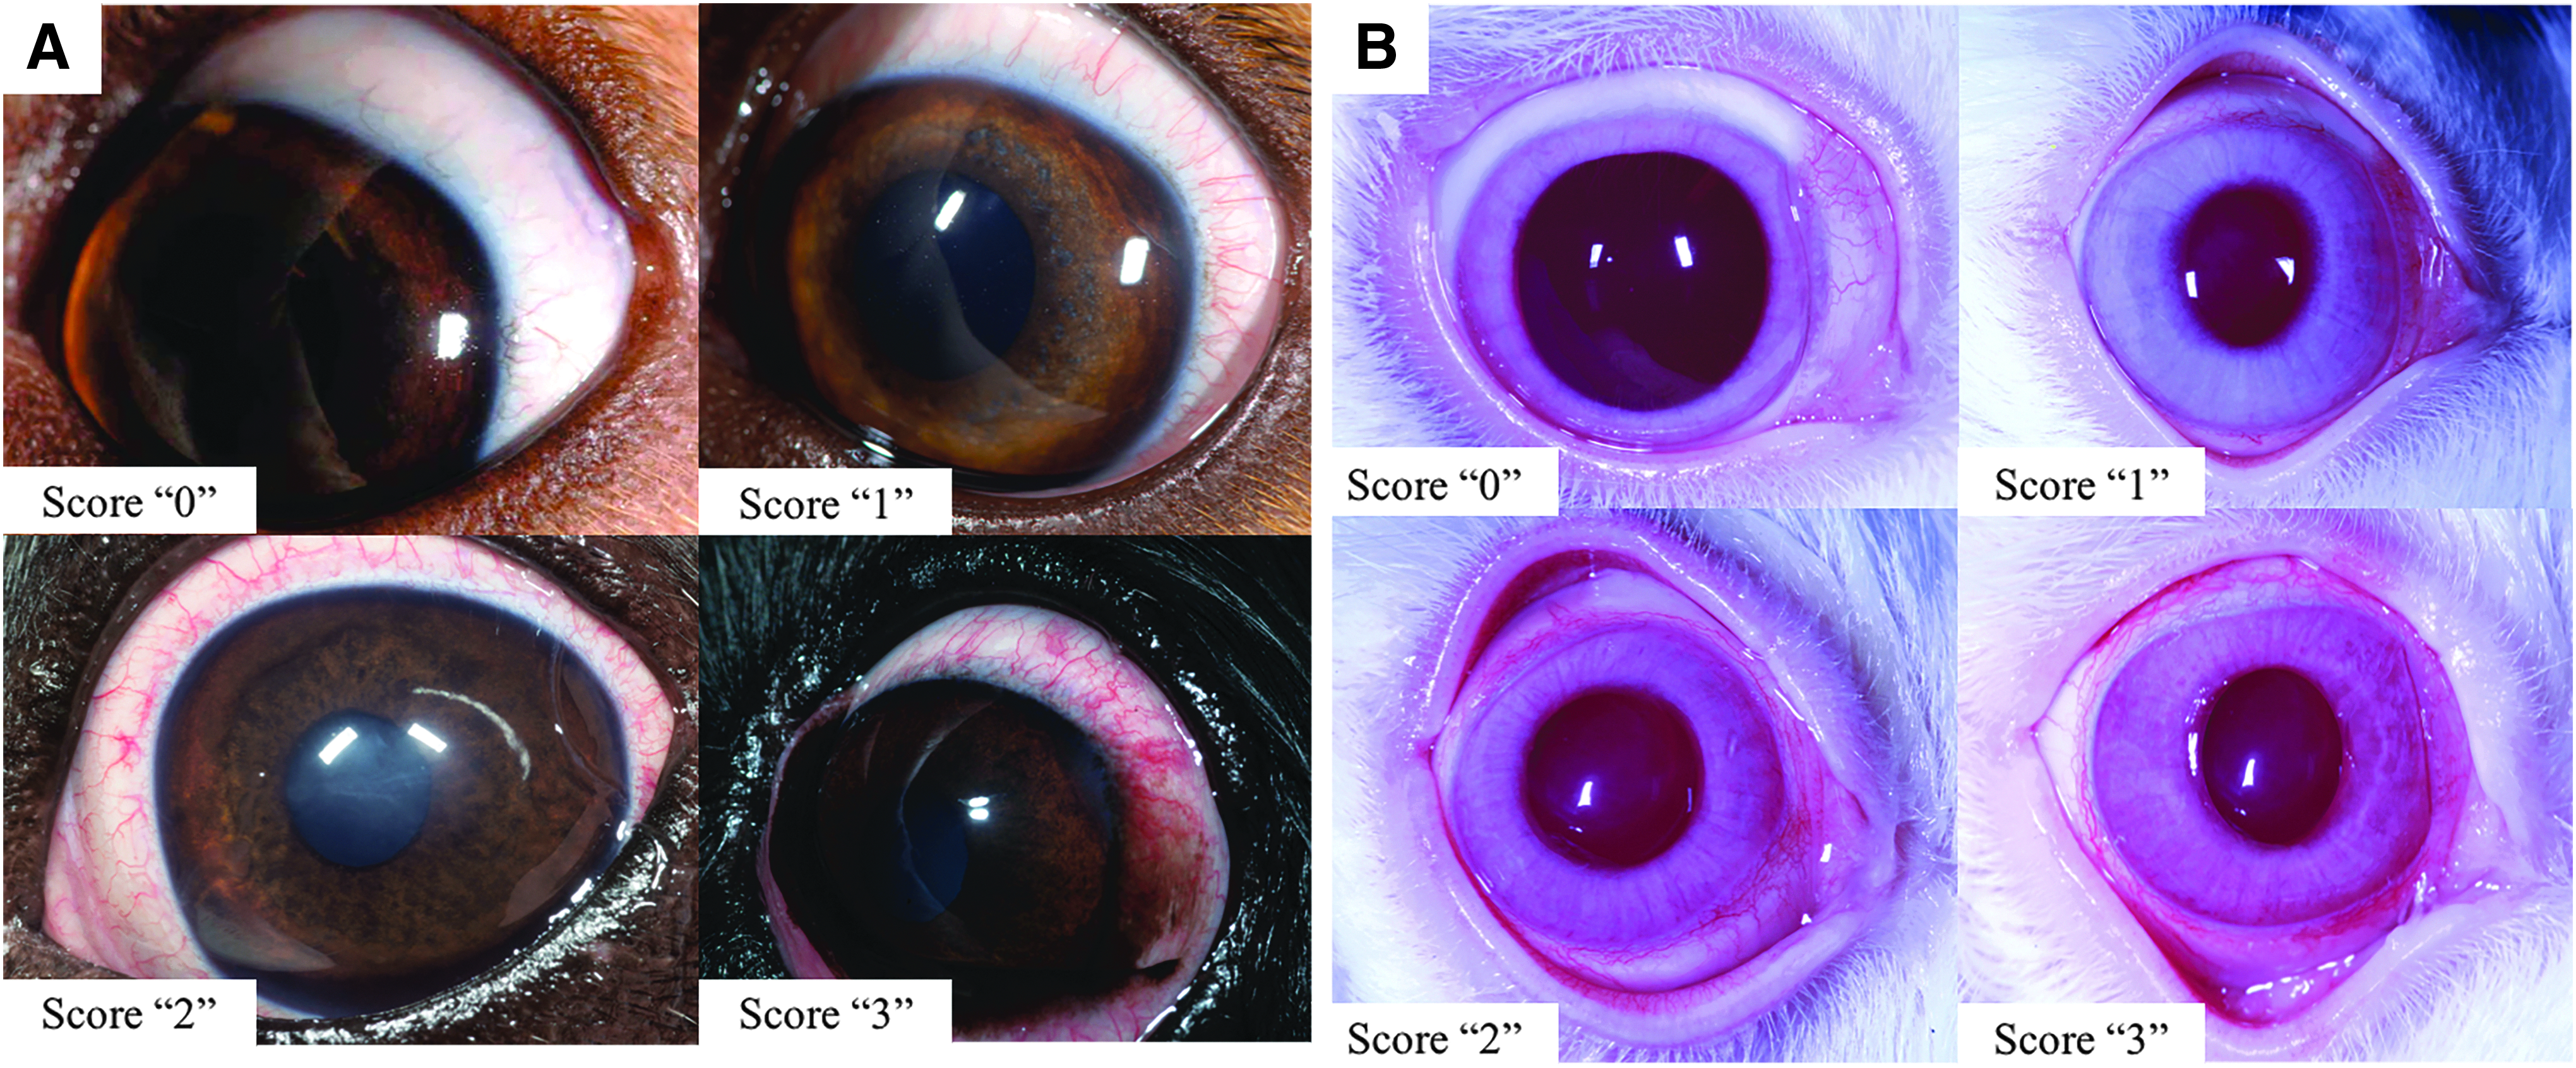
For fluorescein staining severity, SPOTS schemes correspond to increasing severity of corneal surface disease and/or ulceration, ranging from slight to mild corneal epithelial damage/loss of intercellular integrity, to complete epithelial loss, and finally to both epithelial and stromal loss. Compared with M-S and H-M, this scheme provides clearer distinction between scores, and in the context of topically applied ophthalmic drugs, better distinguishes more minor clinical corneal epithelial toxicity (Score ≤“2,” Fig. 3) from more severe forms. As for corneal opacity, diagramming of stain retention is recommended to provide information about its distribution, intensity, or other characteristics (Fig. 2).
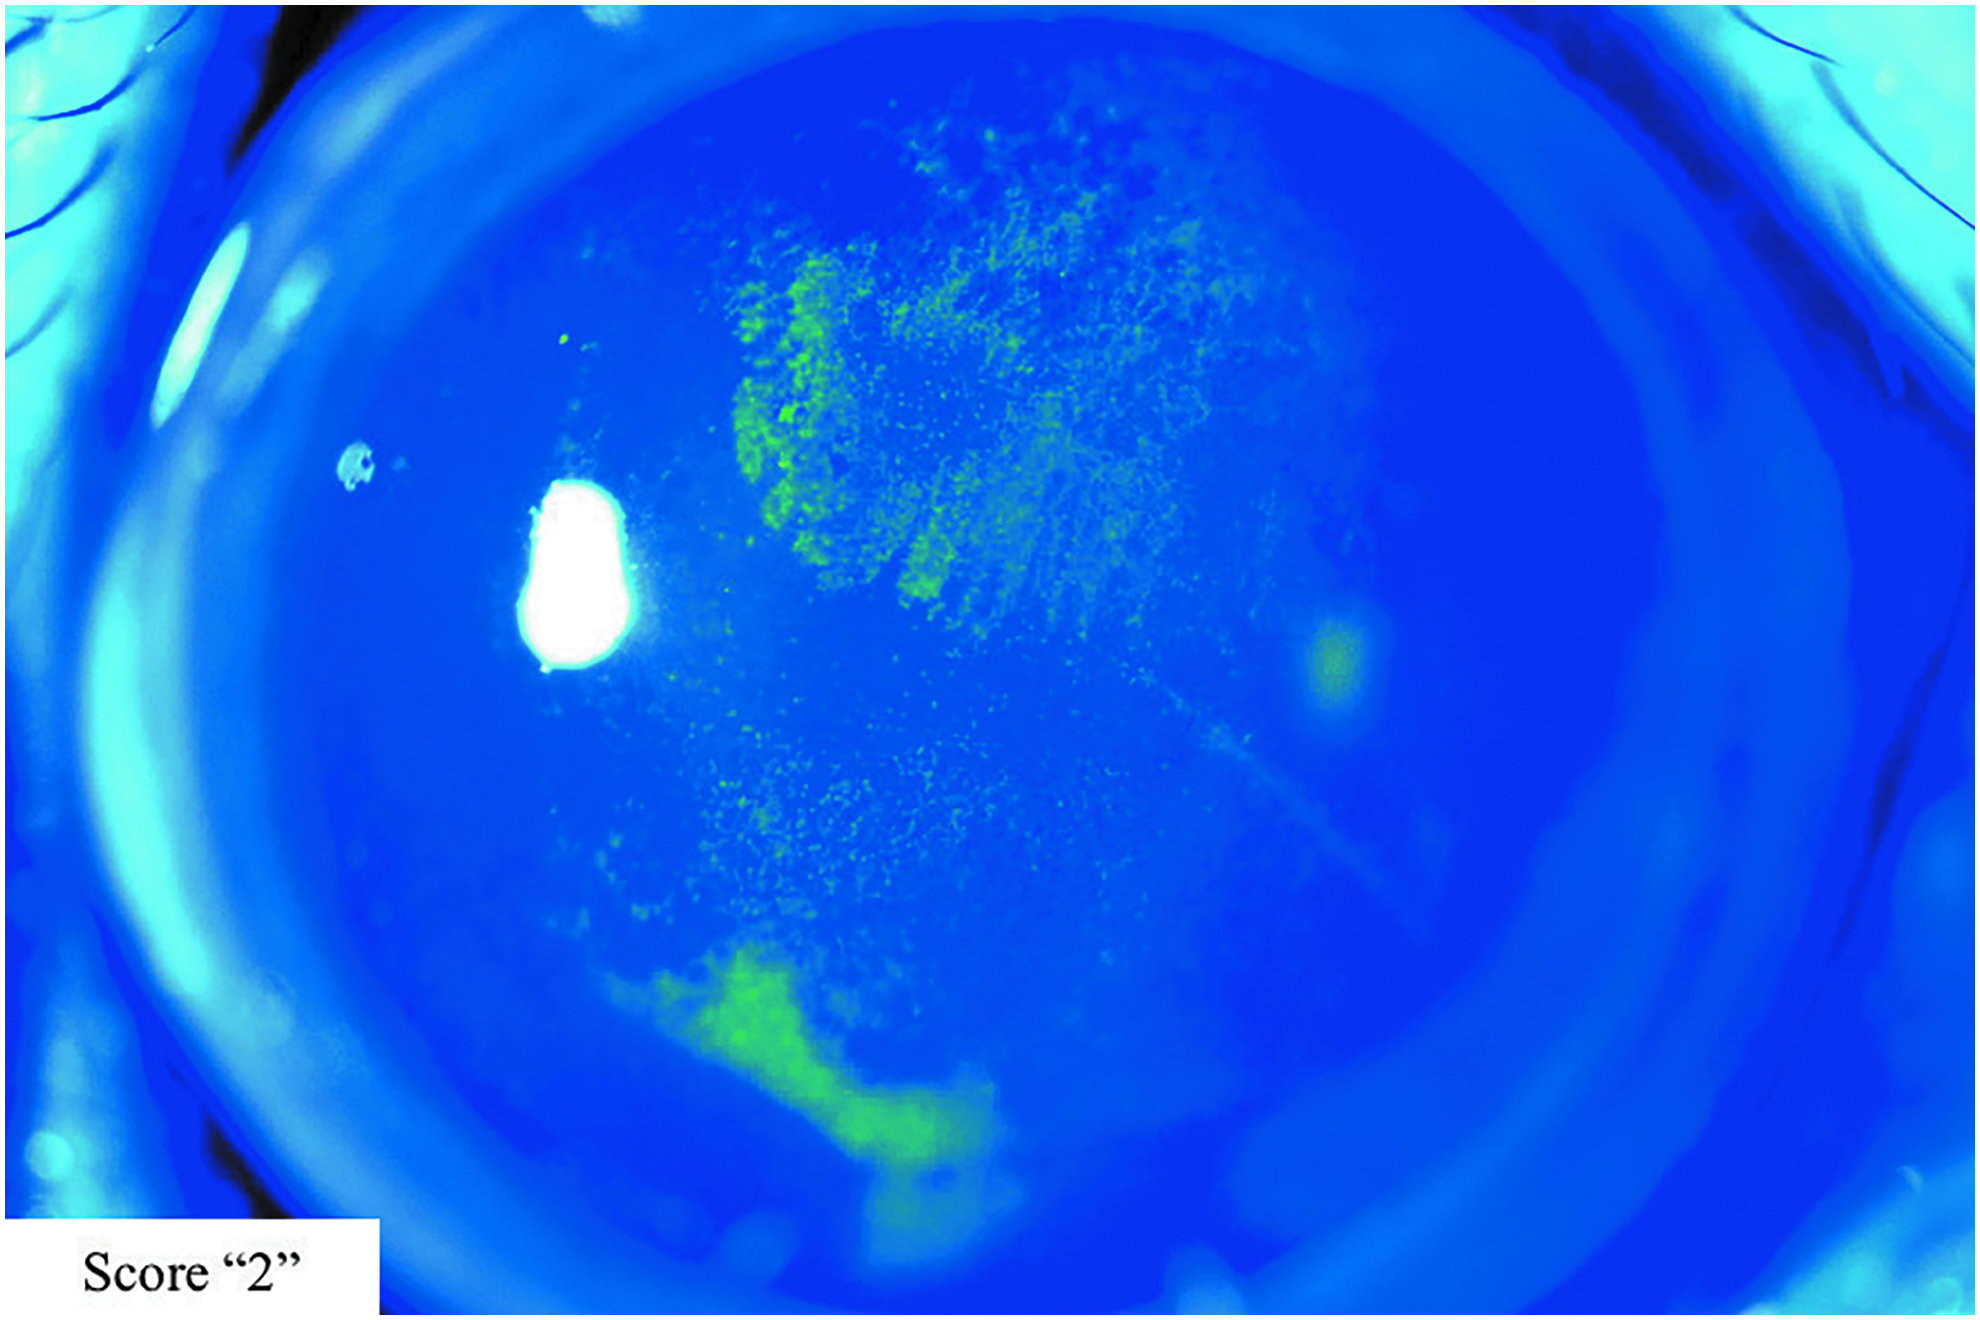
Photographic exemplar demonstrating criteria characteristic of a score “2” for fluorescein staining severity using the SPOTS system (NHP image presented). NHP, nonhuman primate.
The assigned severity score for corneal opacity or fluorescein staining should correspond to the most severely affected area (the area with the highest score), accompanied by a diagram to characterize the distribution of multiple lesions. For both corneal opacity and fluorescein staining, scoring schemes for lesion area are identical to M-S and H-M.
Corneal vascularization (pannus)
Corneal vascularization schemes are slightly modified compared with M-S and H-M. It is noteworthy that the term “pannus” bears different clinical meanings in physician-based and veterinary ophthalmology. While in physician-based ophthalmic practice, pannus refers to any nonspecific vascular infiltration of the cornea, canine pannus is frequently used in veterinary ophthalmology to identify a specific immune-mediated disease (also known as chronic superficial keratitis or Überreiter's syndrome), characterized by progressive fibrovascular, lymphocytic, and plasmacytic infiltration of the cornea.15,16 In the context of preclinical drug and device development programs, the more nonspecific definition of pannus, as employed by physicians, is more appropriate for lesion description. The M-S and H-M systems differentiated vascularization scores using criteria that included descriptions of both vessel length and distribution. As with corneal opacity and fluorescein staining severity scoring, however, the features of both may not always be observed together in the clinical patterns described. Thus, the SPOTS system scores corneal vascularization solely on the basis of vessel length to reduce ambiguity.
Aqueous (AC) flare
The systems of M-S and H-M designated 4 scores for aqueous flare (AC protein) ranging from “0” (no flare) to “3,” based on increasing visibility of a Tyndall effect within the AC as well as the apparent density of flare relative to the optical density of the adjacent lens. The SUN system designates 5 scores for flare, ranging from “0” (no flare), to “4” [intense (fibrin or plastic)], with scores corresponding to faint, moderate, and marked flare in between. Like M-S and H-M, the SPOTS system utilizes the optical density of the lens as a scoring reference. In the collective authors' experience, however, flare exceeding the optical density of the lens is rarely observed in laboratory animals in toxicology studies, even those with severe anterior uveitis; thus, a maximal aqueous flare score (“4”) is defined as “approaching the optical density of the lens.” Lesser scores are defined in a similar manner to those described in M-S and H-M and based upon Tyndall visibility in the AC, range from mild (“1”) to moderate (“2–3”). In addition, the SPOTS system incorporates a sixth score (“0.5” or “trace”), describing low-grade Tyndall effect visible only with careful scrutiny by a highly experienced examiner using a slit lamp. Severity of aqueous flare is a hallmark feature of breakdown of the blood–aqueous barrier due to inflammation or test article effect, so the SPOTS scheme enhances the identification of often subtle differences in aqueous flare associated with different test articles and their formulations. The SPOTS system also clarifies that the presence of AC fibrin does not unequivocally correlate to a maximal flare score as indicated by SUN, as resorbing fibrin can be observed in tandem with lower scores for flare. Furthermore, it is recommended that fibrin or aqueous cellular constituents (eg, hyphema, hypopyon) be diagrammed by the examiner (Fig. 2) to not only capture their extent but to also facilitate longitudinal monitoring.
Aqueous (AC) cell
Like aqueous flare, the presence and severity of aqueous cell is a critical marker of anterior segment inflammation in humans17,18 and animals4,19–21; and scoring of this primary inflammatory response is critical in safety and efficacy evaluations of modern ophthalmic pharmaceuticals and devices. Modern routes of administration include topical routes and direct delivery of the test article (in solution, suspension, or integrated into a variety of biomaterial platforms) into the subconjunctival, AC, vitreous, suprachoroidal, and subretinal spaces.22,23 Aqueous cell is absent from the majority of scoring schemes developed for laboratory animals, including those of M-S and H-M.2,4 The SUN system's scheme for AC cell scoring in human patients is frequently adopted for scoring in laboratory animals, but the predictive value SUN provides to monitoring human patients is more limited in laboratory animals by species-related differences in ocular anatomy and ocular reactivity.24,25
It needs to be noted that species-related differences in anterior segment geometry (eg, corneal curvature, AC depth, anterior lens curvature) heavily influence the volume (and percentage of the total AC volume) sampled by a slit beam as documented in a recently published analysis (Fig. 4). 24 In species with larger AC dimensions, the volume of aqueous sampled by the slit beam can be up to 100% greater than those of humans. Similarly, dramatically smaller aqueous volumes are sampled in small-eyed animals such as rodents. 24
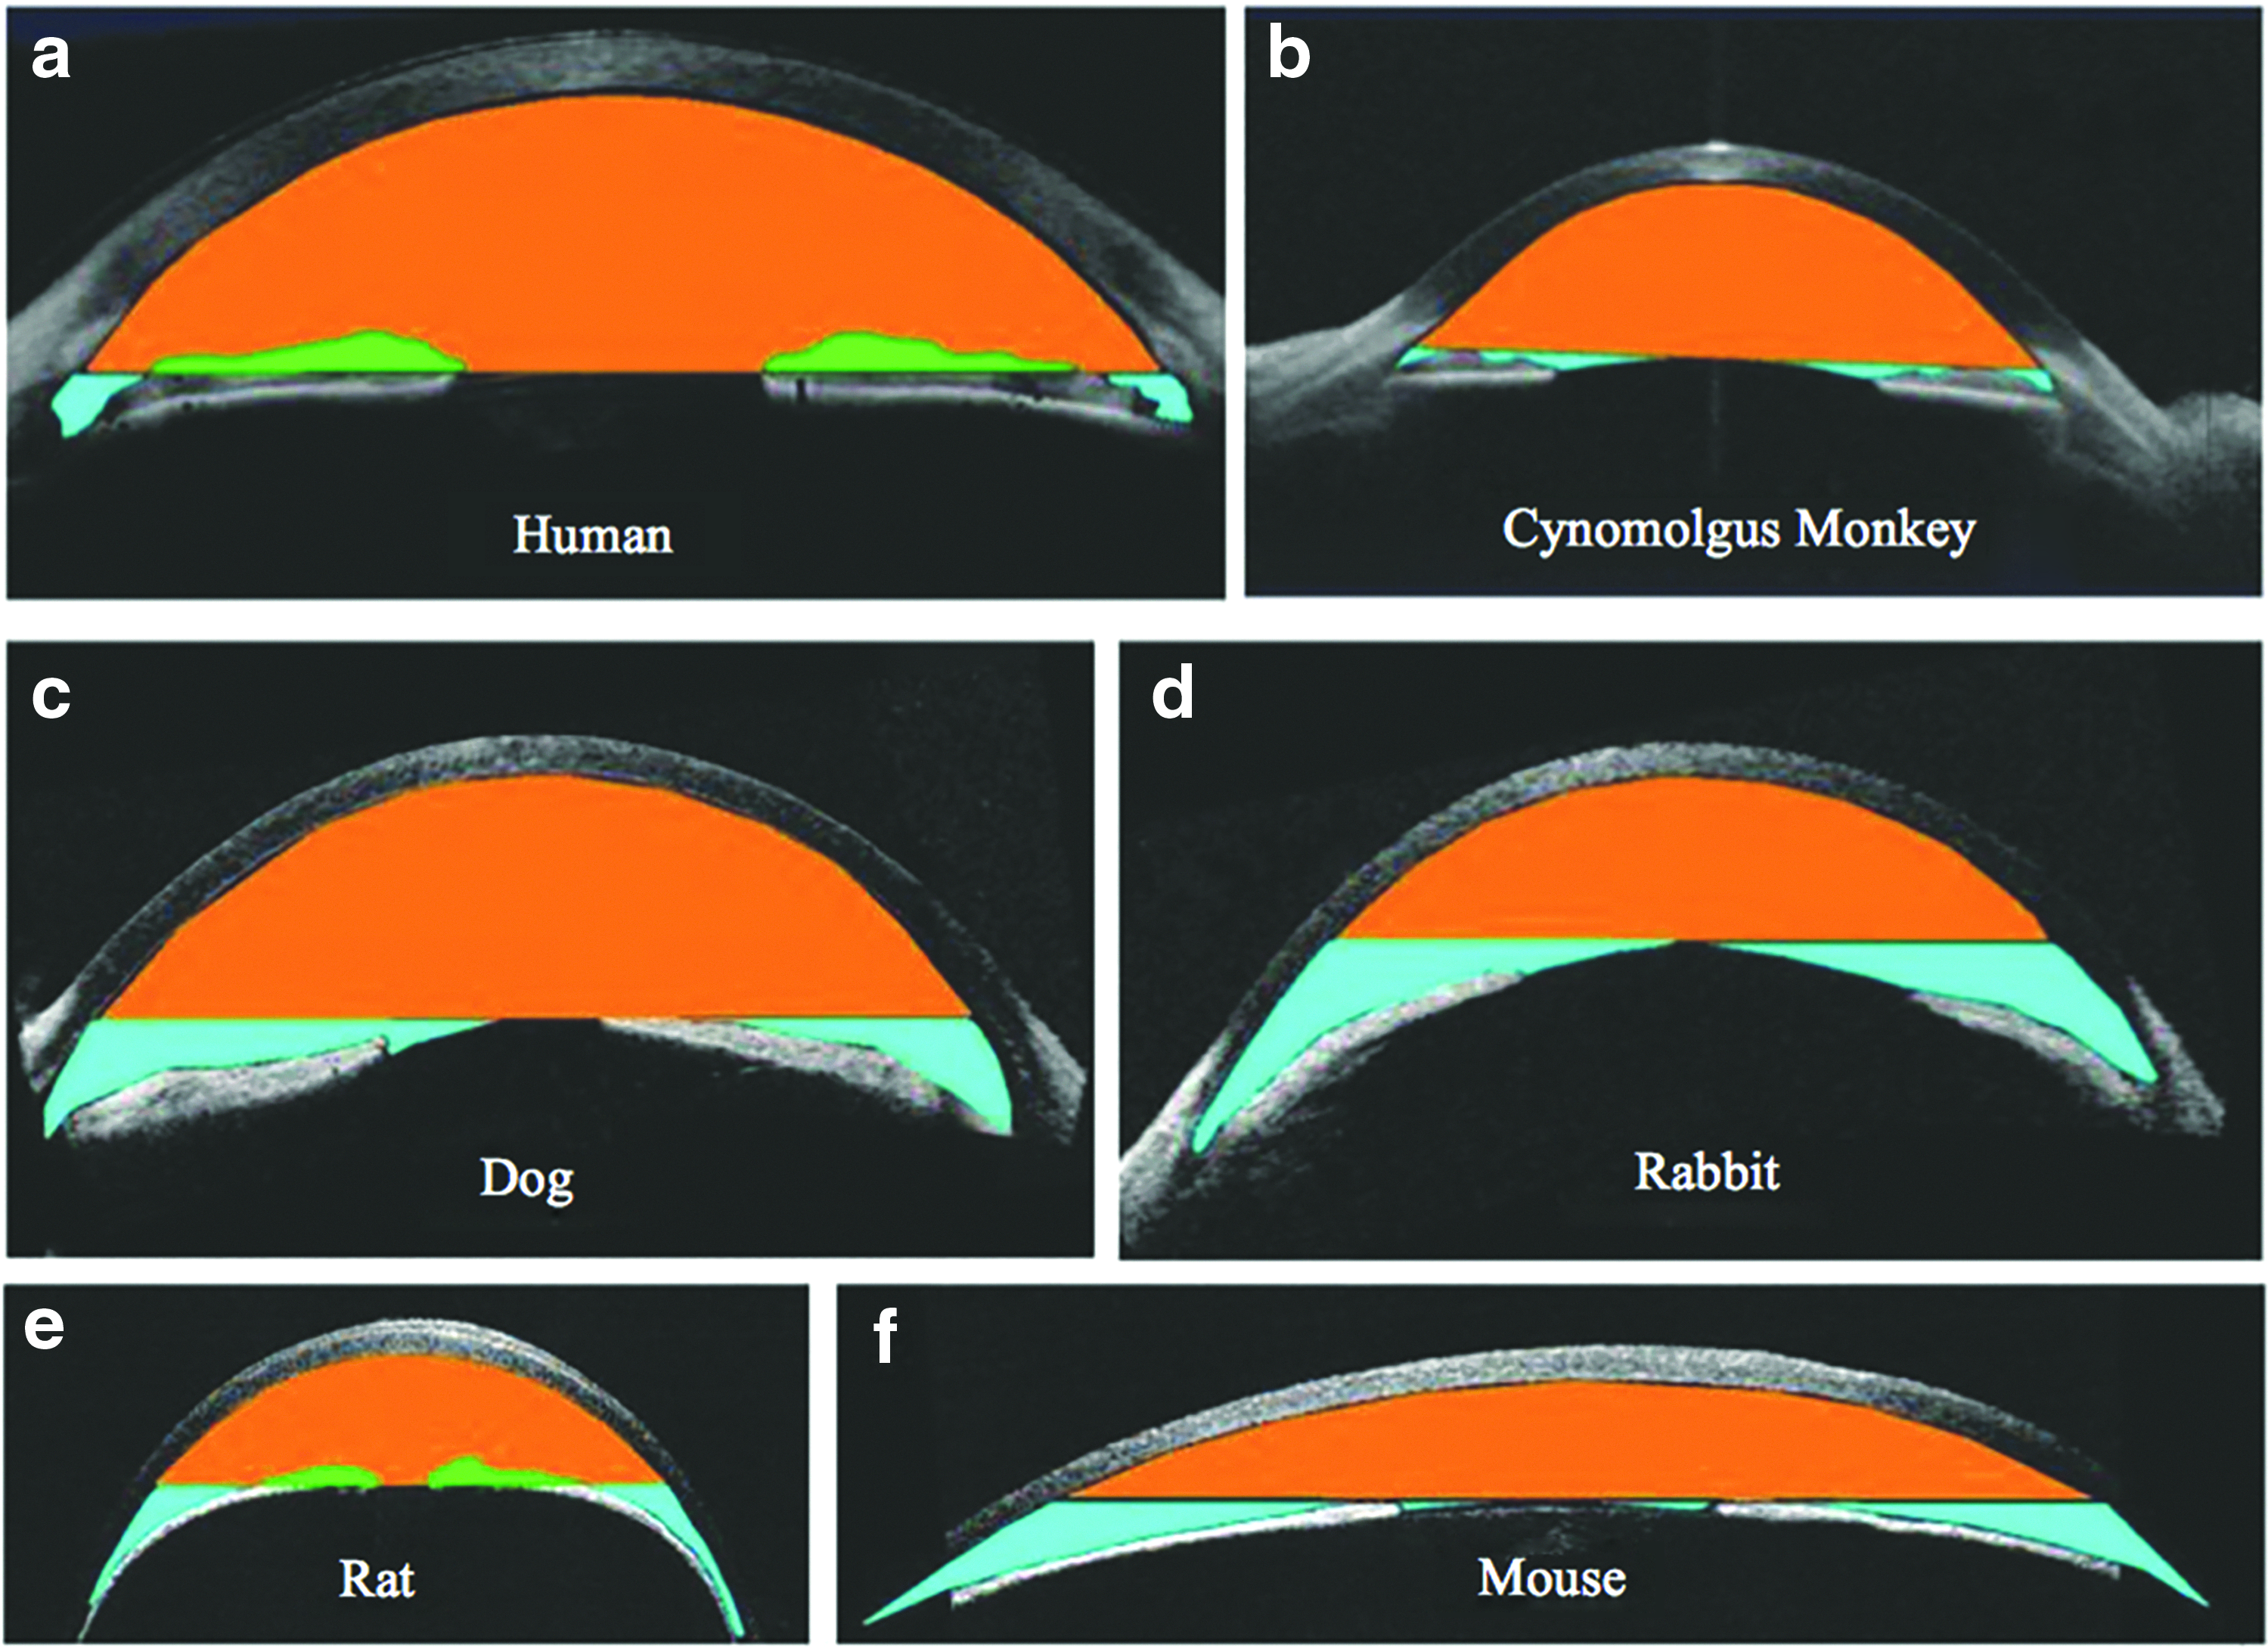
Comparative optical coherence tomography (OCT) images of comparative axial cross-sectional anterior segment geometry in the human
Acknowledging the results of this analysis as well as established species-related differences in ocular reactivity, 25 the AC cell value corresponding to SUN's highest score for human patients often prematurely tops out when used to quantify AC cells in drug safety evaluations using laboratory species. Therefore, the SPOTS system uses comparatively higher cell numbers for scores “1” through “4.” This enables examiners to better stratify anterior inflammatory responses between different drug formulations or when evaluating for dose-related inflammatory responses, across the entire spectrum of laboratory species.
In addition to assigning a score for AC cell number, examiners should always indicate the predominant cell color as observed using the slit lamp. Documentation of the predominant cell color may provide information as to their source and type (eg, infiltrating inflammatory cells, erythrocytes, or melanocytes liberated from the anterior or posterior uvea). Cell color is noted as mixed color or as predominantly white, predominantly brown, or predominantly red, with a color being considered predominant when it accounts for ∼75% of cells observed. In pigmented animals, these data can be useful in distinguishing between observation of cells associated with the test article or the procedure used to introduce it. With the latter, cells in the AC are typically transient and predominantly white in color; and in the vitreous, cell color is more commonly brown or mixed and only observed at minimal (trace) levels. The nature of these observations, however, can vary depending on other characteristics of the injection procedure, the test article, and individual animal variability.
Iris involvement
The SPOTS scheme for iris involvement (synonymous with iris congestion or iridal vessel injection) is similar to M-S and H-M, ranging from “0” to “4” depending on the severity of vessel injection, and the presence or absence of other structural features such as iris swelling or rugosity. However, M-S and H-M also include descriptions of vascular features specific to albino rabbits. For example, both systems indicate that the normal iris (score of “0”) may include secondary and tertiary vessel hyperemia “occasionally around the 12:00 to 1:00 o'clock position near the pupillary border and the 6:00 to 7:00 o'clock position near the pupillary border.” The terminology in the SPOTS system, therefore, has been reduced to refine scoring criteria to descriptions of vessel involvement and iris swelling only (Table 1 and Fig. 5). It needs to be noted that identification of secondary and tertiary iris vessels is difficult to impossible in pigmented strains or species, and may require species/strain-specific modifications to the scoring system.
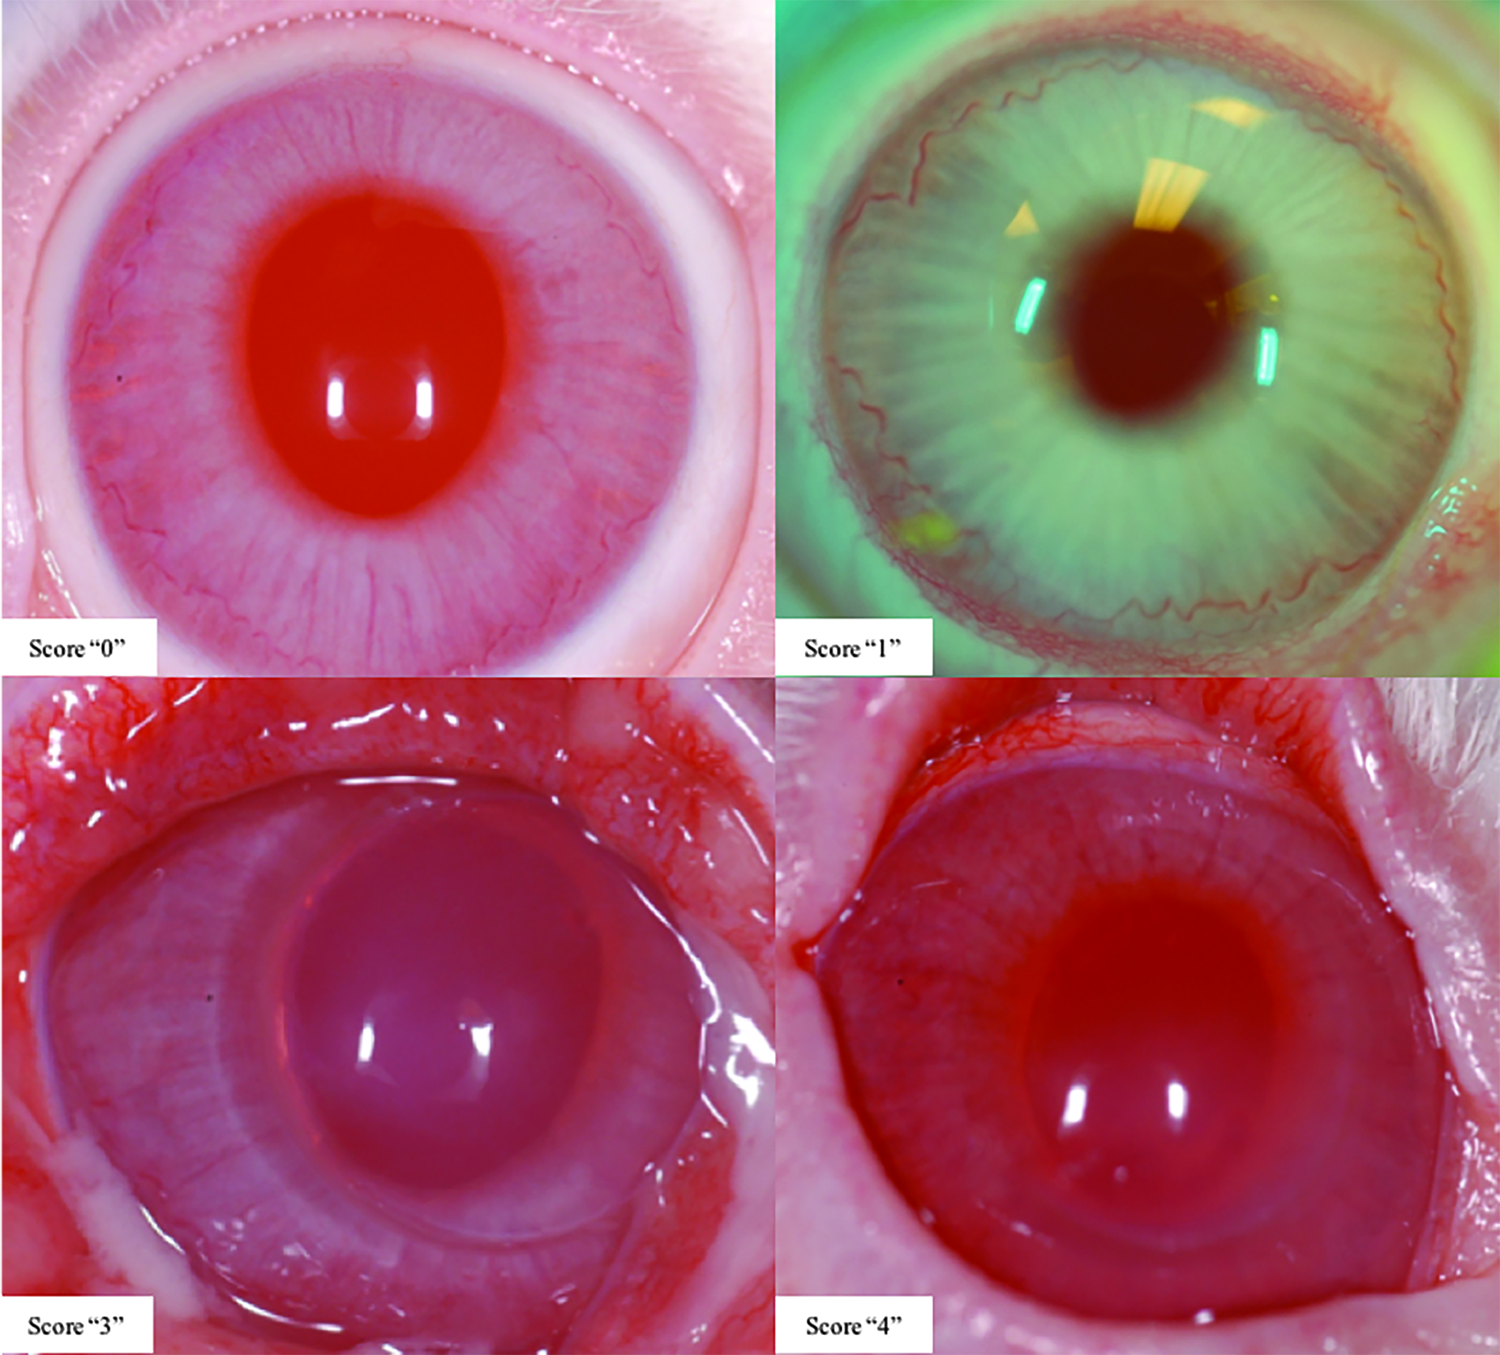
Photographic exemplars demonstrating iris involvement scoring criteria using the SPOTS system (albino rabbit strain images presented). Notes: No exemplar is presented for Score “2”; and the conjunctival swelling and/or congestion seen in images representing Scores “3” and “4” are findings often observed in association with moderate to severe intraocular inflammation, though incidence and severity may differ depending on study-related factors or individual animal variability.
Anterior vitreous cell
The slit lamp biomicroscope can be used to evaluate the anterior vitreous for opacities or inflammatory cells. Slit lamp-based vitreous cell scoring schemes, however, are not widely described in the preclinical literature, despite being commonly observed in eyes of animals undergoing intraocular drug or device delivery (particularly after administration to the posterior segment). The SPOTS system incorporates a scheme for vitreous cell scoring, employing the same semiquantitative criteria used for scoring of AC cells (ranging from “0” to “4”). Cell color is also noted using the same descriptive terminology as for AC cells.
Lens opacity
Lens opacities are scored according to a scheme similar to that of H-M, differentiated according to location within the lens (eg, anterior or posterior capsular or cortical, nuclear, equatorial, etc.). In addition, the SPOTS scheme recommends a description of lens opacity size, ranging from punctate to complete or resorbing. Diagramming of lens opacities, especially when multiple lesions are observed, is highly recommended to facilitate longitudinal monitoring and interpretation.
Section II. Posterior Segment Scoring
Unlike scoring for the anterior segment, the SPOTS system does not specify instrument settings for examination and scoring of the posterior segment. Nonetheless, scoring of the posterior segment is most effectively (and efficiently) performed using indirect ophthalmoscopy with an adjustable headset and condensing lens. Clinical examiners at OSOD recommend beginning with a Volk 2.2 PanRetinal™, 14D, or 20D lens for NHPs; a 28D lens for dogs, pigs, and rabbits; a 40D lens for rats; and a 60D lens for mice. If a lesion is observed, additional scrutiny is recommended using indirect lenses of lower dioptric power for increased magnification [including a 14D or 5.5D (macular) lens in larger-eyed species], as well considering the use of a Welch Allyn PanOptic™ ophthalmoscope and/or direct ophthalmoscope (or equivalent). When interpreting the characteristics of a lesion(s), it should be noted that the actual lateral and axial magnification perceived by the observer is directly influenced by the dimensions of the globe being examined. 26 The lower inherent magnification of larger eyes, for example, will topographically flatten a lesion's ophthalmoscopic appearance; therefore, this lesion would be attributed greater clinical significance compared with the same lesion in a small eye with higher magnification.
In addition to the use of numeric assignments, documentation of posterior segment lesions should be complimented using a clinical diagram. Similar to drawings of the anterior segment, valuable additional information can be captured through incorporation of diagrams using published standard color coding schemes. 27 In our collective experience in examining subretinal dosing sites with a variety of test articles, OSOD members have routinely incorporated diagrams in tandem with ocular scoring to characterize their ophthalmoscopic appearance, spatial distribution, and degree of retinal elevation. Together with diagramming of retinal lesions en face, diagramming of lesions or IVT test articles in sagittal drawings is also recommended to accurately record lesion/test article shape, size, and location within the vitreous, facilitating longitudinal comparison and monitoring (Fig. 6). When diagramming the posterior segment, examiners must also remember that all features and lesions observed using indirect ophthalmoscopy are reversed and inverted and take care to accurately record/illustrate findings in their anatomically correct orientation.
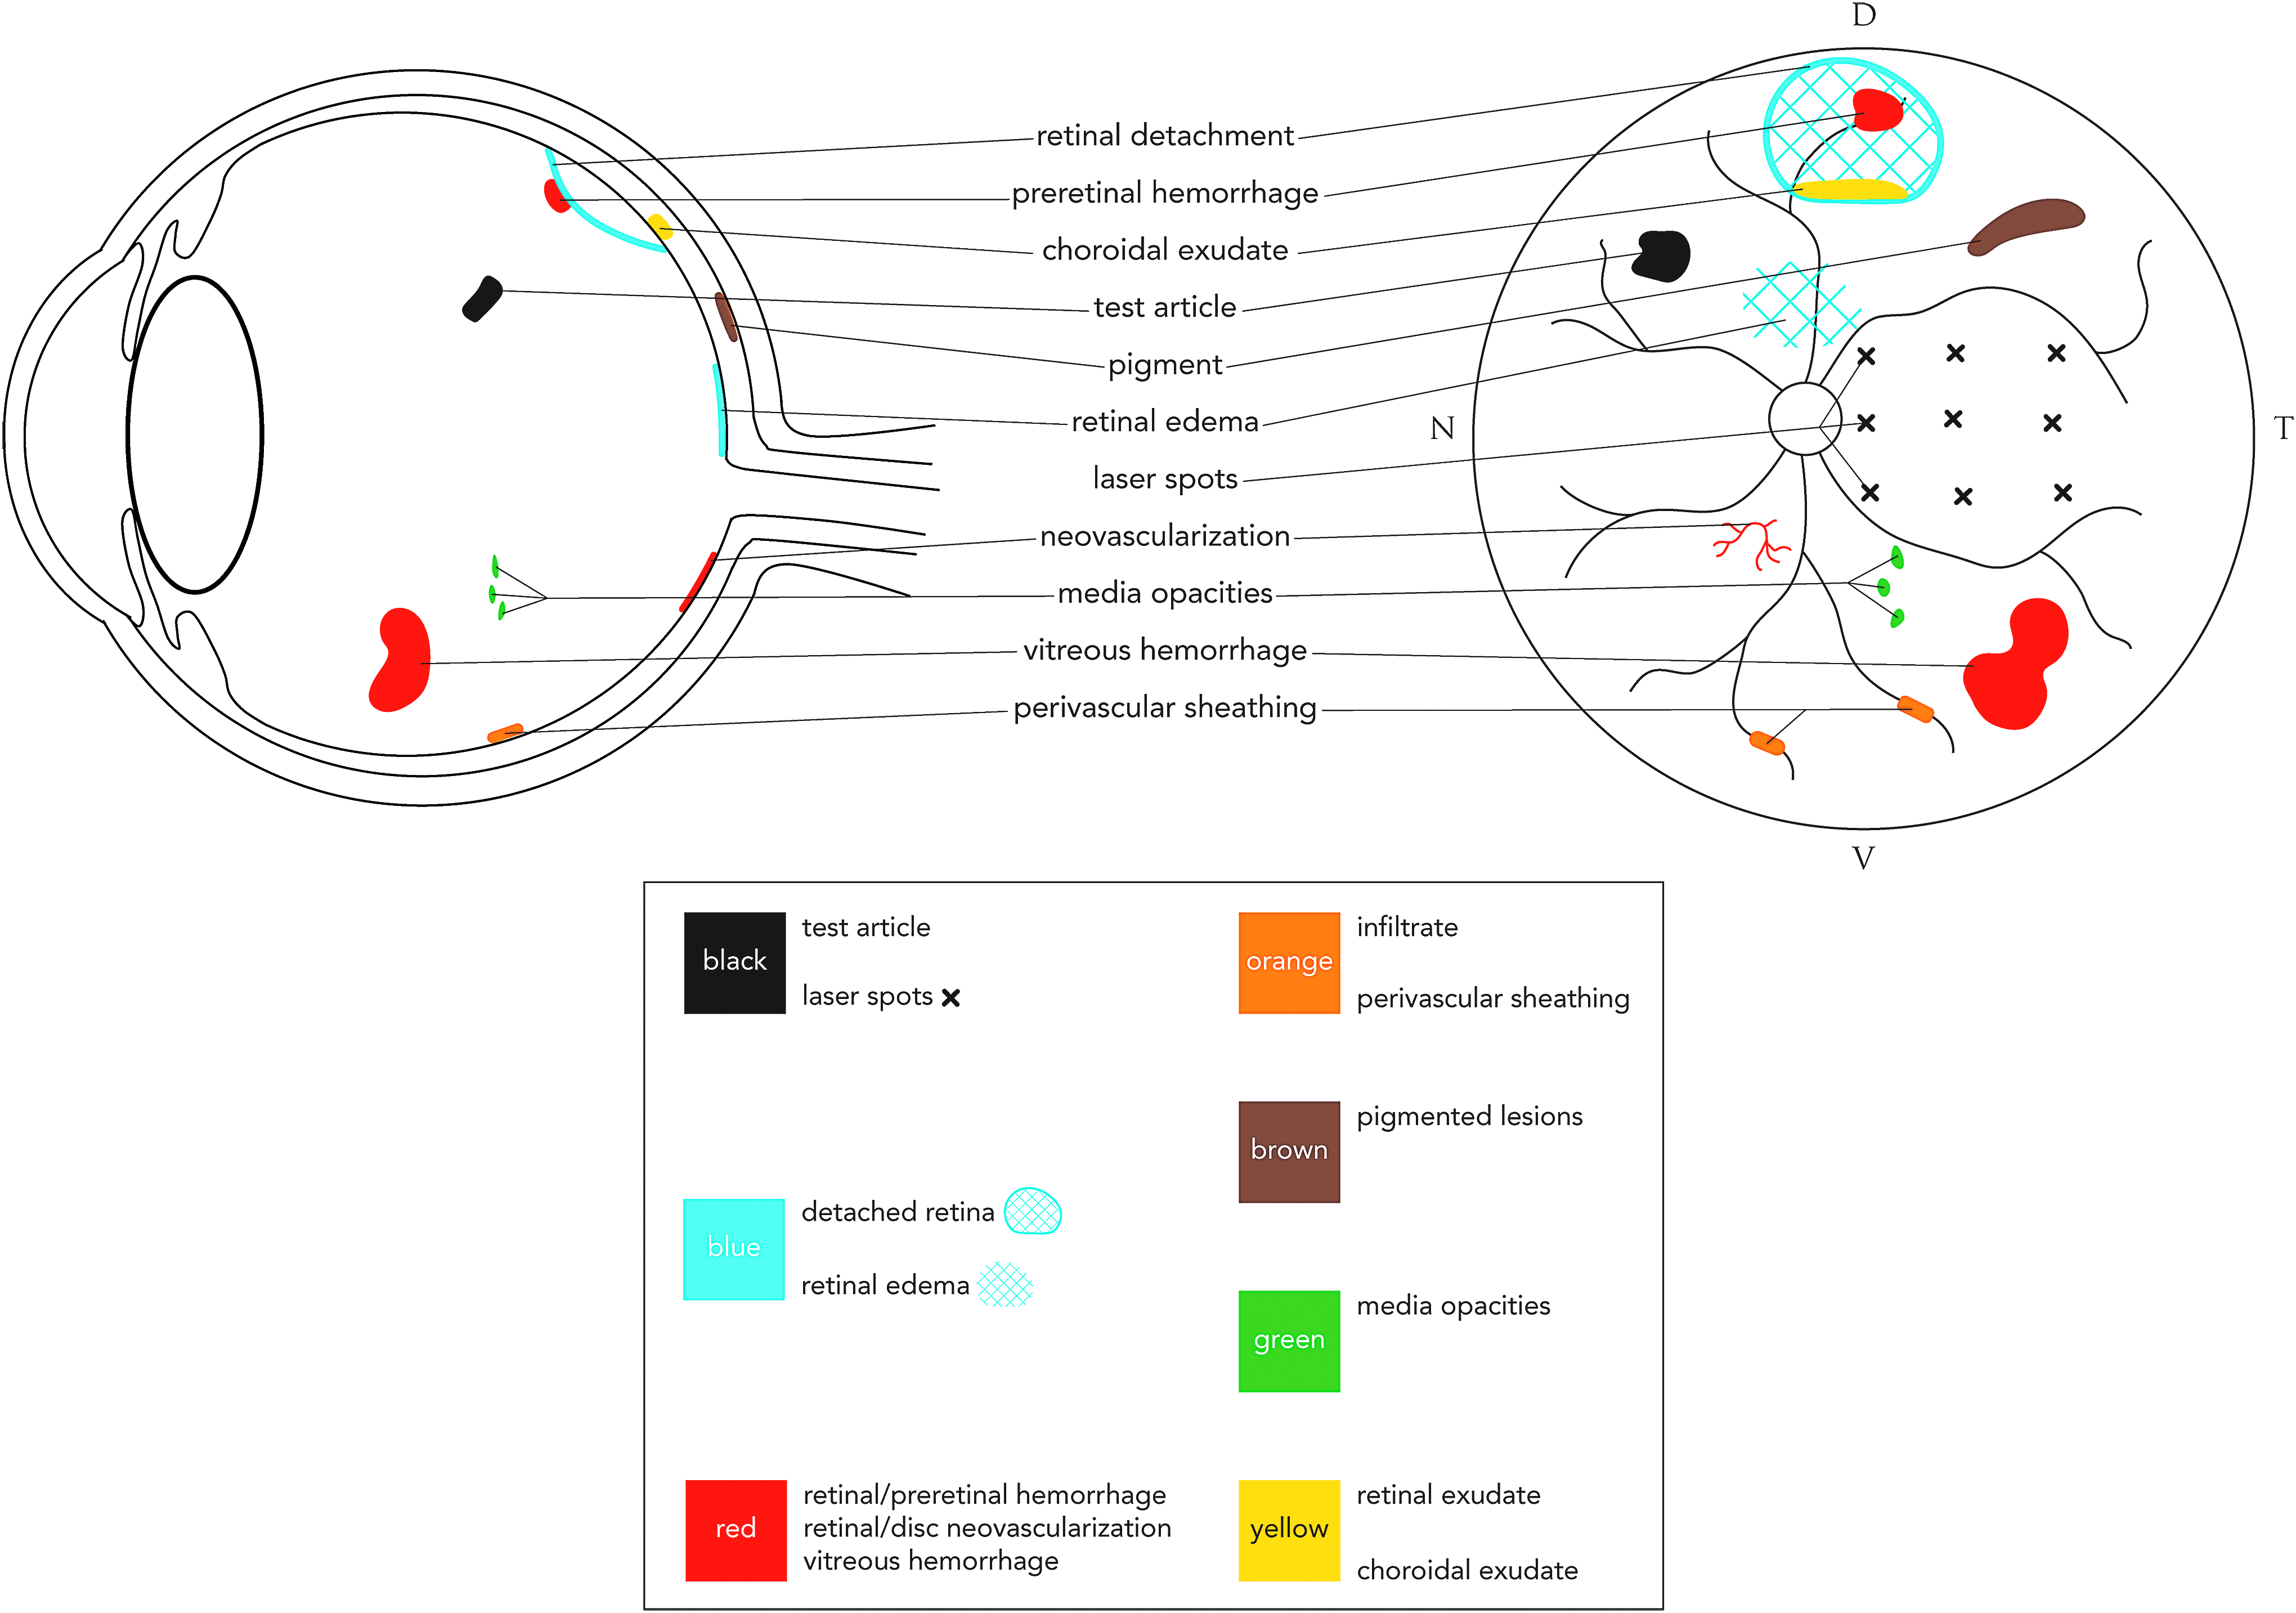
Example of posterior segment lesion diagramming using a modified standardized color-coding system. 27 The en face diagram here presents lesions in the context of anatomical features of the NHP fundus (eg, holangiotic retinal vascular pattern and macula). Lesions depicted comprise those typically observed in preclinical studies involving the posterior segment, including the grid of macular/perimacular laser-induced lesions observed in animal models of choroidal neovascularization.41–44 Diagrammatic features may vary depending on the anatomical variations and specializations in fundus anatomy of the species being examined (eg, merangiotic vascular pattern in rabbits, presence of a tapetum lucidum in dogs, and lack of a true macula in most laboratory species). While green is conventionally used by vitreoretinal physicians and surgeons to represent vitreous hemorrhage, our system has adopted red instead to disambiguate documentation of the lesion in different laboratory species. [D = dorsal (interchangeable with superior), V = ventral (interchangeable with inferior), T = temporal, N = nasal].
Vitreous haze
Vitreous haze can be a useful indicator of posterior segment inflammation, as observed by Nussenblatt et al. at the National Eye Institute (NEI) when they described photographic standards for scoring in human patients. 28 This finding is also observed in association with posterior segment inflammation in laboratory species.29–31 The SPOTS system adopts and slightly modifies the NEI criteria with 6 scores ranging from “0” to “4” (including “0.5” or “trace”), corresponding to increasing degree of blurring and obscuration of the optic disk and retinal vasculature (Fig. 7).
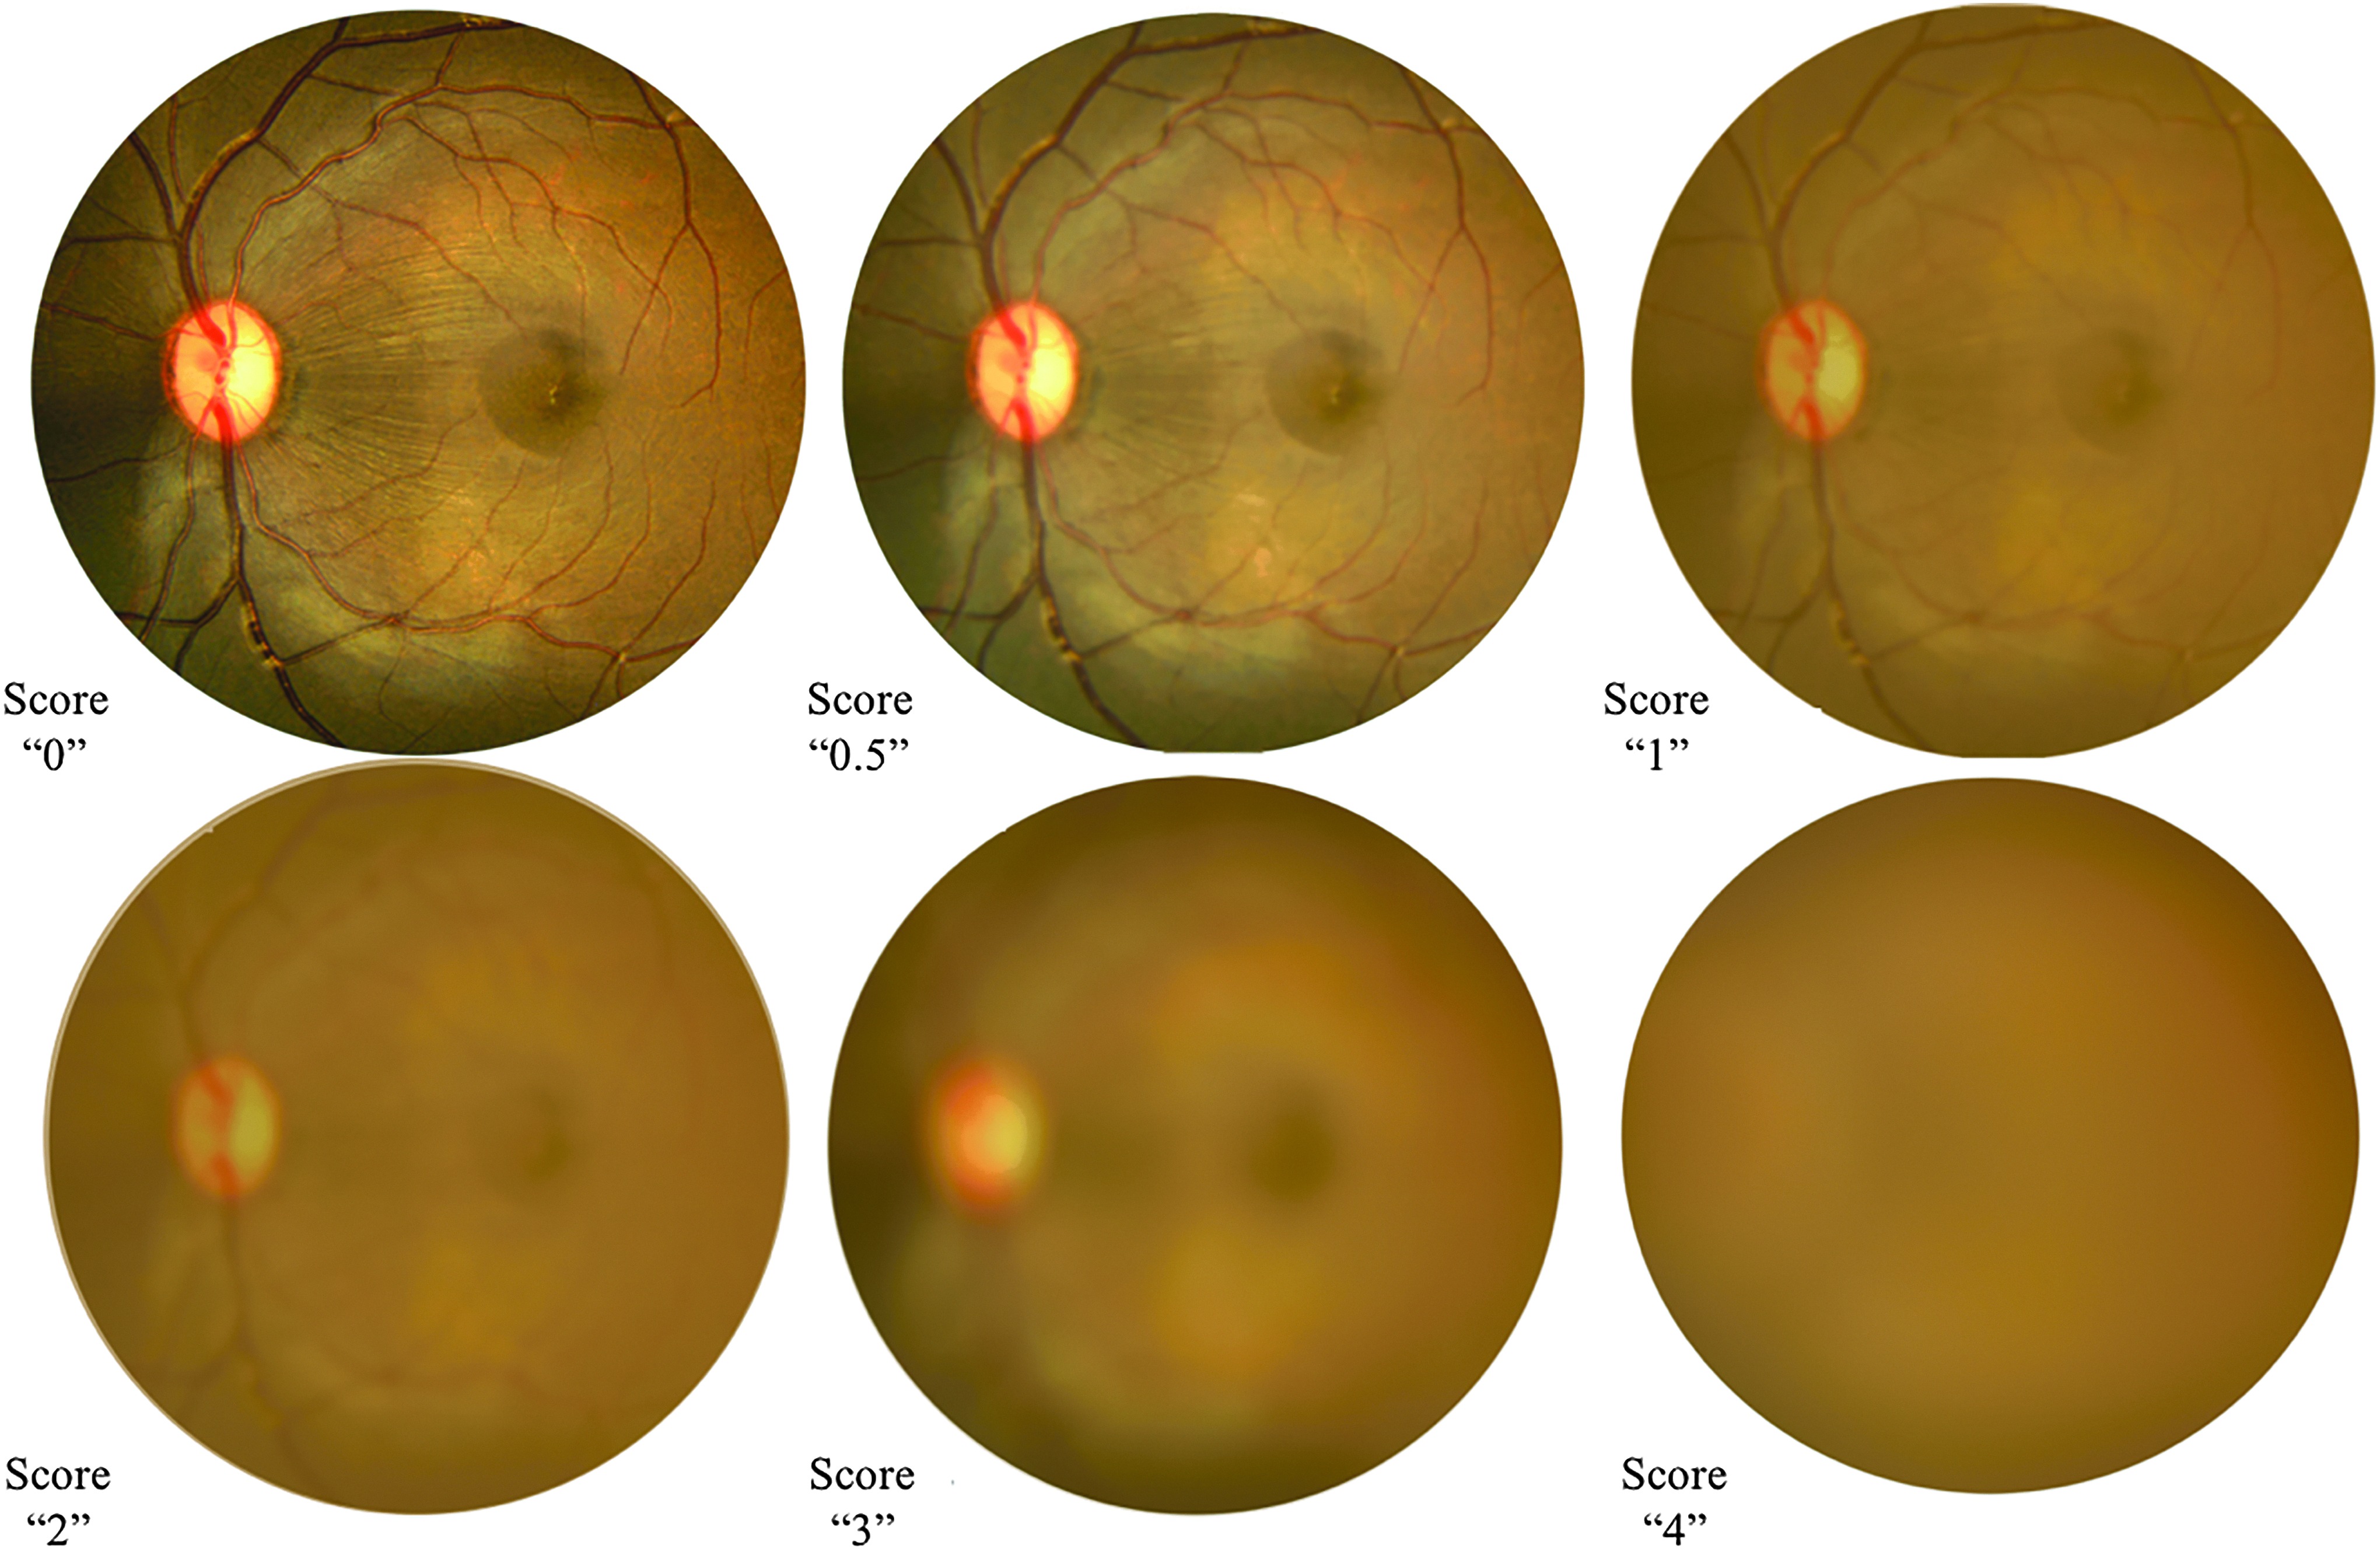
Photographic images simulating vitreous haze scoring criteria using the SPOTS system (NHP fundus images presented).
Degraded fundus view
Uncommonly scored by published systems for laboratory species, degradation of fundus view indicates general loss of visible detail when examining the posterior segment with scores ranging from “0” to “3,” corresponding to increasing obscuration of details of fundus anatomy. Unlike vitreous haze scoring whose criteria indicate an abnormality confined to the posterior segment, however, any lesion(s) of the optical pathway may contribute to the development of degraded fundus view, including corneal opacification, AC cells and/or flare, AC fibrin, lens opacity, vitreous haze, vitreous floaters, IVT test articles, or any combination thereof. Therefore, scoring of this parameter is not specific for 1 clinical finding, but is more useful as an “area under the curve” indicator of adverse events that affect clear visualization of the retina using ophthalmoscopy. It also serves as a useful guide for gauging the veracity of clinical observations made of posterior segment findings and can assist in reconciling differences that may be found between ophthalmoscopic and histopathological findings in the course of a study.
Retinal perivascular sheathing
Perivascular sheathing (also referred to as “cuffing”) describes the presence of hazy to dense-white infiltrates surrounding segments of retinal arterioles and/or venules, and is unequivocally indicative of posterior segment inflammation (Fig. 8). It can vary in severity and can be transient or progressive with sequential exposures to test articles. The SPOTS system describes scores ranging from “0” to “3,” with descriptive criteria corresponding to density of sheathing as well as area affected, as these 2 parameters typically correspond as severity increases. The clinical appearance of human frosted branch angiitis32,33 is an excellent exemplar of this finding, illustrating the features of moderate to severe perivascular sheathing that can be observed in laboratory species in drug development programs. We have found scoring for this finding to be particularly useful in the assessment of biologics delivered through the IVT route.

Section III: IVT Test Article Scoring
IVT delivery is a popular modern route for delivery of drugs or devices intended to treat the eye's posterior segment, with a growing body of research supporting the development of novel IVT delivery systems and material platforms to optimize and sustain the delivery of therapeutics in patients with degenerative retinal diseases. 22 Semiquantitative scoring and diagrammatic documentation of these test articles, therefore, can provide valuable data regarding the behavior and fate of these agents as they can disperse, migrate and/or dissolve, and in some cases, have the potential for interfering with vision. Furthermore, migration into the AC presents the possibility for anterior segment toxicity and/or impairing aqueous outflow. Clinical characterization of IVT test articles is most commonly achieved using indirect ophthalmoscopy, although slit lamp biomicroscopy can complement assessment of test articles in the anterior vitreous. While fundus photography can be used as a complimentary endpoint, clinical scoring should be based upon examination characteristics observed three dimensionally.
IVT test article scoring requires the examiner to assign up to 2 numerical scores to describe a test article's appearance and distribution. Scores for appearance correspond to the general opacity of the test article, whereas distribution scores describe a range of appearances corresponding to the test article's shape and profile on ophthalmoscopic observation. Diagramming of test article appearance, location, and distribution is important as it facilitates longitudinal monitoring, documentation of test article behavior in vivo, and interpretation of accompanying examination findings.
The SPOTS-Modified SUN Scoring System for AC Cells
The SUN System was originally described in 2005 to improve and standardize the diagnostic terminology and scoring schemes used in the evaluation of human patients with naturally occurring uveitis (Table 2). 1 As previously published systems for laboratory animals did not include schemes for AC cells, SUN's scoring scheme has become increasingly applied to studies involving laboratory animals. 3 Furthermore, the use of a common system between preclinical studies and human clinical trials offers the promise of enhanced translatability of preclinical drug safety evaluations.
Scoring of AC cell using the modified SUN scheme is performed using the following slit lamp settings: 0.1 mm beam width, 10 mm beam height, 30–45° beam angle, and 10–16 × magnification.
All AC cell scores should be accompanied by one of the following notations of cell color: predominantly (∼75%) white, mixed color (∼50% white, 50% brown and/or red), predominantly (∼75%) brown, or predominantly (∼75%) red.
The SUN scoring scheme for AC cells and aqueous flare specifies use of a 1 × 1 mm slit beam, easily achieved on table-mounted instruments. However, creating these precise beam dimensions using a hand-held slit lamp is generally a challenge. We note that a 1-mm circular beam aperture has recently become available with the Kowa SL-17 hand-held instrument, but this does not exactly mimic the dimensional value of a 1 × 1 mm square beam. To best approximate the optical section created using SUN's settings with the most widely used hand-held instruments, the SPOTS-modified SUN system specifies use of a beam measuring 0.1 mm width and 10 mm height (as determined by carefully measuring the height of the beam using a mm ruler imaged at the plane of focus). Assuming that the eye of the animal being examined allows for imaging of the full beam dimensions, this better approximates the optical section volume produced by the 1 × 1 mm square beam of the SUN system. SUN's ordinal AC cell numeric scores are then used as originally published (Table 2). It needs to be acknowledged that the beam sample volume will differ between species and that the beam area designated by the modified SUN system cannot be achieved in rodents that have a VCD <10 mm. As for the SPOTS AC cell scheme, cell color should be noted with each assigned AC cell score.
Discussion
The SUN, M-S, H-M, and numerous other scoring systems have been widely employed, but are associated with significant limitations in the context of modern preclinical ocular drug and device development. Individually, none integrate the full complement of parameters that would be routinely evaluated by slit lamp examination (see Table 1 in our accompanying review of published scoring systems). Furthermore, each system's respective indications, methodologies, and species or strain of interest confound application to the full range of laboratory species and strains currently employed in vision science and ocular drug development. The SPOTS systems described in this study address many of these limitations.
Lack of consistency in slit lamp settings between examiners introduces confounding variability when assessing the anterior segment biomicroscopically, and designation of such settings are lacking in the commonly used systems of M-S and H-M. The SPOTS system specifies hand-held slit lamp settings to ensure consistency in technique and optical section volume evaluated. This is particularly relevant when scoring AC cell density; the SPOTS system offers greater granularity at the lower end of the scale, enhancing differentiation between dose levels of a drug or test article in the range that would likely be clinically tolerated.
Furthermore, AC cell scores using any system are influenced by factors extrinsic to technique and instrument settings. The most noteworthy of these factors is species-related variation in anterior segment geometry, as reported in our group's recent geometric analysis of the effect of anatomy on AC cell scoring using the SUN and SPOTS systems (referenced in that analysis as the “OSOD systems”) in a range of laboratory species. 24 For example, in species with deeper ACs, such as pigs, dogs, and cats, the optical section created by slit beam illumination of the AC samples a comparatively larger volume than in humans or NHPs. As a result, application of the scoring schemes of both SUN and SPOTS-Modified SUN yielded cell numbers in the pig, dog, and cat that overestimated human values (as determined by calculating equivalent volume sampling between species), and cell counts in mice and rats (with much smaller AC depths) that underestimated human values. From these geometric models the analysis presented a set of mathematically derived conversion factors, normalized to the human that can be used to facilitate comparison between species and translation between laboratory studies and human patients. It needs to be noted that while this conversion accounts for numeric scoring on a per-volume basis, it does not account for species variability in inflammatory response to a test article or device.
Developing a scoring system for vitreous cells presents a unique challenge. Although vitreous cells are an important marker of posterior segment inflammation, only the anterior portion of the vitreous can be evaluated biomicroscopically. Intrinsic to sampling of the anterior vitreous is a lack of ability to control for exact depth of view as the slit beam is swept across this region, preventing examination of a specific volume of vitreous. Also, cell dynamics in the vitreous differ than those of the AC in that, once present, cells leave the vitreous more slowly after cessation of dosing. Because of this, vitreous cell number can continue to escalate with sequential dosing while AC cell can peak and completely resolve between doses.
We note that identification and semiquantification of cells in the anterior vitreous does not necessarily reflect the presence (or absence) of the same population in other vitreous regions that cannot be visualized; and a small population of hyalocytes can be observed in normal eyes in some species and can be quite marked as a normal finding in some rabbits. Furthermore, vitreous volume, constituents, and rheology differ considerably between species,34,35 likely impacting the translatability of a system's vitreous cell scoring scheme across species. Additionally, even if species differences in intrinsic cellular response to a given test article could be controlled for, there remains a knowledge gap regarding the influence of differences in intrinsic vitreous chemistry and rheology on cell dynamics in the vitreous. Semiquantification and analysis of these variables is a complicated endeavor, which likely contributes to the paucity of published anterior vitreous scoring systems in the clinical and drug development literature. In the absence of a validated scheme, however, we have found consistent use of a vitreous cell scoring scheme within the context of drug development programs to provide useful comparator data between test articles and between-dose levels of a given test article. It is imperative that the beam width, height, angle, and magnification used for scoring anterior vitreous cell be set and consistently employed throughout a given study.
The anterior segment scoring systems of M-S and H-M, although specifically developed for use in albino rabbits, have been widely and successfully deployed in ocular drug/device development programs. The SPOTS system seeks not to replace the scoring schemes established by these investigators, but instead to expand and refine their pioneering work to improve applicability to multiple species, and to better account for intraocular inflammation commonly encountered in modern ocular drug development programs. The SPOTS system's criteria for corneal opacity and fluorescein staining severity, for example, refine previously published schemes which bear more relevance to ocular irritation associated with industrial products as opposed to ocular pharmaceuticals. Similarly, scoring of aqueous flare using schemes from systems such as SUN, which are designed for naturally occurring uveitis disease in human patients, does not adequately capture the spectrum of findings encountered in laboratory species used in drug development programs. While our accompanying review article documents a wide array of slit lamp-based scoring systems available in the literature, there are remarkably few published scoring systems for the posterior segment. The genesis of many of the preclinical scoring systems was motivated by determining the safety of household, cosmetic, and industrial products, and ocular irritancy scoring was the focus.
There are limitations, principally related to ocular pigmentation in different laboratory species that the SPOTS system currently does not address. For example, the presence of perilimbal melanin in pigmented rabbits and NHPs may hinder scoring of conjunctival hyperemia. Similarly, the presence of melanin in the irides of pigmented laboratory species will obscure view of smaller iridal vessels that would otherwise be visible in albino species. However, as the presence of ocular pigment can have a considerable effect on the pharmacologic properties of ocular drugs,36–39 the Food and Drug Administration currently requires preclinical evaluation of an ocular drug or device in at least 1 pigmented species. 40 Further evolution of scoring systems will likely introduce greater granularity with creation of species- and strain-specific systems. Furthermore, as ocular imaging technologies such as in vivo confocal microscopy, optical coherence tomography (OCT), and Scheimpflug imaging continue to be refined, the objective and quantitative capabilities of these instruments will likely lead to the development of instrument-assisted scoring systems with the promise of even greater reproducibility and translatability. Finally, the systems presented in this study, as well as all previously published systems, focus on consistency of findings within a species/strain and do not directly address the predictive value of findings in any 1 species/strain to human patients.
Summary
The SPOTS systems modify and expand upon previously published ocular scoring systems, leveraging primarily the systems of M-S and H-M as well as the SUN system. The SPOTS systems evolved as an attempt to increase the applicability and validity of these systems to a wider range of laboratory animal species and strains, and incorporate ocular findings commonly observed in preclinical studies involving ocular drugs and devices. Standardization of slit lamp settings and modification of settings to accommodate SUN scoring of AC cell; introduction of novel scoring schemes for AC and vitreous cell; refinement of previous scoring schemes for corneal opacities, fluorescein staining, and aqueous flare; and addition of ophthalmoscopic scoring criteria for the posterior segment and IVT test articles collectively provide a system with enhanced applicability in the context of modern drug development.
Footnotes
Acknowledgments
The authors would like to thank Hugh Wabers and Michael Neider of OSOD, Monica Motta of the Murphy–Russell–Thomasy Laboratory at the UC Davis School of Veterinary Medicine, and the UC Davis Veterinary Ophthalmology Service for providing photographic images for use in this publication; Chrisoula Toupadakis Skouritakis, Director of the Media Laboratory at the UC Davis School of Veterinary Medicine for assistance with figure design; and T. Michael Nork, MD, MS of OSOD and the Department of Ophthalmology & Visual Sciences at the University of Wisconsin–Madison School of Medicine for his input and expertise.
Proprietary Interest(s)
J.S.E.: Veterinary Ophthalmologist, OSOD; P.E.M.: Affiliate Veterinary Ophthalmologist, OSOD; E.B.: Affiliate Veterinary Ophthalmologist, OSOD; S.M.T.: Affiliate Veterinary Ophthalmologist, OSOD; C.J.M.: CEO and Affiliate Veterinary Ophthalmologist, OSOD.
Author Disclosure Statement
No competing financial interests exist.