
Abstract
Purpose:
Mixed eye drops containing 0.5% tropicamide and 0.5% phenylephrine are commercially available for cycloplegic refraction. Determining the pharmacokinetics (PK) and distribution of tropicamide and phenylephrine simultaneously in ocular tissues is an important but challenging issue. Herein, we developed a sensitive and selective ultra-performance liquid chromatography–tandem mass spectrometry (UPLC-MS/MS) method for simultaneous determination of tropicamide and phenylephrine concentrations in rabbit ocular tissues and plasma.
Methods:
The two analytes were extracted with ethyl acetate using etofesalamide as an internal standard and separated using a chromatographic C8 column with isocratic elution. Mass spectrometry analysis was performed with positive electrospray ionization and data were acquired in a multiple reaction monitoring mode.
Results:
We validated this method over a concentration range of 5–1,600 ng/mL for tropicamide and 1–320 ng/mL for phenylephrine in ocular tissues, as well as 0.5–64 ng/mL for both compounds in plasma. Inter- and intraday precisions in all samples were both <12.9% and the accuracy was within 92.1%–108.4%. The highest concentration of tropicamide was found in aqueous humor (Cmax: 29430 ng/g), while was in cornea for phenylephrine (Cmax: 3465 ng/g). All the ocular tissues concentrations were much higher than those of blood.
Conclusion:
This UPLC-MS/MS method allowed us to determine the PK and distribution of tropicamide and phenylephrine in rabbit ocular tissue, which may be helpful in the future development and application of mydriatic agents.
Introduction
Tropicamide is an anticholinergic, parasympatholytic drug that inhibits iris sphincter and ciliary muscle responses to cholinergic stimulation to produce mydriasis of the pupil and cycloplegia when applied to the eye.1–3 The effects occur within 15–30 min and can last nearly 4–10 h, making it preferable to cyclopentolate or atropine for inducing cycloplegia.4,5 Furthermore, tropicamide is similarly efficacious for refractive measurements, but rarely causes systemic side effects, especially in younger patients.6–8 Phenylephrine, a sympathomimetic drug, is a selective α1-adrenergic receptor agonist. It is commonly used as a decongestant, but in ophthalmology it is used to dilate the pupil, though it is relatively weak and has a short-duration.9,10 Tropicamide combined with phenylephrine, a sympathomimetic drug mixed with a parasympatholytic drug, is commonly used clinically to dilate the pupils, and facilitate the examination of the lens, vitreous body, and retina. Previous studies have demonstrated the outstanding efficacy of tropicamide/phenylephrine combination eye drops.11–13
Up to date, only one report has been on the simultaneous determination of tropicamide and phenylephrine in human aqueous humor using high-performance liquid chromatography (HPLC)-ultraviolet method. 14 Unfortunately, this method lacked an effective way to pretreat other types of ocular samples or plasma. Additionally, there was no internal standard (IS), which is necessary for pretreatment of biological samples and samples with relatively high lower limit of quantification (LLOQ). Three methods were developed based on HPLC method to determine tropicamide, but none of them was bioanalysis method.15–17 Several methods have been reported for determination of phenylephrine in biological samples.18–20 However, these methods suffer from large sample volume, long running time, relatively complicated pretreatment, and (or) narrow linear range. Another method has been reported to determine the phenylephrine concentration in plasma using ultra-performance liquid chromatography–tandem mass spectrometry (UPLC-MS/MS). 21 Nevertheless, this method is not suitable for determination of tropicamide concentration because tropicamide has a different polarity than phenylephrine. Moreover, the required 250 μL minimal sample volume is too large for ocular tissue.
With the increasing application of combination preparation in ophthalmic drugs, the study of ocular pharmacokinetics (PK) becomes more and more difficult, not only because of the low bioavailability of compounds and variety of ocular tissues, but also due to the requirement of simultaneous determination of multiple components. In this study, we aimed to simultaneously determine the levels of phenylephrine and tropicamide with high sensitivity and wider linear range, suitable for detection in small-volume and complex ocular tissues. Compared with previously published methods, our method had more advantages, including simultaneous determination of tropicamide and phenylephrine in multiple biological matrix (four ocular tissue and plasma samples), a less sample volume (50 μL), shorter running time (4.5 min), and wider linear range (>300 times). These methods also, for the first time, characterized the pharmacodynamics (PD) and PK profiles of tropicamide and phenylephrine, which provide the basis and a better understanding of their pharmacological effect in clinical application. Moreover, some optimization processes of bioanalysis for two different kinds of compounds were summarized in detail, which might be helpful for development and validation of bioanalysis for other combination ocular drugs in the future.
Methods
Chemicals and reagents
Tropicamide (>99.7% purity), phenylephrine (>99.9% purity), and etofesalamide (>99.9% purity, IS) were acquired from the National Institute for the Control of Pharmaceutical and Biological Products (Beijing, P.R. China). Compound Tropicamide Eye Drops (Zhuobian®, 5 mL) consisting of 25 mg tropicamide and 25 mg phenylephrine were manufactured by Shenyang Xingqi Pharmaceutical Co., Ltd. (Shenyang, China). HPLC-grade acetonitrile (Sigma-Aldrich), formic acid (Dikma Technology Co., Ltd., Beijing, China), analytical grade ethyl acetate, and double-distilled water were used.
Instrumentation and analytical conditions
UPLC-MS/MS analysis was performed on a Waters Acquity UPLC (Waters Co., Milford, MA) coupled with a QTRAP 5500 mass spectrometer with a Turbo V™ source (Applied Biosystems SCIEX, Redwood City, CA). Analyst 1.6.1 software was used for data acquisition and processing. The chromatographic separation was performed on a Waters C8 (100 mm × 4.6 mm, 5 μm) column with a column temperature of 35°C, a flow rate of 0.4 mL/min, a mobile phase containing 0.1% formic acid/water (A) and 0.1% formic acid/acetonitrile (10:90) (B) and an isocratic elution. After 0.8 min, the column eluent was subjected to mass spectrometry analysis using an electrospray ionization (ESI) source. The operation parameters were set as: curtain gas, 35 psi; gas 1, 65 psi; gas 2, 65 psi; ion spray voltage, 4,500 V; and source temperature, 500°C. Precursor/product ion transitions were monitored using multiple reaction monitoring: m/z 168.2 → 150.1 for phenylephrine, m/z 285.2 → 255.2 for tropicamide, and m/z 258.1 → 121.1 for IS. The collision energy of phenylephrine, tropicamide, and IS were 15, 28, and 37 eV, respectively.
Preparation of standard solutions and quality control samples
Standard stock solutions of phenylephrine (1.0 mg/mL) and tropicamide (1.0 mg/mL) were prepared in methanol, and were then diluted with methanol to 5–1,600 and 25–8,000 ng/mL working solutions for phenylephrine and tropicamide, respectively, for use in ocular tissues. Additionally, 10–1,280 ng/mL working solutions were prepared for use in plasma samples. Solutions were stored at 4°C. Quality control (QC) was performed on working solutions at three concentrations prepared from stock solutions.
Animals
Twelve New Zealand white rabbits (weighing 2.0–2.5 kg) were raised under standard controlled conditions of 12-h light/12-h dark cycles. The subjects were fed standard laboratory food and had free access to water. All animal work was performed according to the Statement of the Association for Research in Vision and Ophthalmology for the Use of Animals in Ophthalmic and Vision Research.
Sample preparation
The collected samples were ground with a Bertin Precellys Evolution homogenizer (Montigny, France) in double-distilled water (1:10, w/v). Fifty microliters homogenate or aqueous humor was mixed with 20 μL IS working solution, 10 μL methanol, and 25 μL 1 mol/L sodium carbonate, vortexed for 1 min and extracted with 1 mL ethyl acetate, followed by centrifugation at 4,000 rpm for 10 min and the organic phase was removed and evaporated under nitrogen at 37°C. The sample was then reconstituted in 100 μL mobile phase solution, and 20 μL sample solution was again adjusted to 100 μL with mobile phase solution and vortexed, and a 5 μL aliquot was subjected to UPLC-MS/MS analysis. For plasma samples, 200 μL plasma was mixed with 20 μL IS working solution, 10 μL methanol, 100 μL 1 mol/L sodium carbonate, and 2 mL ethyl acetate, followed by the procedure described above.
Method validation
The method validation was performed according to the U.S. Food and Drug Administration Bioanalytical Method Validation Guide. 22 Blank rabbit plasma and ocular tissue samples from six different sources were analyzed to determine the presence of endogenous interference at the retention time of each sample to evaluate specificity. Linearity was evaluated by analyzing calibration standards in duplicate over three consecutive batches. Calibration curves were obtained by plotting the peak area analyte to IS ratio (analyte/IS) versus its concentrations weighted (1/x 2 ) by least-squares linear regression. Intra- and interday precision and accuracy were assessed by analyzing the LLOQ and QC of samples at low, medium, and high levels in 6 replicates on day one and day three of validation, respectively. Precision was determined by relative standard deviation (RSD) using analysis of variance and accuracy which expressed as relative error (RE) was determined by calculating how much the measured concentration deviated from the nominal concentration.
The peak areas of the extracted QC samples from six sources of rabbit iris/ciliary body or plasma were labeled as “C.” The peak areas obtained from the extracted blank biosamples reconstituted at the same QC levels were labeled as “B.” The peak areas obtained from samples dissolved in the mobile phase (at the same concentration) were labeled as “A.” The extraction recovery was calculated as C/B. The matrix factor (MF) was calculated as B/A. The IS-normalized MF was calculated as MF(analyte)/MF(IS).
The stabilities of the two analytes in rabbit ocular matrices and plasma were assessed in low and high QC samples for three replicates under the following conditions: long-term storage at −80°C for 20 days, three freeze–thaw cycles, room temperature (25°C) for 4 h, and postpreparative samples maintained in the autosampler at 4°C for 12 h. The deviation of the measured concentration from the nominal concentration was calculated.
PK/PD study
A 50 μL eye drop containing 0.5% tropicamide and 0.5% phenylephrine was instilled three times (5 min each) into both eyes of 12 rabbits. The animals were then evenly divided into four groups. For each group, pupil diameters were measured for both eyes using a vernier gauge and blood specimens were collected at 0.5, 1, 2, and 3 h. Aqueous humor was collected from the anterior chamber immediately upon sacrifice, followed by the other eye tissues.
Results and Discussion
Optimization of UPLC-MS/MS conditions
ESI was used for MS/MS detection because of the strong polarity of phenylephrine. We assessed the use of both positive and negative ion detection modes for ESI sources and determined that the positive ion detection mode provided a higher signal for both analytes. Thus, positive ion detection mode was used for all subsequent measurements. Phenylephrine, tropicamide, and IS formed precursor (M+H)+ ions at m/z 168.2, 285.2, and 258.1 respectively, which were then fragmented in MS/MS mode to generate product ions (Fig. 1).

Mass spectra of the (M+H)+ product ions of phenylephrine
Optimizing chromatographic conditions to achieve proper retention, good peak shape, and a strong MS response for both compounds was challenging. Identifying a suitable column was critical and we tested several different columns. Due to its strong polarity, phenylephrine had no retention on a C18 column. We next considered a Hydrophilic Interaction Chromatography (HILIC) column and found that the phenylephrine retention time was improved, however, tropicamide, which has moderate polarity, had weak retention on the HILIC column. After several more tests, we found that both phenylephrine and tropicamide had adequate retention using C8 or Cyano (CN) columns. Ultimately, a C8 column with a 100 mm length was chosen because it displayed a stronger response and shorter retention time than the CN column.
Sample preparation
We first tested methanol or acetonitrile-based protein precipitation methods for prepreparation of our biological samples because they were simple and fast. Unfortunately, these methods did not work for extracting phenylephrine. We next tried a liquid/liquid extraction (LLE), which had a lower background noise, using different concentrations of ethyl ether and different pH conditions. We chose to use an ethyl acetate LLE extraction with 1 mol/L Na2CO3, which had a greater, more consistent analyte recovery. To avoid phenylephrine matrix effects, which can be easily induced by endogenous substances due to phenylephrine's low molecular weight and high polarity, the reconstituted residue solution was diluted by mobile phase (1:4, v/v), followed by UPLC-MS/MS analysis.
Method validation
Representative chromatograms of blank iris/ciliary body samples, blank iris/ciliary body samples spiked with low QC analytes and ISs, and real iris/ciliary body samples taken 3 h after topical administration are shown in Fig. 2. No endogenous interfering peaks in ocular or plasma samples were observed at analyte retention times. The calibration curves of the two analytes in the different matrices showed good linearity (coefficient >0.99) (Table 1). The precision of LLOQ and the three levels of QC in ocular tissue and plasma are shown in Table 2. The RSDs of intra- and interday precision ranged from 5.13% to 12.9% and from 5.00% to 12.0% for phenylephrine and tropicamide, respectively, and the accuracy ranged from −7.92% to 8.44% (RE values). Both precision and accuracy were adequate. The mean extraction recoveries of phenylephrine and tropicamide in biological matrices were between 49.1% and 53.6% and between 69.6% and 74.2%, respectively, and the RSDs were between 5.34% and 7.68%, which are also adequate for biological samples (Table 3). The IS-normalized MF for both analytes ranged from 94.6% to 101.0% with RSDs of <12.7% (Table 3), indicating that the phenylephrine and tropicamide matrix effects can be corrected by using IS. As shown in Table 4, phenylephrine and tropicamide were stable in rabbit iris/ciliary body and plasma at room temperature for 4 h (RE < −8.67%), after three freeze–thaw cycles (RE < −9.67%), and at −80°C for 20 days (RE < −9.60%) and also had a good postpreparative stability (RE < −10.7%).

Representative multiple reaction-monitoring chromatograms from blank iris/ciliary homogenate
Calibration Curves for the Determination of Tropicamide and Phenylephrine in Different Biological Specimens
Precision and Accuracy, for the Tropicamide and Phenylephrine in Rabbit Biological Specimens (n = 6)
RE, relative error; RSD, relative standard deviation.
Recovery and Matrix Effect for the Tropicamide and Phenylephrine in Rabbit Biological Specimens (n = 6)
IS, internal standard.
Stability of Tropicamide and Phenylephrine in Rabbit Biological Specimens (n = 3)
PD and PK study
The graphs of pupil size over time after eye drop administration in rabbits are presented in Fig. 3, the mean concentrations of phenylephrine and tropicamide in ocular tissues are shown in Fig. 4 and the main PK parameters are listed in Table 5.

Pupil size over time after topical administration of phenylephrine/tropicamide eye drops in rabbit (n = 6).
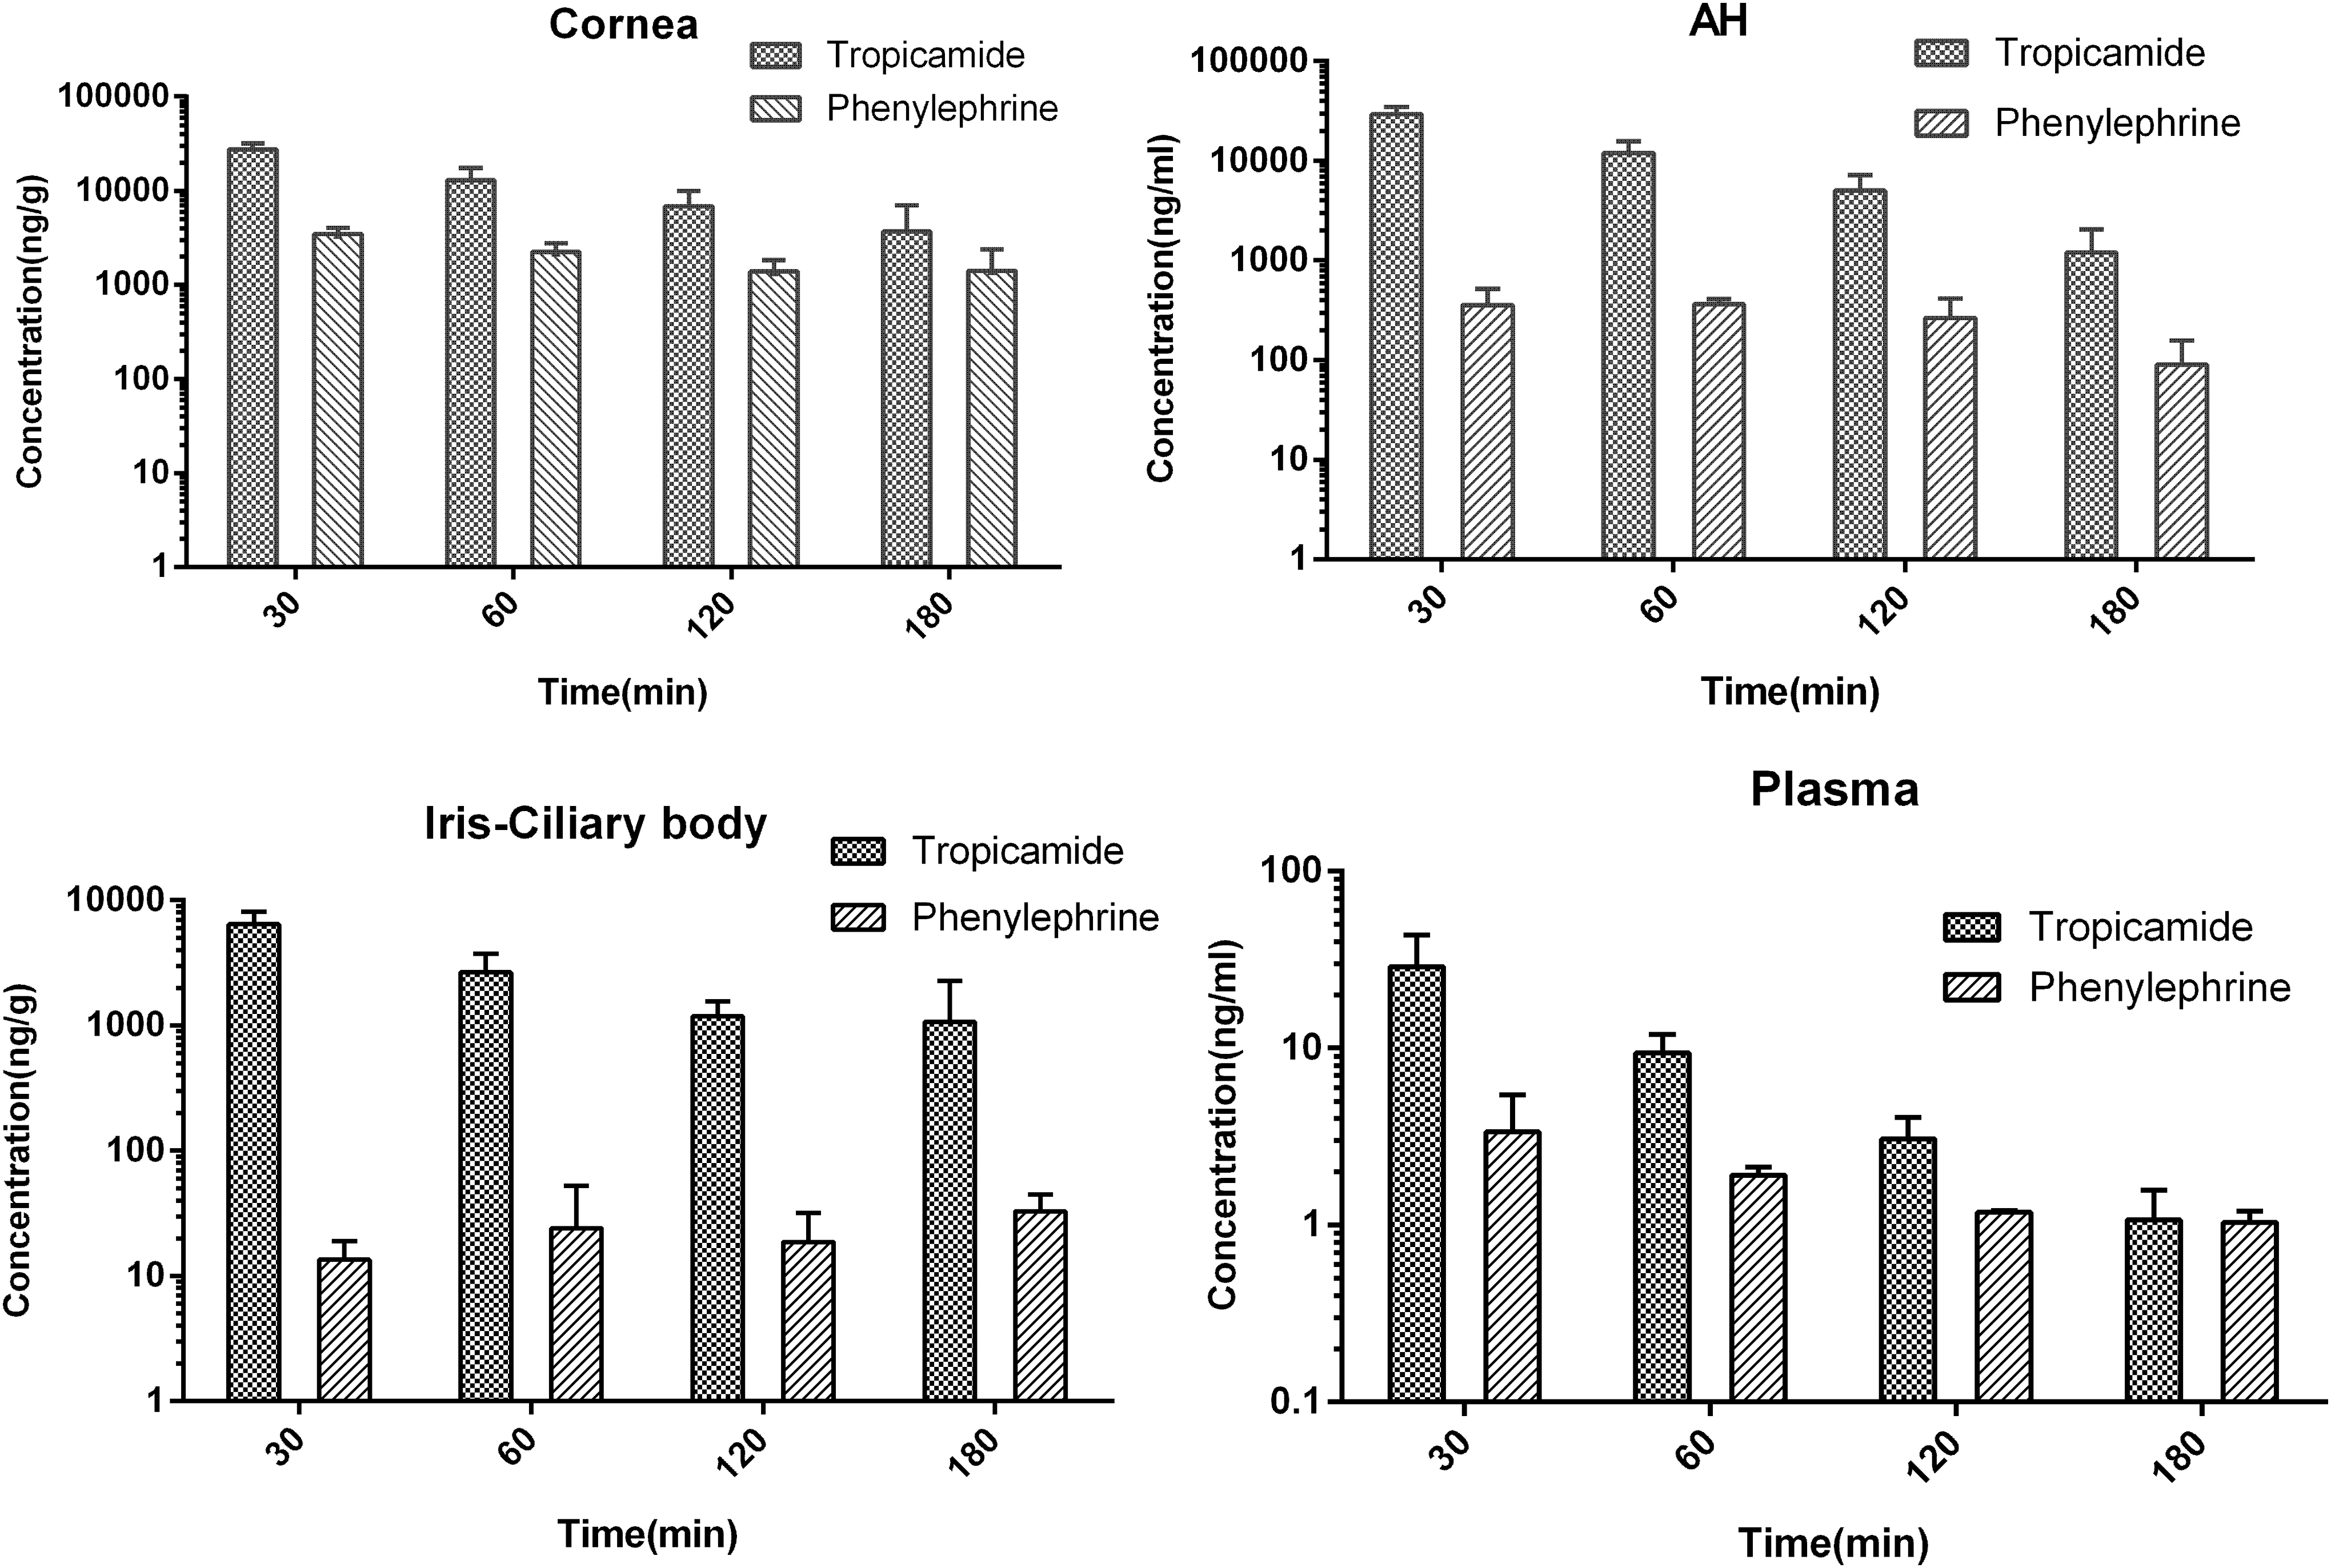
Mean concentration over time of tropicamide and phenylephrine in ocular tissues and plasma after topical administration of phenylephrine/tropicamide eye drop in rabbit (n = 6). AH, Aqueous humor.
The Pharmacokinetic Parameter Values of Phenylephrine and Tropicamide in Ocular Tissue and Plasma After Topical Instillation (n = 6)
AUC, area under the curve.
After three topical instillations, the pupil sizes reached a maximum of 11.35 mm at 0.5 h and the dilation was maintained for 3 h (11.12 mm). The corneal concentrations of tropicamide were similar to those in the aqueous humor at all time points due to its good permeability. In the iris/ciliary body, the highest tropicamide concentration observed was 6,455 ng/mL at 0.5 h, but by 3 h, the concentrations decreased much less than in the aqueous humor (nearly 24 times less) or the cornea (6 or 7 times less). Tropicamide was cleared fastest from the aqueous humor. The highest phenylephrine concentrations were 3,465 ng/g at 0.5 h in cornea and 362.6 mg/mL at 1 h in aqueous humor. The aqueous humor phenylephrine concentrations were almost 10 times less than the corneal concentrations at each time point due to poor permeability through the corneal barrier. In the iris/ciliary body, the phenylephrine concentration remained relatively steady from 13.5 to 32.9 ng/g. Overall, the ocular distribution of the two drugs was highest in the cornea, followed by the aqueous humor, and lowest in the iris/ciliary body. The concentrations of phenylephrine and tropicamide were even lower in plasma, indicating minimal systemic absorption. These data help to explain the previous pharmacological studies, which found that the maximum pupil sizes occurred at 0.5 h and the effects lasted for 3 h. Due to its fast onset and long-lasting effect, the drug combination is suitable for clinical dilation of pupils, facilitating the examination of the lens, vitreous body, and retina.
A compound's permeability in the cornea is determined by size and polarity.23,24 Phenylephrine has poor distribution in the aqueous humor and iris/ciliary body at the same dosage of tropicamide, even though it has a smaller molecular weight, because of its highly hydrophilic nature. Corneal epithelial cells form a highly lipophilic layer, creating a significant barrier to the absorption of phenylephrine into the aqueous humor.
Conclusion
We developed and validated a sensitive and reliable UPLC-MS/MS method for simultaneous determination of phenylephrine and tropicamide in rabbit diverse ocular tissues and plasma for the first time. Due to the different polarities of the compounds, more work was focused on the optimization of chromatographic conditions and sample preparation. The LLOQ was 5 ng/mL for tropicamide and 1 ng/mL for phenylephrine, and only 50 μL ocular sample was needed. Using this method, we were able to determine the PK and tissue distribution profiles after topical ocular administration in rabbits. Our findings further strengthen our understanding of mydriasis pharmacology and may be helpful in the future development and application of mydriatic agents.
Footnotes
Acknowledgments
The authors would like to thank Mr. Licheng Ai and Miss Tong Li for their valuable technical assistance.
Author Disclosure Statement
All authors have no conflict of interest to declare.
Funding Information
No funding was received for this article.