
Abstract
Purpose:
Activation of the classical complement pathway is thought to contribute to the development and progression of glaucoma. The role of alternative complement or amplification pathways in glaucoma is not well understood. We evaluated complement factor B (FB) expression in postmortem human ocular tissues with or without glaucoma and the effect of FB inhibition and deletion in a mouse ocular hypertensive model of glaucoma induced by photopolymerized hyaluronic acid glycidyl methacrylate (HAGM).
Methods:
Human CFB mRNA in human eyes was assessed by RNAscope and TaqMan. HAGM model was performed on C57BL6/J mice. The effect of FB in HAGM model was evaluated with an oral FB inhibitor and Cfb−/− mice. Complement mRNA and proteins in mouse eyes were assessed by TaqMan and western blot, respectively.
Results:
CFB mRNA in human glaucomatous macular neural retina and optic nerve head was upregulated. Cfb mRNA is also upregulated in the HAGM model. Oral FB inhibitor, ED-79-GX17, dosed daily at 200 mg/kg for 3 days after intraocular pressure (IOP) induction in wild-type mice showed complement inhibition in ocular tissues and significantly inhibited systemic complement levels. Daily dosing of ED-79-GX17 for 30 days or Cfb deletion was also unable to prevent retinal ganglion cell or axon loss 30 days after IOP induction in mice.
Conclusion:
The alternative complement component FB may not substantially contribute to RGC loss in the HAGM mouse glaucoma model despite upregulation of Cfb expression and activation of the alternative pathway. The relevance of these findings to human glaucoma remains to be determined.
Introduction
Glaucoma, which affects 60–80 million people worldwide, is an optic neuropathy typically characterized by cupping of the optic nerve head (ONH) and accompanied by thinning of the nerve fiber layer, progressive loss of retinal ganglion cells (RGCs), and axon damage. It is typically associated with elevated intraocular pressure (IOP), a key modifying risk factor. Sustained lowering of IOP to <18 mmHg can prevent the progressive loss of RGCs in glaucoma patients; however, between 5% and 60% of patients continue to lose their vision despite adequate IOP control, indicating that other factors may continue to cause this optic neuropathy.1–3 The role of glia in glaucomatous optic neuropathy (GON) has received increasing attention over the past few years. 4 Specifically, the interplay between neural retinal microglia and astrocytes, as well as those in the ONH, has been shown to promote optic neuropathy in glaucoma.5–7 There are several factors that appear to drive GON, including neuroinflammation [e.g., cytokines such as tumor necrosis factor-alpha/interleukin-1 (TNF-α/IL-1), complement cascade activation, and TLR4/DAMP signaling], production of neuropeptides like endothelin-1, aberrant nitric oxide signaling (e.g., increased nitric oxide production via inducible nitric oxide synthase-NOS-2/iNOS), and changes to extracellular matrix profiles that are inconducive to retinal ganglion cell and axon survival.6–10 The localized roles of microglia and astrocytes in promoting neuronal repair, pathology, and protective roles in GON are best exemplified by the involvement of the complement pathway.
Activation of the classical complement pathway and engagement of specific components to drive neuropathy in glaucoma have been a focus as Stevens et al., Stephen et al., and Schafer et al. identified a role for C1q and C3 in developmental pruning/remodeling of retinal ganglion cell synapses.11–13 Of note, Stevens demonstrated that retinal astrocytes exhibited 10- to 30-fold upregulation of C1qA/B/C mRNA in the postnatal days p5–p10 in mice, and the immunoreactive pattern for C1q proteins was colocalized with the synaptic markers SV2 and PSD95 in RGCs and the lateral geniculate nucleus (LGN). 11 In addition, C1q-deficient mice showed defects in synaptic refinement in the LGN, indicating a role for the classical pathway and astrocyte/microglial interactions in the central nervous system. 11
More specific to GON, in a congenital glaucoma model involving DBA/2J mice, Stevens et al. showed increased C1q immunostaining in RGCs with increasing disease severity, and this is localized to synapses early in disease. 11 Recent studies involving C1q-deficiency in the DBA/2J mouse model have shown neuroprotection by delaying RGC loss and optic nerve degeneration.8,14 However, it is important to note that DBA/2J mice are deficient in C5 and terminal pathway activation, suggesting that RGC/optic nerve degeneration in this model could occur via upstream or alternative pathways. 15 The central role of C3 convertase across complement activation was also assessed in DBA/2J mice wherein AAV2-CR2-Crry expression abrogated RGC and optic nerve degeneration in these mice, suggesting that blocking local C3 activation could be neuroprotective in this model. 16 Crry is the mouse ortholog of human complement receptor 1, the main inhibitor of C3 convertase and is directed toward activated C3 deposition. 17
In addition to supportive evidence in rodents, human glaucomatous donor eye tissues also display increased immunoreactive C1q, C3b, and C5 levels in the RGC layer, when compared with non-glaucomatous donor tissues.18,19 Intriguingly, Scheetz et al. have also identified a novel gene locus for C7 (on Chr. 5) with several single-nucleotide polymorphisms associated with primary open angle glaucoma (POAG). 20 C7 is part of the terminal membrane attack complex (MAC). Interestingly, Annexon Biosciences has explored inhibition of C1q as a therapeutic option where they recently reported that a single intravitreal injection of ANX007 (Fab anti-C1q; 2.5 and 5 mg) reduced free C1q levels by 90% in the aqueous humor of glaucoma patients, at 29 days post-injection. 21
Although the alternative complement pathway (AP) has been strongly implicated in the progression of age-related macular degeneration (AMD), 22 little is known about its role in glaucoma. Given its crucial role in the amplification loop of both classical and lectin pathways and involvement in several diseases, including AMD, paroxysmal nocturnal hemoglobinuria, and C3 glomerulopathy, 23 factor B (FB) serine protease could also be a contributor to GON. We investigated whether FB plays a role in RGC and axon loss in a mouse hyaluronic acid glycidyl methacrylate (HAGM) ocular hypertensive model of glaucoma, previously established by our group. 24 Specifically, we established the HAGM model in Cfb knockout mice and evaluated whether the systemic administration of a selective and potent small molecule inhibitor of FB, ED-79-GX17, would protect RGCs and axons in the HAGM model using wild-type (WT) mice.
Methods
Postmortem donor eye collection and glaucoma grading
Postmortem human eyes were procured by the Lions Eye Institute for Transplant & Research with the consent of donors or donors’ next of kin and in accordance with the Eye Bank Association of America medical standards, US/Florida law for human tissue donation, the Declaration of Helsinki and the Food and Drug Administration’s regulations, and Novartis human tissue registration working practice guidelines regarding research using human tissues. Postmortem eye collection methods and reagents are as described previously. 25 For TaqMan analysis, glaucoma and non-glaucoma eyes were selected based on donor ophthalmological history (Supplementary Table S1). For histology studies, postmortem eye globes were fixed at room temperature with Modified Davidson’s Fixative for 2 days and followed by 70% ethanol for another 2 days. After fixation, the tissues were processed and embedded in paraffin in Tissue-Tek VIP and Tissue-Tek Tec (Sakura Finetek USA). The paraffin sections were cut at 5 μm and used for H&E (hematoxylin and eosin), RBPMS, GFAP, IBA1 (RGC, astrocyte, and microglia/macrophage markers, respectively), and complement factor B (CFB) mRNA detection. Glaucoma and non-glaucoma eyes in histology studies were categorized based on H&E evaluation for ONH cupping, remodeling of optic nerve, and RGC cell loss via RBPMS staining (Supplementary Table S2). Based on this grading, eyes were selected for CFB RNAscope studies with or without immunofluorescent co-staining with RBPMS, GFAP, or IBA1.
RNAscope/in situ hybridization and immunostaining of postmortem eyes
RNAscope for detecting CFB mRNA in paraffin-embedded tissues with RNAscope® 2.5 LS Probe-Hs-CFB [Cat# 402109, Advanced Cell Diagnostics (ACD)] was done using an Automated Ultra Ventana IHC staining machine (Ventana) according to the manufacturer’s instruction (ACD). The positive control used a probe for Homo sapiens peptidylprolyl isomerase B (PPIB, Cat# 313909, ACD), whereas the negative control probe targeted dapB of Bacillus subtilis (Cat# 312039, ACD). PPIB was used as a house-keeping gene for sample quality control. As corneal epithelial cells were minimally affected in glaucoma eyes, postmortem eye samples selected in the study have at least 3–5 copies of PPIB mRNA per corneal epithelial cell. RNA signal was detected by RNAscope® VS Universal AP Reagent Kit (Cat# 323250, ACD) and mRNA Red Detection kit (760-234, Ventana).
To quantify CFB mRNA expression, chromogenic RNAscope analysis was done using entire slides that were scanned using an Aperio AT2 slide scanner (Leica Biosystem) and imaged by Halo Image Analysis Platform (Indica Labs). Bruch’s membrane opening (BMO) at ONH was used as a landmark. Total CFB mRNA copies per area per eye were counted from one macular retina and ONH section per eye. Macular retina area includes the entire ganglion cell complex (GCC; including the nerve fiber layer, the ganglion cell layer, and the inner plexiform layer) in the 2 mm macula, which is 1 mm away from BMO surrounding the ONH. The ONH region includes the area 1 mm from the top cover of ONH by the distance between 2 BMO-excluded vessels. Statistical analyses were performed by t-test to compare the 2 groups (e.g., glaucoma vs. non-glaucoma).
Antibodies used for fluorescent RNAscope/immunofluorescent (IF) dual staining of postmortem eyes were rabbit anti-RBPMS antibody (NBP2-20112, Novus Biologicals) as a RGC marker at a working concentration of 1.25 µg/mL (1:800), rabbit anti-IBA1/AIF1 (019–19741, Waco) as a microglia/macrophage marker at 0.2 µg/mL (1:5000), and rabbit anti-GFAP as an astrocyte marker (ab7260, AbCam) at 0.125 µg/mL (1:8000). IF staining was run after RNAscope. RNA signal was detected by RNAscope® VS Universal HRP Reagent Kit (Cat# 323200, ACD) and DISCOVERY Cy5 kit (760-238, Ventana). IF signal was revealed by OmniMap ANTI-Rb HRP RUO (760–4311) and DISCOVERY FAM Kit (760-243). Slides were scanned and imaged using an Axio Scan Z1 (Zeiss USA).
Animals
All animal experiments adhered to the ARVO Statement for the Use of Animals in Ophthalmic and Vision Research and were approved by the Novartis Institutes for Biomedical Research Animal Care and Use Committee. Male and female C57BL/6J mice were purchased from The Jackson Laboratory. Heterozygous breeding of B6;129S4-Cfb<tm1Hrc> Crbwt animals was performed to generate Cfb−/− mice and their WT littermates. Mice were randomly assigned to groups with roughly equal numbers of males and females per group. Mice were approximately 5–10 months old at the time of the study with age-matched controls used for each study.
Anterior chamber injection and IOP measurement
The murine ocular hypertension model induced bilaterally by in vivo photopolymerization of HAGM was performed as described, replacing HAGM–μBeads solution with HAGM–fluorescein for visualization. 24 IOP was measured using a rebound tonometer (TonoLab) calibrated for use on murine eyes. Each IOP recording was the mean ± standard error of mean (SEM) of 10 successive readings. Animals were anesthetized with 3% isoflurane supplemented with oxygen at 2 L per minute flow rate for 8 min, immediately followed by IOP measurement; a nose cone was attached to the animal for continuous isoflurane supply during IOP recording.
TaqMan
For the mouse HAGM model, C57BL6/J mice of mixed sex (n = 6–10) were used and compared with a naive group. Sample exclusion criteria for the naive normal controls: cumulative IOP not >30% of naive average IOP and for the OHT group IOP: cumulative IOP not <30% of naive average IOP or greater than 60 mmHg. Total RNA was extracted using the RNeasy Plus Mini Kit (Qiagen, Cat.# 74139). Total RNA concentration was quantified, and 0.5 µg RNA was used to synthesize cDNA using SuperScript IV VILO Master Mix (ThermoFisher Scientific, Cat.# 11756050, V. A. Graiciuno 8): the custom TaqMan Array of selected TaqMan Gene Expression Assays and a manufacturer’s 18S control (ABI) in a 384-well format and spotted on a microfluidic array (singleplex per assay). There are 8 sample loading ports in each array; 96 genes use 2 ports for each tested sample. Cards were loaded with 100 µL of reaction mix per port, containing 50 µL of cDNA from each sample (1 ng total input RNA/µL) and 50 µL of TaqMan Fast Advanced Master Mix (ABI). Loaded cards were centrifuged and sealed as per the manufacturer’s instructions and run on a ViiA™ 7 Real-Time PCR System (ABI) under the following cycling conditions: 50°C for 2 min, then 95°C for 20 s, followed by 40 cycles of 95°C for 1 s and 60°C for 20 s. Expression levels were normalized against endogenous control (Transferrin receptor - Tfrc). Outliers were determined using Spotfire software box plot method where samples above Quartile 3 + 1.5 × IQR (interquartile range) or below Quartile 1 − 1.5 × IQR were excluded. Relative expression was calculated against the phosphate-buffered saline (PBS) group (Table 1).
Catalog Numbers of PCR Probes for Select Complement Pathway Genes
Western blot
Preparation of mouse eye tissue lysates and western blot analysis were as described previously. 26 Primary antibodies used are anti-mouse C3d (Cat.# AF2655, R & D Systems) and anti-FB antibody (Cat.# A311, Quidel). Outliers were excluded as in TaqMan assays. The same amounts of protein lysates were loaded in each well. Outliers were consistent across multiple C3 and FB measurements and were removed from all readouts.
Preparation of immunostained retinal flat mounts
Mouse eyes were enucleated and fixed in 4% PFA for 2 h and then washed in 1× PBS. The cornea and lens were then removed using spring scissors. Retinas were carefully dissected out from the eye cup, flattening them by cutting 4 quadrants toward the ONH. Antibodies were diluted in incubation buffer consisting of IHC/ICC low protein blocking buffer (eBioscience, Cat.# 00–4953-54) diluted 1/3 in 1× dPBS and 0.5% Triton-X. Retinas were immunostained in a 48-well plate with 100 µL of antibody staining solution (see the table) for 48 h and overnight for primary (mouse anti-BRN3A RGC marker, 1:200 dilution, Cat# MAB1565, Milipore) and secondary (Donkey anti-mouse, 1:500 dilution, Cat# A10037, LifeTech), respectively. After each antibody incubation, retinas were washed with 1× PBST (PBS + 0.5% Tween-20) for 2 h and then washed in 1× PBS for 1 h. Following staining, retinas were flattened ganglion cell layer up on ColorFrost Plus slides (Erie Scientific, Cat.# 6951PLUS-006), briefly air-dried, and then mounted with VECTA SHIELD Hardset Antifade mounting medium with 4′,6-diamidino-2-phenylindole (DAPI; Vector Laboratories, Cat.# H-1500) and microscope cover glass.
Axon paraphenylenediamine (PPD) staining
Mouse optic nerve samples were collected and fixed with half-strength Karnovsky’s fixative [2% formaldehyde + 2.5% glutaraldehyde, in 0.1 M sodium cacodylate buffer, pH 7.4 (Electron Microscopy Sciences)] for a minimum of 48 h. After fixation, samples were rinsed with 0.1 M sodium cacodylate buffer, postfixed with 2% osmium tetroxide in 0.1 M sodium cacodylate buffer, then dehydrated with graded ethyl alcohol solutions, and transitioned with propylene oxide and resin infiltrated in tEPON-812 epoxy resin (Tousimis) using an automated EMS Lynx 2 EM tissue processor (Electron Microscopy Sciences). Processed tissues were oriented in EPON-812 epoxy resin and polymerized in silicone molds using an oven set for 60°C for 48 h. Semi-thin cross sections were cut at 1.6 µm with a Histo diamond knife (Diatome) on a Leica UC-7 ultramicrotome (Leica Microsystems) and collected on slides and then dried on a slide warmer. The slides were stained with 1% paraphenylenediamine (PPD; MP Biomedicals LLC) in 50% isopropanol + 50% methanol solution for 60 min at room temperature, rinsed in 3 changes of 50% isopropanol + 50% methanol solution and 1 change of 100% ethanol, and air-dried, and then mounting medium and a glass coverslip was applied over the sections for light microscopic analysis of myelinated axon.
Quantification of RGC and axons
To assess RGC and axon degeneration, retinal flat mounts labeled with BRN3A and optic nerve cross sections labeled with PPD were imaged on an Olympus BX51 fluorescence microscope and quantified using Fiji (ImageJ) and/or a custom CellProfiler pipeline. 27 Retinal flat mounts were imaged using immunofluorescent filter at 20× in 8 total regions of the retina, including 4 central and 4 peripheral regions ∼1 and 2 mm from the ONH, respectively. The number of BRN3A+ nuclei was quantified using CellProfiler, and the image area was used to calculate RGC density. Optic nerve cross sections were imaged using brightfield and oil immersion (Zeiss, #444960-0000-000) at 100× in 5 different regions. Optic nerve cross sections were imaged at 20× to calculate tissue area using Fiji. The total axons per optic nerve were calculated from axon density and tissue area.
FB inhibitor ED-79-GX17 studies
ED-79-GX17 is the phosphate salt of (+)-4-[(2S,4R)−1-(5-methoxy-7-methyl-1H-indol-4-yl)methyl)-4-methylpiperidin-2-yl]benzoic acid. This compound was exemplified as Example-20a in the published patent WO 2015/009616 A1, wherein full experimental details including purification and characterization data (e.g., 1H NMR and high-resolution mass spectrometry - HRMS) are provided. The preparation of the phosphate salt was also described in the same patent as Example-20c, and characterization data were also provided (e.g., 1H NMR and X-ray crystallography).
FB inhibitor/ED-79-GX17 studies in HAGM model
The HAGM model was used to evaluate ED-79-GX17 or vehicle (0.5% methylcellulose, 0.5% Tween 80 in distilled water) following 3 or 30 days of hypertension and compared with noninjected naive eyes. C57BL6/J mice of mixed sex (n = 3–7) were used and compared with a naive group. IOP exclusion criteria for naive normal controls and OHT group are as stated in TaqMan assay. Mice were orally dosed with 200 mg/kg ED-79-GX17 or vehicle beginning the evening before bilateral IOP induction via HAGM and then daily at 8 am throughout the study. Samples were collected 4 h after the last dose on days 3 and 30. Neural retina, whole eye cup (WEC), and plasma were collected on day 3 for western blot assessment. Day 30 samples were collected for RGC and axon quantification. Whole eyes were enucleated and fixed in 4% PFA for flat mount, and optic nerves were fixed in half strength Karnovsky’s fixative for PPD staining and sectioning.
Statistics (all relevant methods that needed stats)
Prism software (GraphPad Software, www.graphpad.com) was used for statistical analysis. Data are presented as mean ± SEM. Comparisons of means for complement mRNA or protein levels between treatment groups were generated using Student’s t-test unpaired 2-tailed for studies with 2 groups. For studies with more than 2 groups, one-way analysis of variance (ANOVA) with Tukey’s test for multiple comparisons was used (P < 0.05 significance).
Results
Upregulation of CFB gene expression in human glaucomatous eyes
Spatial changes in CFB gene expression in human donor glaucoma eyes versus non-glaucoma eyes were evaluated. CFB mRNA signal showed minimal detection in macular retina and ONH of non-glaucoma eye sections, but glaucomatous eyes showed increased expression in the retinal ganglion cell layer and ONH (Fig. 1, B). Peripheral retina CFB+ cells displayed similar changes as the macular retina (data not shown). Levels of CFB mRNA copies were measured in macular retina and ONH. In all cases, CFB mRNA levels (copy numbers) were consistently higher in glaucomatous eyes than in non-glaucoma controls (Fig. 1C, D). Gene expression of the AP complement components C3 and CFB was increased in glaucoma donor eyes. C3 mRNA levels were significantly upregulated in macular retina samples from glaucoma eye compared with non-glaucoma controls (Supplementary Fig. S1). On average, retinal CFB mRNA levels were at least 10-fold lower than C3 and the increased levels of CFB mRNA in glaucoma retina lysate were not statistically significant, as measured by TaqMan-based PCR.
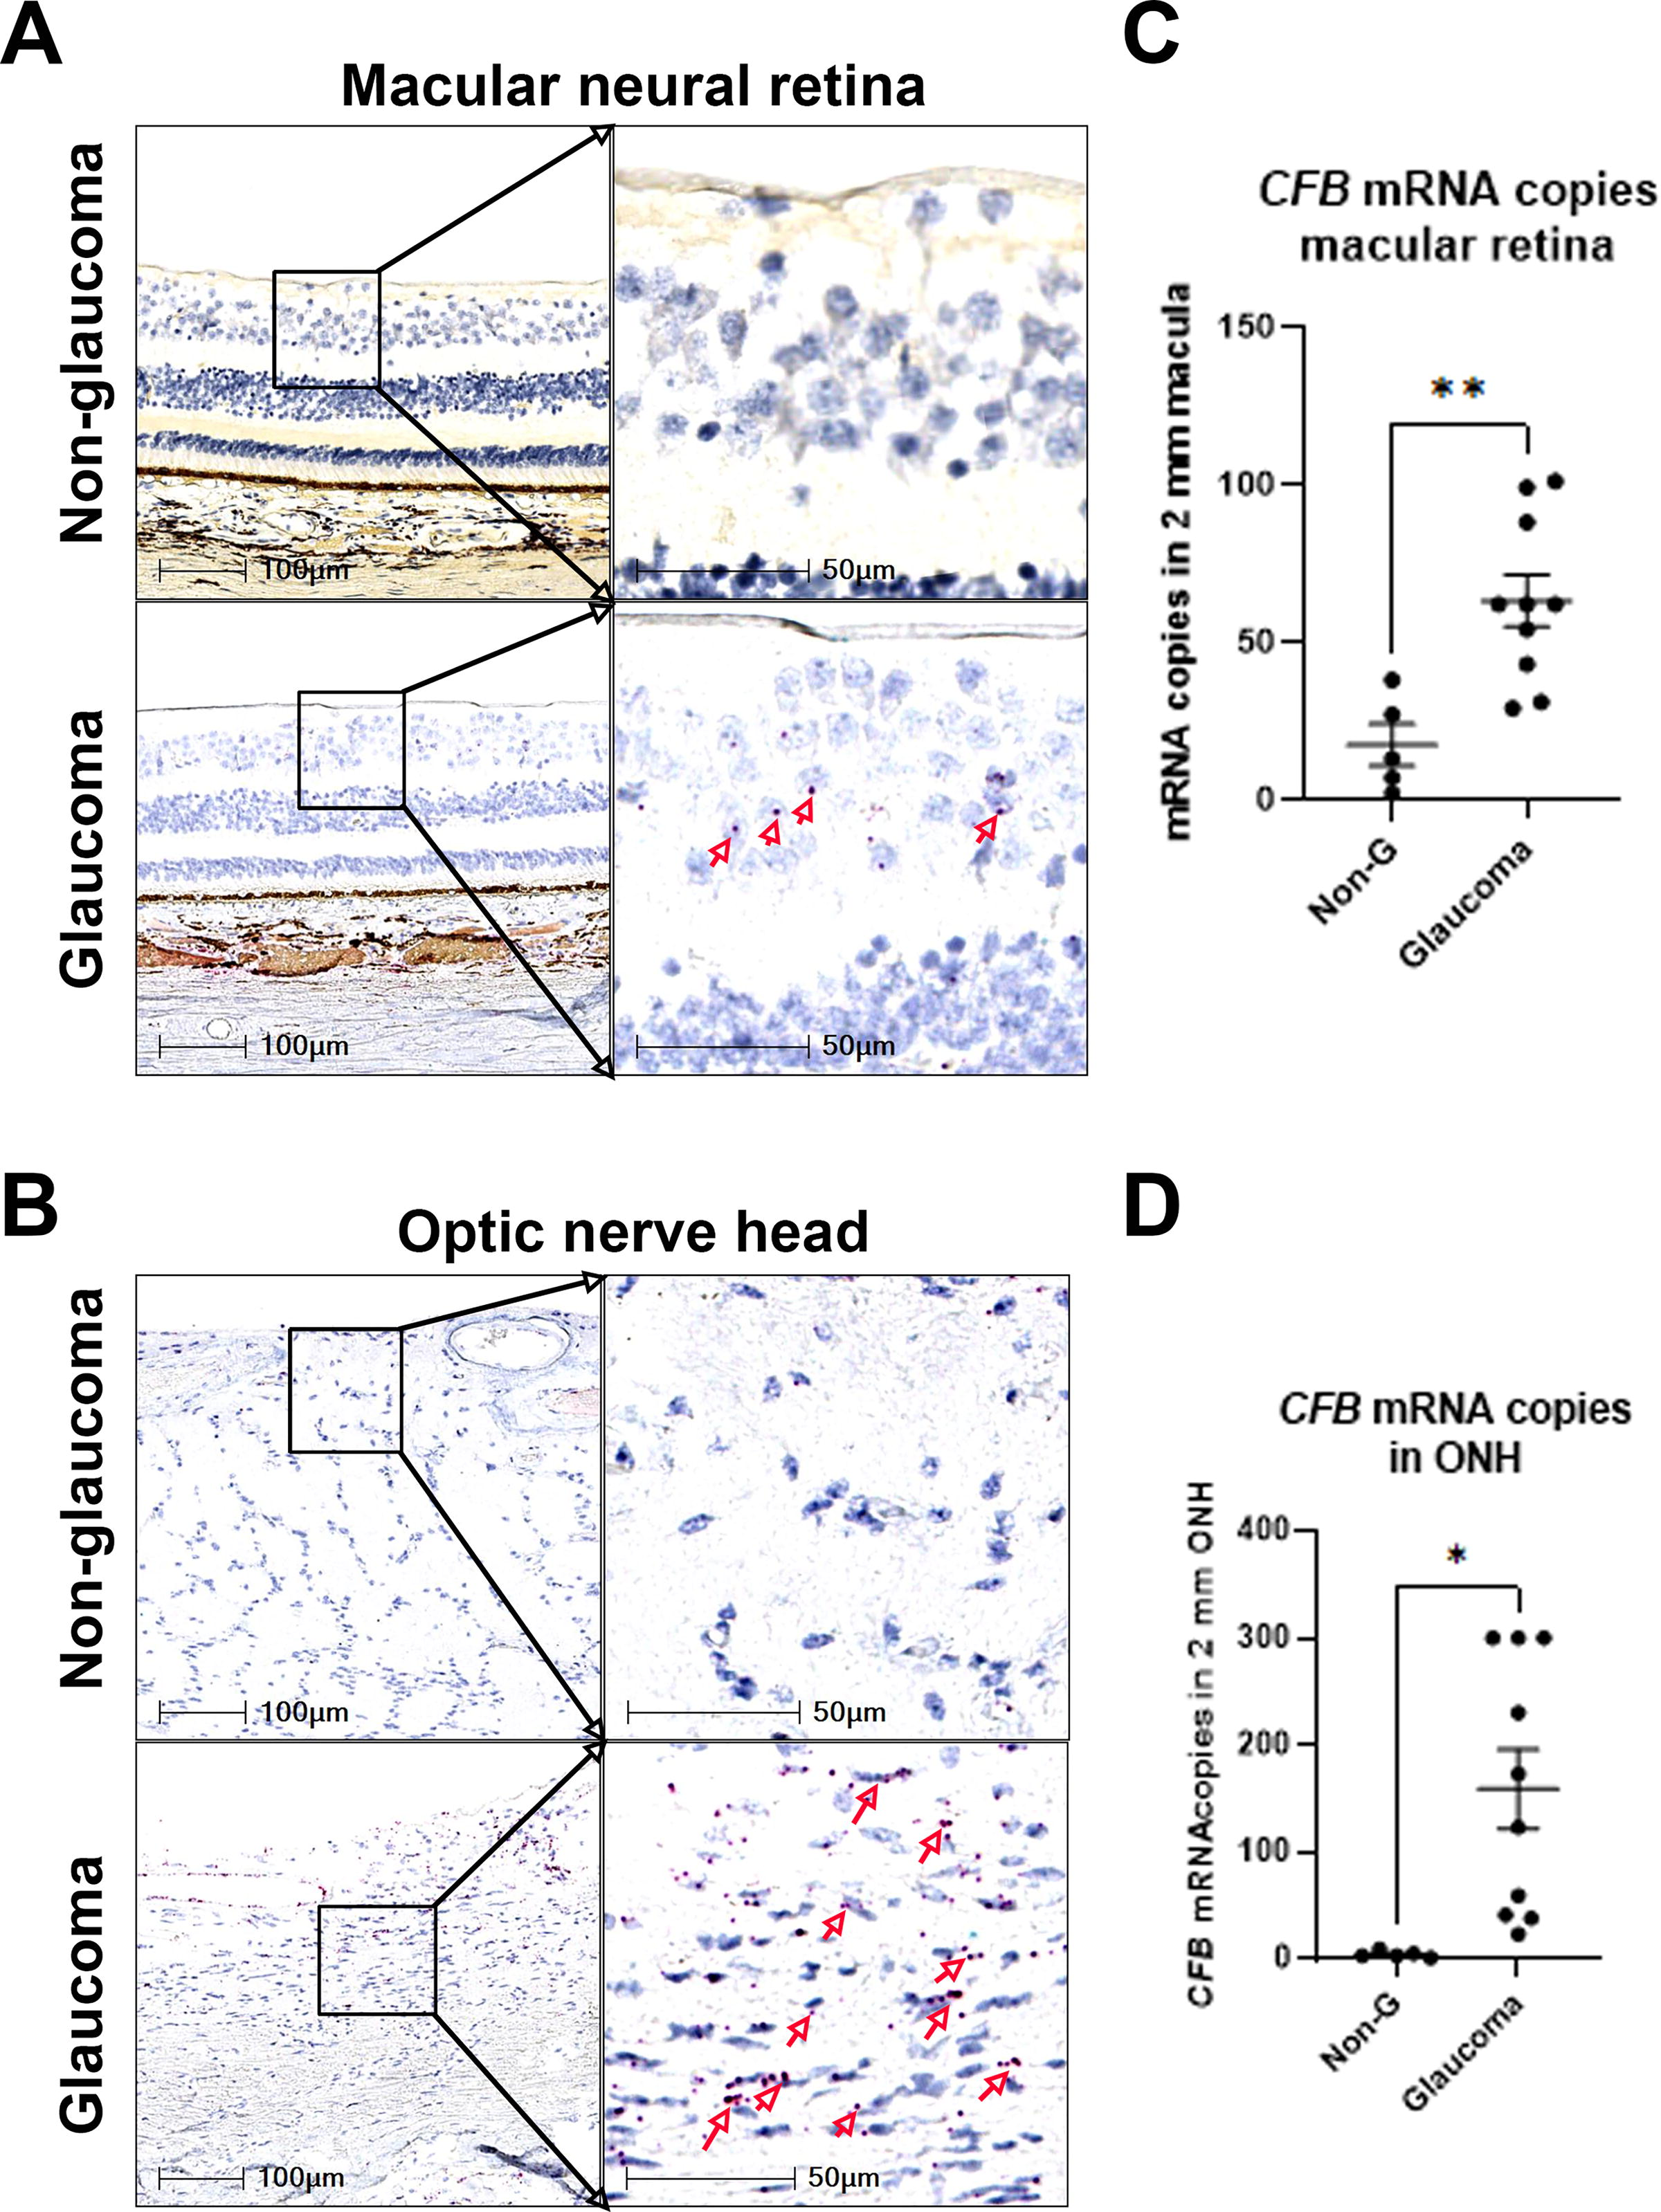
CFB gene expression is upregulated in human glaucoma eyes. Representative images of RNAscope using human CFB mRNA probe on postmortem eyes without and with glaucoma, showing the macular neural retina area (upper panel)
Next, we assessed which ocular cell types are responsible for the increased CFB mRNA synthesis in glaucoma eyes. Co-immunostaining with either the microglia/macrophage marker IBA1 or the astrocyte marker GFAP suggests that some CFB mRNA signals colocalized with microglia/macrophages and others with astrocytes in the retina and ONH (Fig. 2A–D). A small number of RBPMS+ RGC cells in the macular area were CFB mRNA+ (Fig. 2E), mostly in glaucoma eyes. Consistent with our findings, specific expression of CFB in astrocytes was reported in a single nucleus RNA-seq study of human macular retina. 28

CFB gene expression is upregulated in IBA-, GFAP-, and RBPMS-positive cells in human glaucoma eyes. Representative images of costaining of CFB mRNA (red) with microglia marker IBA1 (green) protein
Upregulation of complement gene expression in the mouse HAGM model
To examine the role of AP complement in glaucoma preclinically, we used a murine glaucoma model induced by a photopolymerizable biomatrix, HAGM. 24 This model recapitulates several pathophysiological features of glaucoma such as IOP elevation, RGC loss, and axon cell loss that are similar to human glaucomatous optic neuropathy. Complement gene expression in ocular tissues was examined by TaqMan/gene array at day 3, day 7, and day 30 after HAGM injection. C1qa, C3, Cfb, and Itgb2 mRNA levels were generally 5- to 50-fold higher in HAGM-injected eyes compared with PBS controls at both day 3 (p < 0.05) and day 7 (trend only; not statistically significant), an indication that complement might be activated early in the mouse HAGM model (Fig. 3B). It was interesting that we observed a persistent and statistically significant increase in the complement genes at day 30 in the mouse HAGM model, albeit at levels lower than that noted on day 7 (Fig. 3B). We had previously demonstrated that injection of HAGM monomers (i.e., without polymerization) did not trigger any inflammatory changes or complement activation or IOP elevation. 24
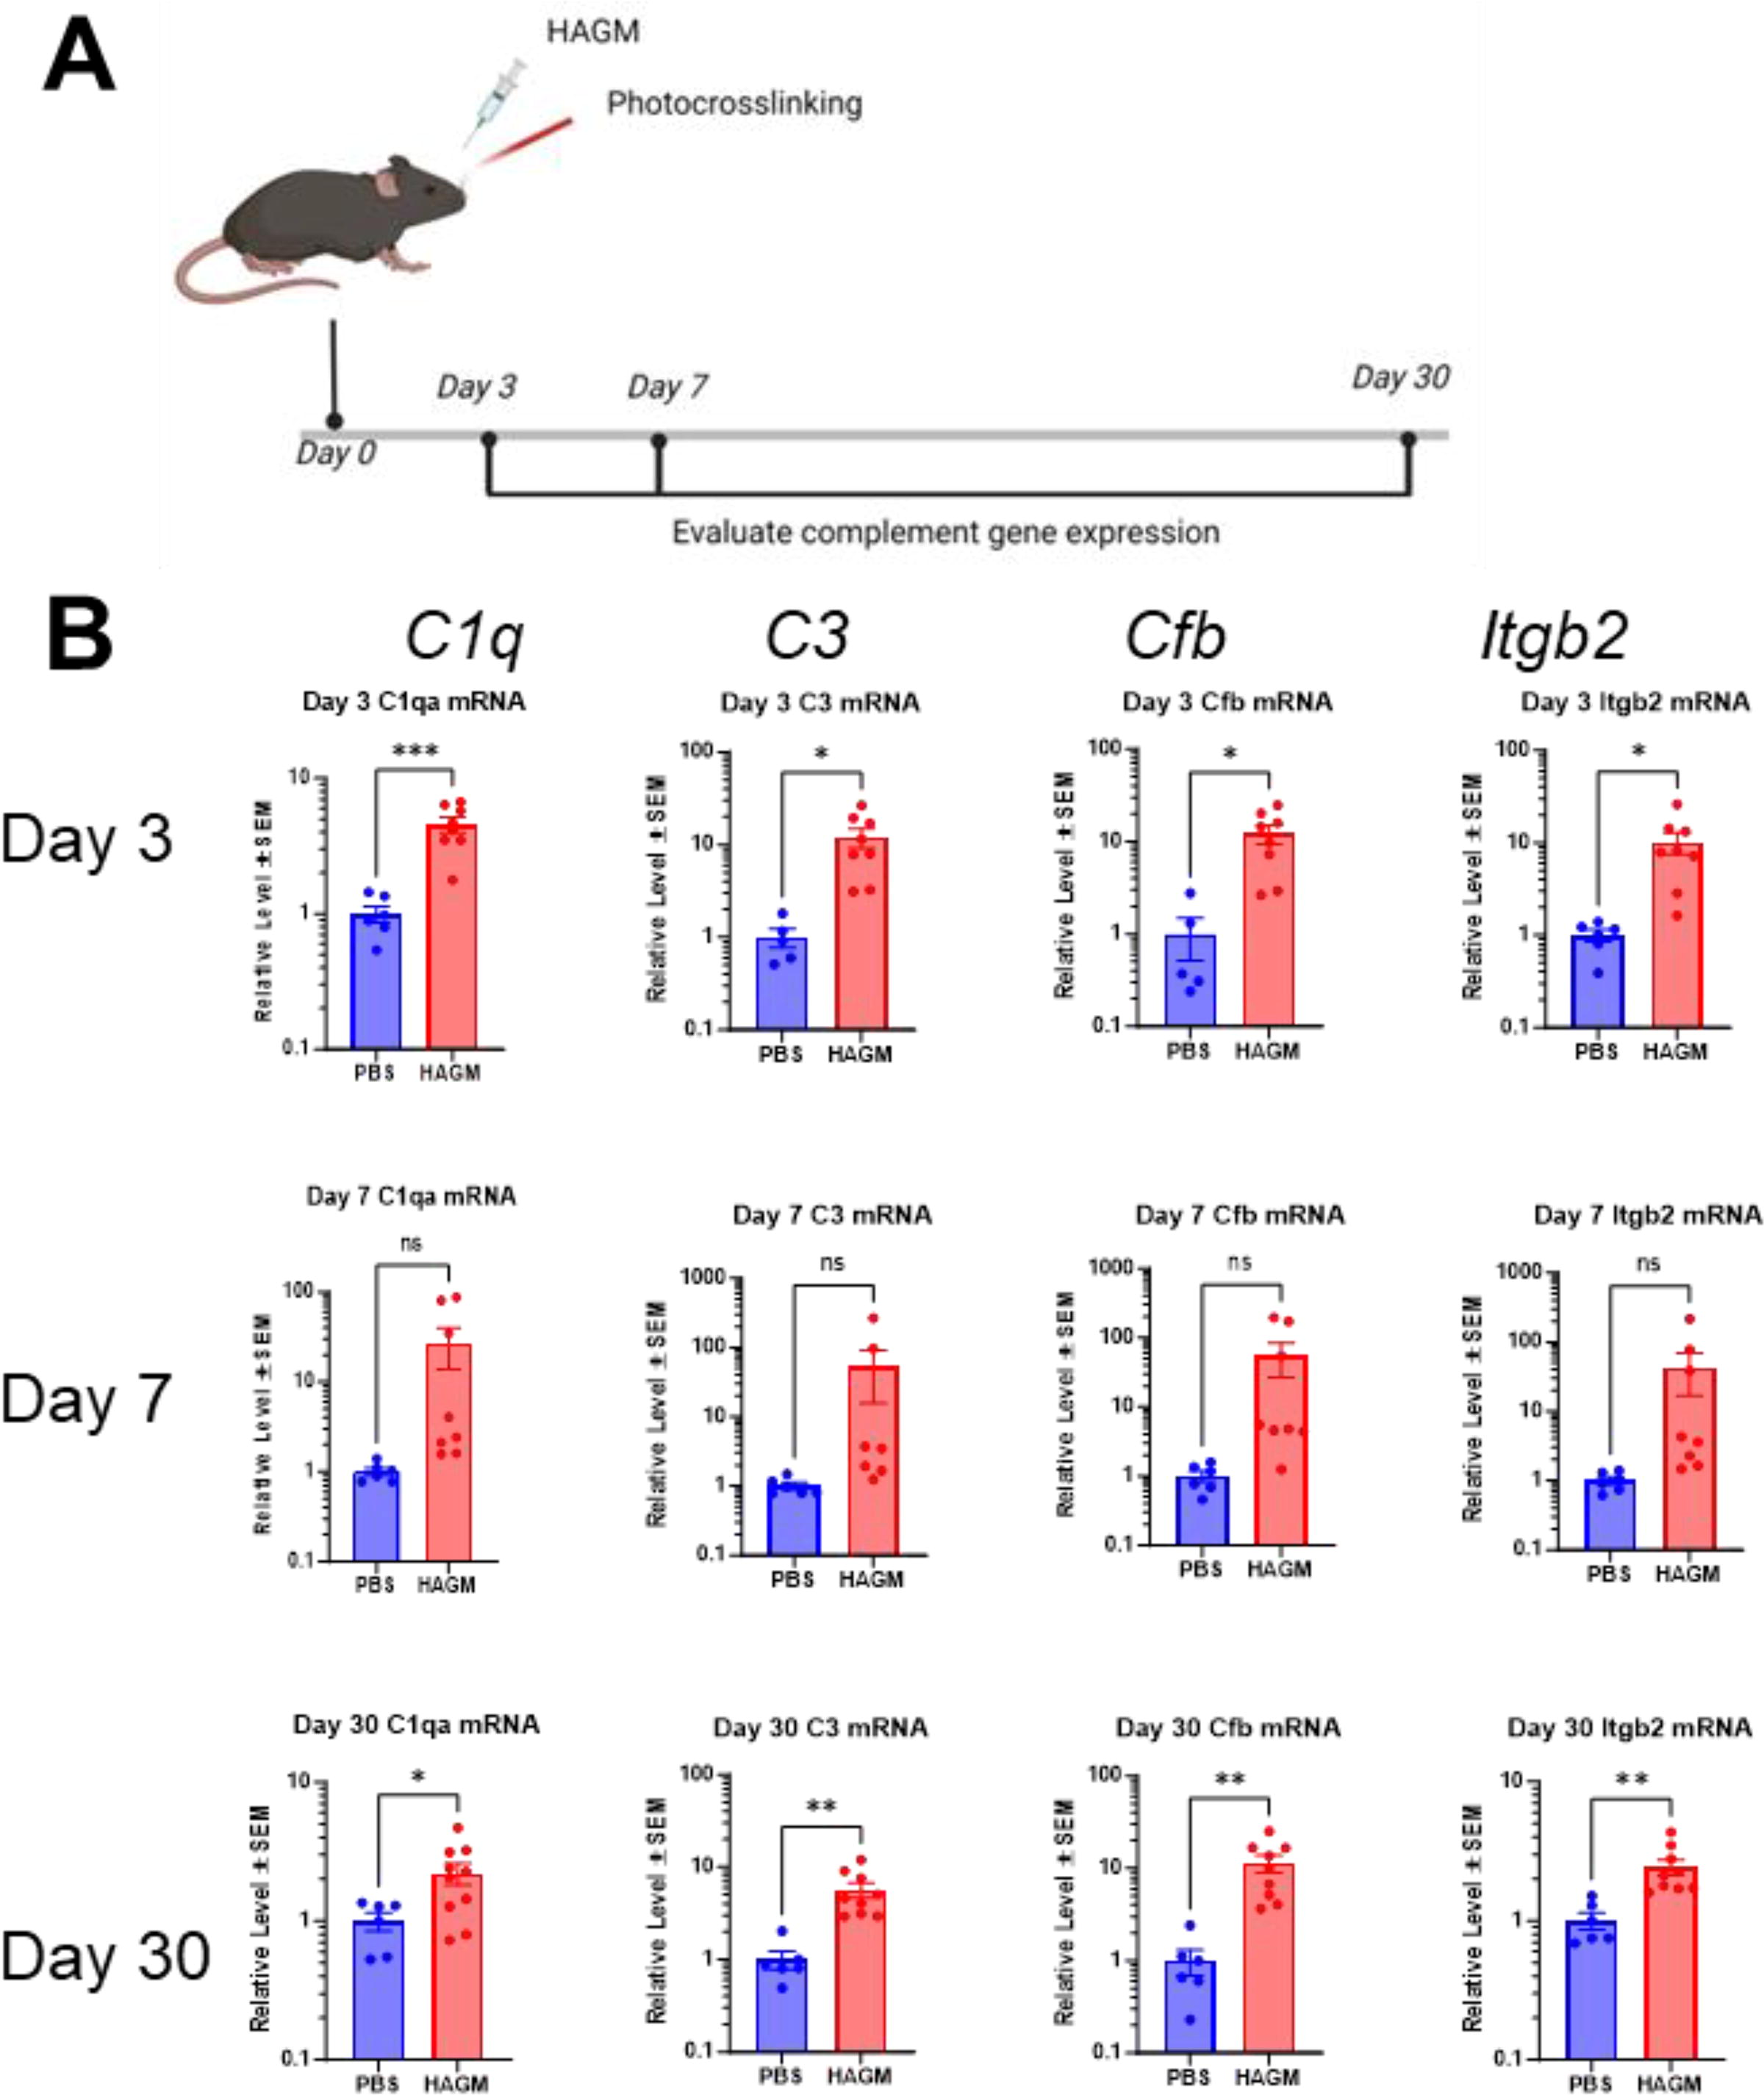
Upregulation of complement gene expression in mouse HAGM xl model.
Oral FB inhibitor ED-79-GX17 inhibits acute ocular complement activation in the murine HAGM and LPS models
A more accurate test of complement activation is to measure the levels of complement protein breakdown products as AP complement activation is a cascade of serine protease activities. The murine HAGM model was induced for 3 days where oral FB inhibitor was dosed daily at 200 mg/kg, followed by tissues collection (Fig. 4A). HAGM induced significant elevation of IOP (Fig. 4B). C3 and FB breakdown products, C3d, iC3b, and Ba, were measured in plasma, neural retina, and WEC (whole eye without lens and neural retina). Complement breakdown product levels in ocular tissues were elevated in the HAGM group relative to naive controls, whereas systemic complement was not affected by HAGM treatment (Fig. 4C).
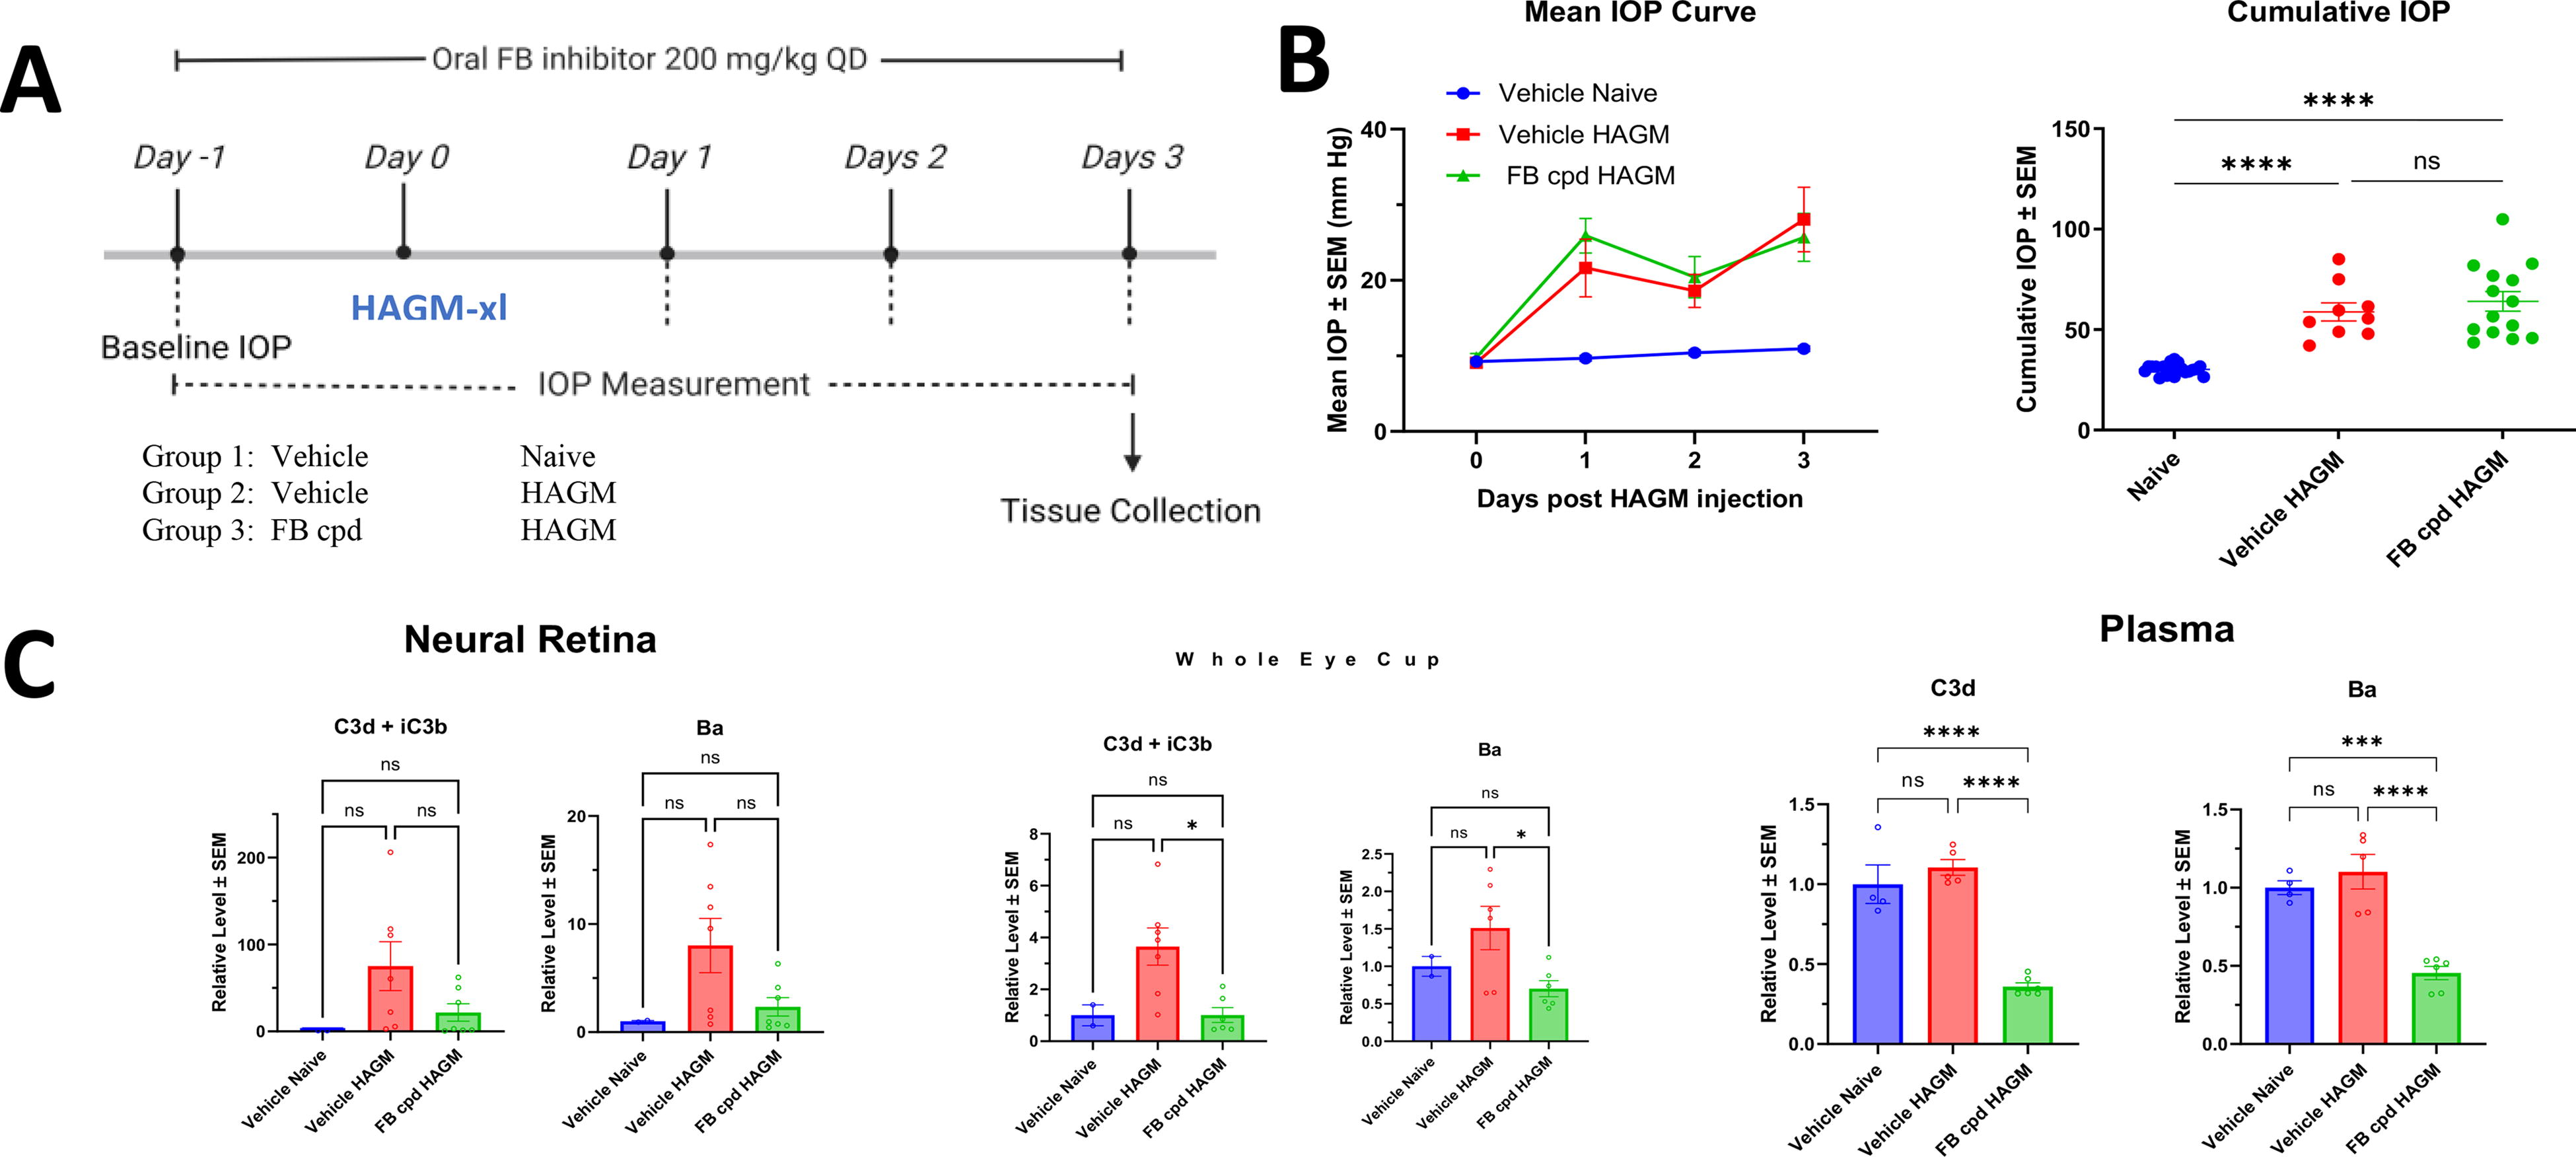
ED-79-GX17 potently inhibited HAGM induced ocular complement activation.
The in vivo potency of oral ED-79-GX17 was evaluated in a mouse LPS model 34 (Supplementary Fig. S2). ED-79-GX17 dose- and time-dependently inhibited LPS-induced systemic and ocular complement activation. At 30 mg/kg, ED-79-GX17 retained full inhibition 16 h after dosing with an exposure ∼1 µM, which is equivalent to systemic FB target concentration (Supplementary Figs. S2B and S3A), suggesting a 1:1 ratio of ED-79-GX17 molecule versus FB protein for 100% target inhibition.
Before evaluating complement FB inhibition on RGC/axon protection in the murine HAGM-induced glaucoma model, we first assessed the potency of a small molecular FB inhibitor, ED-79-GX17, on its ability to inhibit HAGM-induced ocular complement activation. Mice were dosed orally with ED-79-GX17 at 200 mg/kg daily from 1 day before HAGM injection. A single oral dose of ED-79-GX17 at 200 mg/kg was expected to fully inhibit FB for 24 h based on the observation from mouse LPS study. At day 3 after HAGM injection, ED-79-GX17 reduced 60%–80% ocular complement activity (i.e., retina and WEC) compared with the vehicle controls at 4 h after the last dosing (Fig. 4C). Although complement breakdown products in the plasma do not change with HAGM injection, ED-79-GX17 reduced plasma concentrations by 50–60% from baseline levels (Fig. 4C). HAGM-induced IOP at day 3 was not affected by ED-79-GX17 (Fig. 4B).
ED-79-GX17 did not prevent HAGM-induced neurodegeneration in mice
HAGM xl caused significant IOP elevation (∼2-fold increase from 10 to 20 mmHg) over vehicle-injected mouse eyes up to 28 days (Fig. 5A). Concomitantly, both RGC and axon loss were noted in the hypertensive murine eyes compared with that in vehicle-injected eyes. At the 30-day time point, RGC loss of ∼30% and axon loss of ∼40% were noted in the hypertensive murine eyes (Fig. 5B–E).
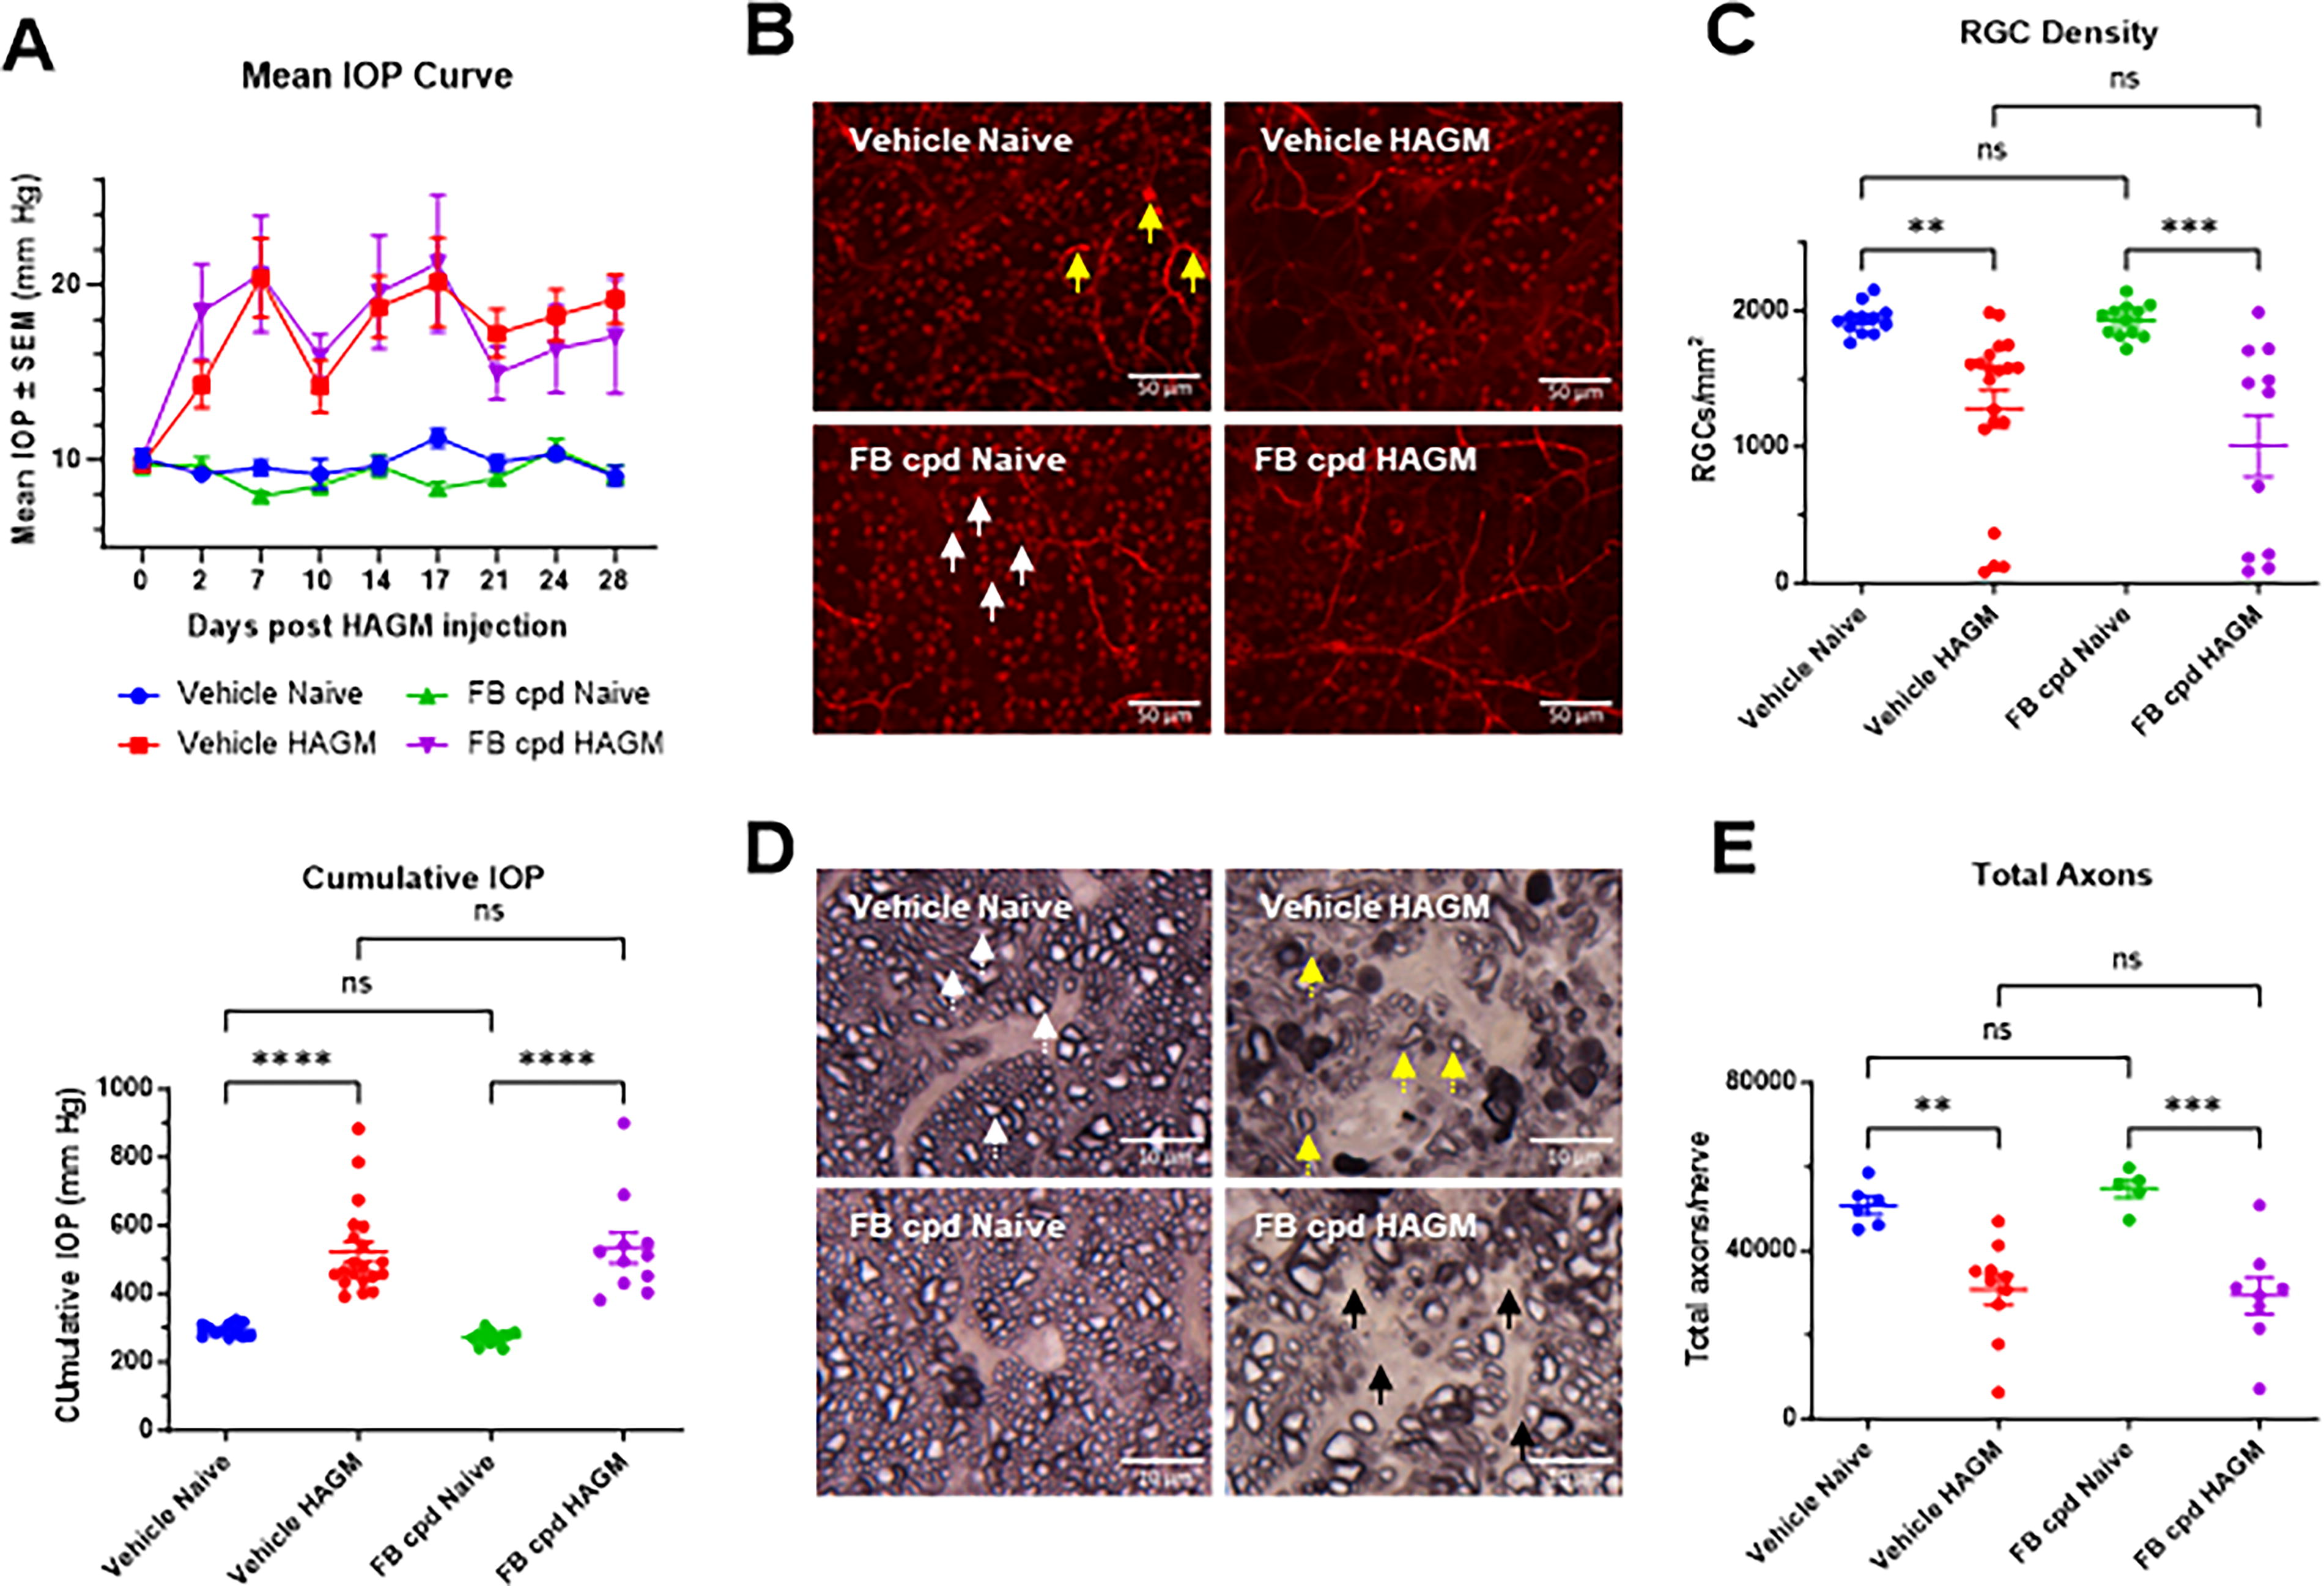
Systemic AP complement inhibition by ED-79-GX17 did not prevent RGC loss in the 30-day HAGM xl models.
We investigated whether an oral FB inhibitor could prevent glaucomatous pathology in the murine HAGM model. ED-79-GX17 was dosed at 200 mg/kg daily for the entire course of the 30-day model where significant RGC and axon losses have been documented. 24 As expected, ED-79-GX17 did not cause any changes of IOP elevation between compound-treated and vehicle control groups in IOP curve profile or normalized cumulative IOP at day 3 (Fig. 4B) and day 30 (Fig. 5A), even though reduction in FB breakdown products was noted in retina, WEC, and plasma with ED-79-GX17 (Fig. 4C). ED-79-GX17 treatment did not prevent RGC loss when compared with vehicle-treated HAGM mice as quantified by BRN3A immunoreactive retinal flat mounts (Figs. 5B, C). Similarly, ED-79-GX17 had no effect on HAGM-induced axon loss compared with vehicle controls (Fig. 5D, E). This suggests that daily oral complement FB inhibition by ED-79-GX17 (200 mg/kg) may not be sufficient to block the glaucomatous disease initiation and progression induced by HAGM injection. The half-life of ED-79-GX17 (30 mg/kg) was estimated to be around 18–24 h in plasma and eye tissue in the mouse LPS time course study (Supplementary Fig. S2). ED-79-GX17 exposure at 4 h after the last dosing at 200 mg/kg on day 30 of mouse HAGM model was on average 70 µM in plasma, 110 µM in WEC (whole eye minus lens, iris, and retina), and 20 µM in neural retina (Supplementary Fig. S3A). These exposure levels were >3-fold higher than the levels observed after 4-h exposure in LPS model (Supplementary Fig. S3B), suggesting full complement inhibition with >800 nM exposure at the trough level (i.e., 24 h after dosing).
CFB deletion partially reduces IOP elevation but not RGC and axon loss in murine HAGM-induced neurodegeneration
To test if complete AP complement deficiency could affect glaucomatous RGC loss, we evaluated Cfb knockout and WT littermate control mice in the HAGM model. There were no cumulative IOP changes between naive Cfb+/+ control and naive Cfb−/− mice. IOP was significantly elevated in both HAGM-induced groups compared with naive controls; however, HAGM-induced IOP elevation was significantly lower in Cfb knockout mice than that observed in WT littermate controls (P = 0.034; one-way ANOVA and Tukey’s multiple comparison test; Fig. 6A). The reasons for this finding are presently unclear. HAGM induced significant and similar RGC and axon loss in both genotypes (Fig. 6B, C).
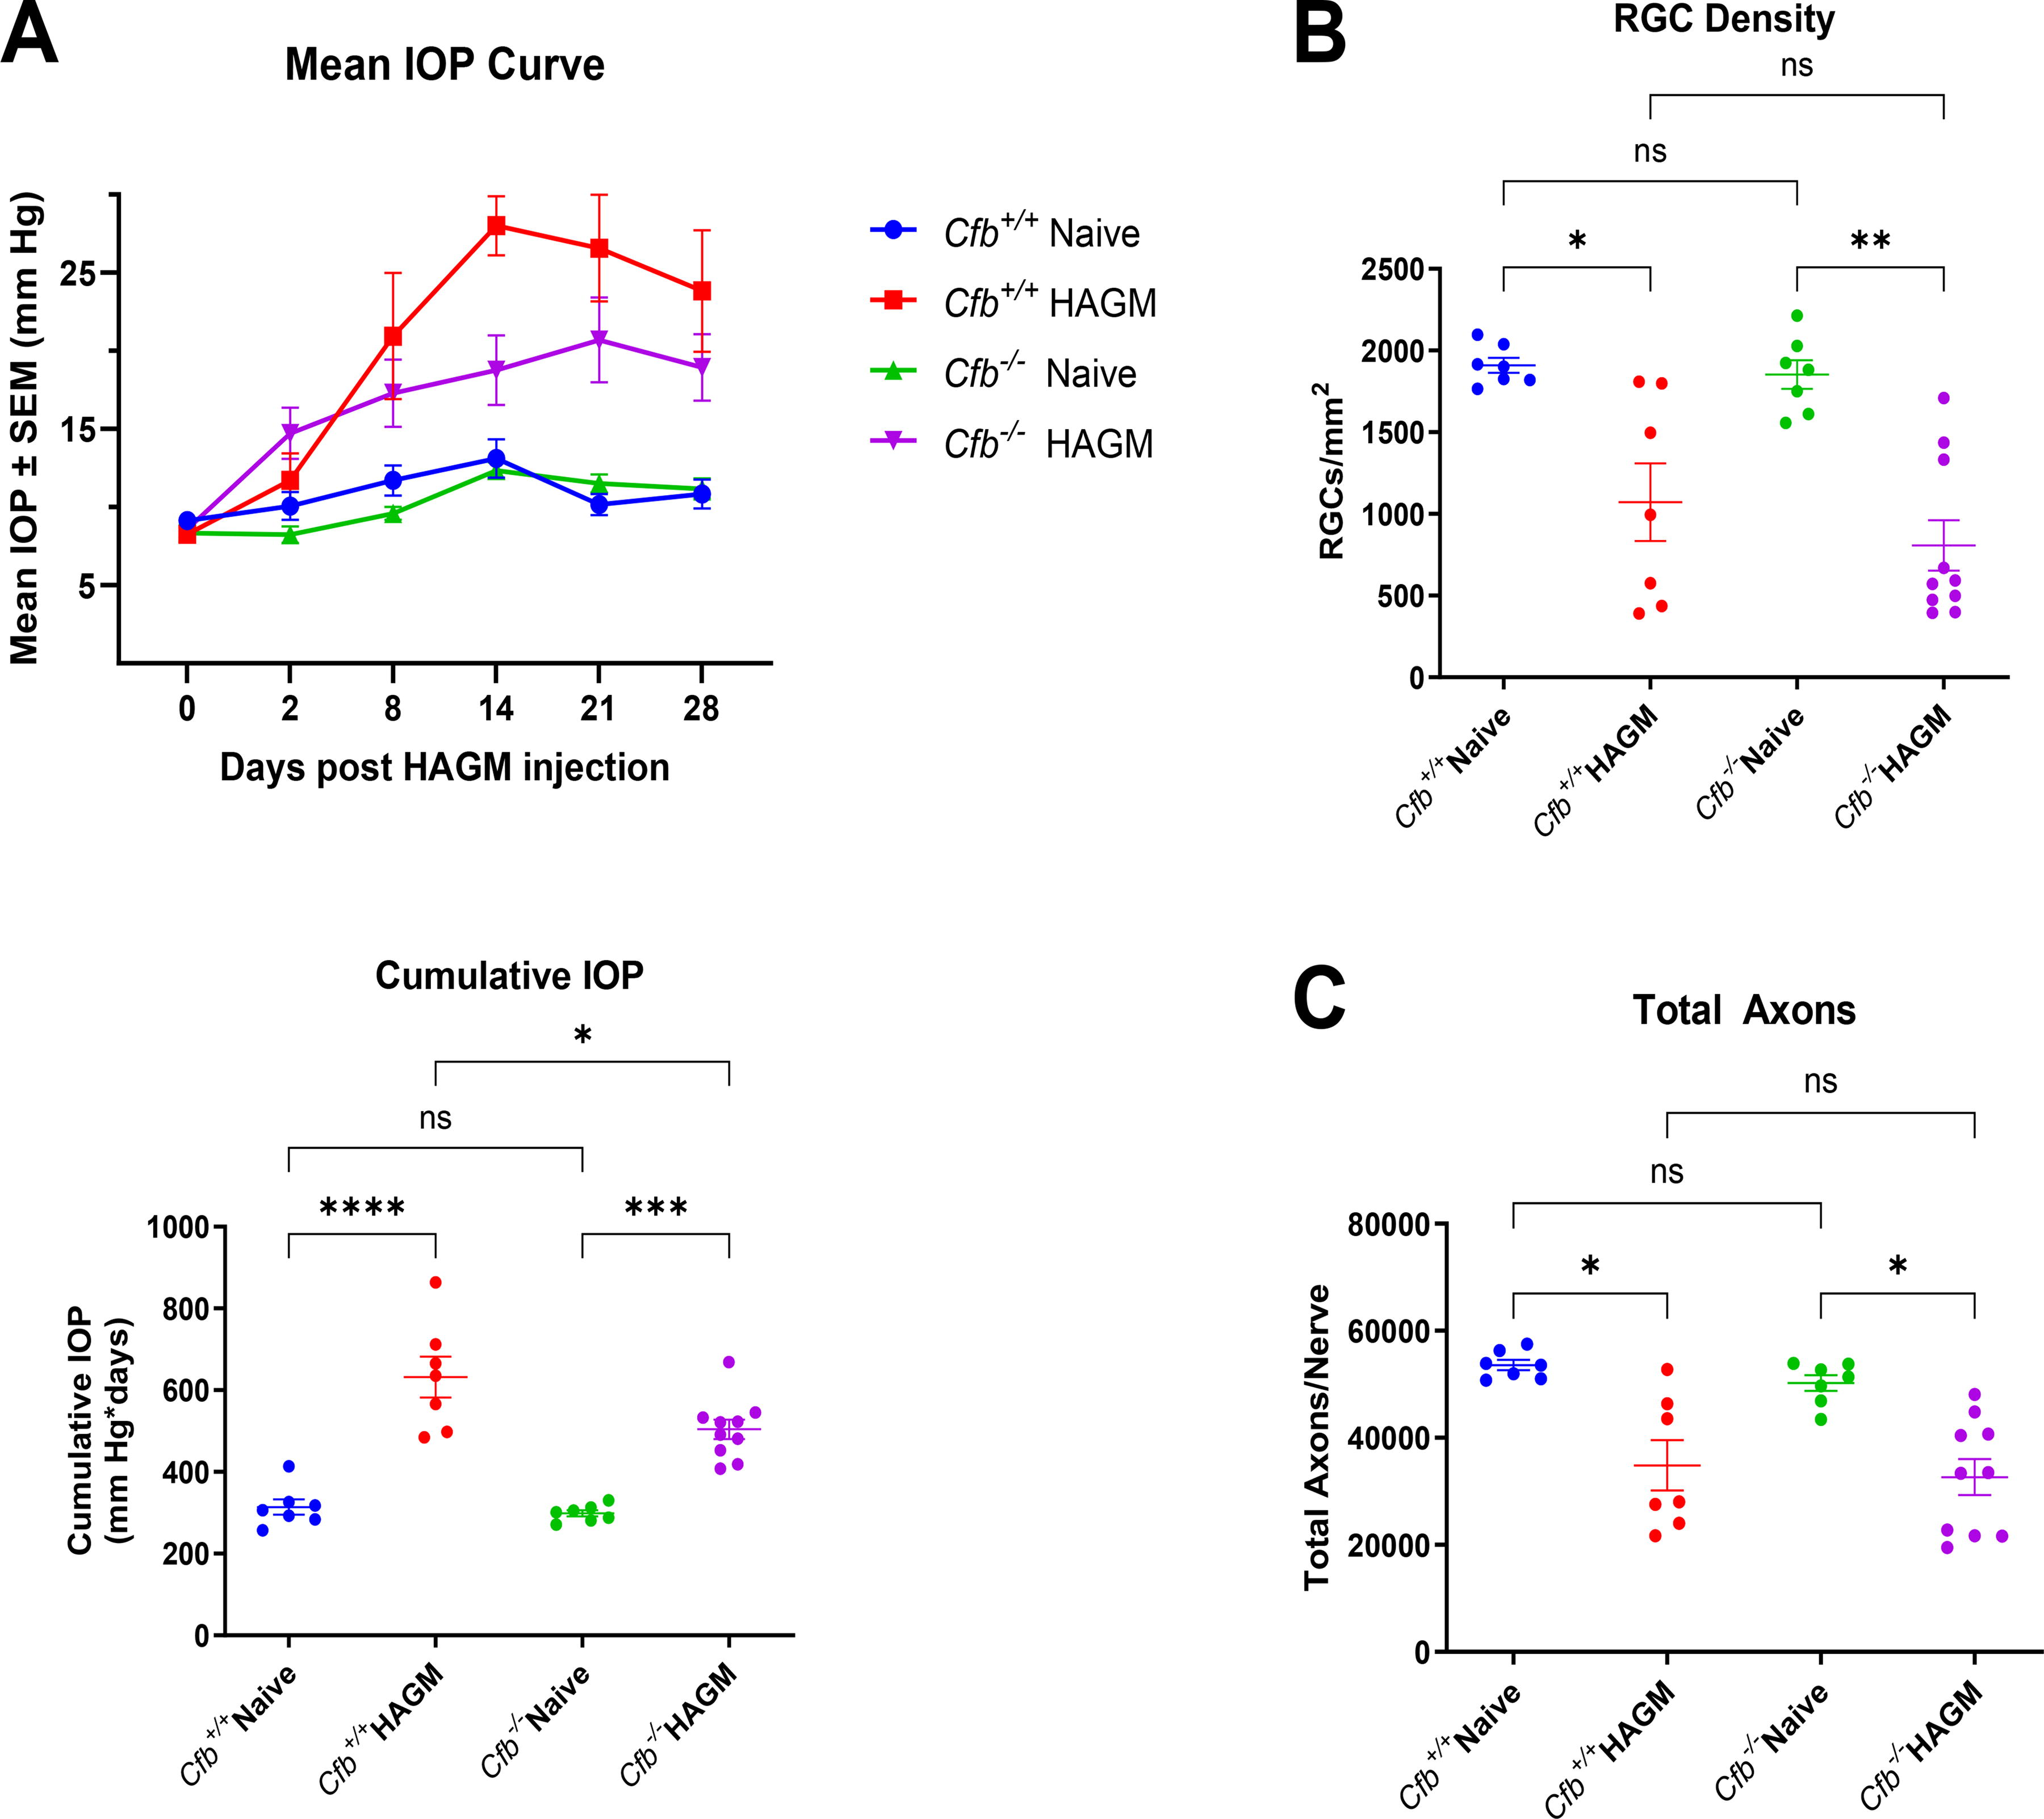
FB KO/deletion did not prevent RGC and axon loss in the HAGM xl model.
Discussion
This study demonstrated that there was significant RGC and axon loss at a 30-day time point along with an early upregulation of several complement factor transcripts, including FB in the retina following HAGM-induced ocular hypertension in mice. However, neither daily dosing of ED-79-GX17, a selective and potent FB inhibitor, nor Cfb knockout protected against RGC and axon loss in the ocular hypertensive state. Early confirmation of target engagement with ED-79-GX17 and drug exposure was noted in the retina, WEC, and plasma of ocular hypertensive WT mice following assessment of FB breakdown product reduction.
Complement activation in glaucomatous optic neuropathy has been known previously, and emerging evidence from postmortem human donor eye tissue assessment and preclinical models seem to further support its role in GON pathology.14–16,18,19,29 One of the ongoing challenges, however, has been the definitive identification of a specific pathway involving either the classical (e.g., C1q) or the alternative (e.g., FB) complement pathway to assess whether complement is a key driver of RGC loss in glaucoma. In addition to this pathway, central nodes in the complement cascade involving C3 and downstream executors, including C5, MAC, and so on, are also implicated.
Here, we sought out to determine the role of FB, and thus the alternative pathway, in promoting RGC and axon loss in a murine model of glaucomatous optic neuropathy. Analysis of human donor eye samples did not provide a definitive conclusion on the relevance of FB in glaucoma. Although we were able to confirm that there was an increase in CFB mRNA copies in the macular retina of human glaucoma donor tissues compared with age-matched non-glaucoma samples assessed by RNAScope, when a PCR-based approach was undertaken, there was no significant difference in CFB between glaucoma and non-glaucoma macular retina samples. The discrepancy could likely be explained by different methods, as a PCR-based approach lacks spatial resolution and takes the average of the entire retina compared with RNAScope, which can provide quantitative information on regional or cell-type specific mRNA copies. It was also interesting to note that the glaucomatous ONH contained ∼2-fold more CFB mRNA copies compared with that in macular retina. The predominant colocalization of CFB mRNA to IBA1-immunopositive, GFAP-positive, and in some cases, RBPMS-positive cells in human donor retina/ONH tissues further suggested that microglia, astrocytes, and some RGCs could produce CFB. Furthermore, C3 is a central driver of the downstream cascade via its convertase activity (e.g., C3b production), involved in synaptic pruning, and is known to be elevated in the nerve fiber layer of patients with ocular hypertension and POAG.19,29 Using a PCR-based approach, we determined that C3 mRNA levels in the macular retina were increased in human glaucomatous compared with non-glaucomatous donor tissues. Overall C3 mRNA levels were greater by an order of magnitude in non-glaucomatous and glaucomatous donor macular retinal tissues compared with CFB. These findings confirmed previous reports of a putative role for C3 in promoting RGC loss in glaucoma, 16 although there appears to also be an early protective role for C3 in the DBA/2J mouse model of glaucoma. 30 This early protective effect likely involves astrocytes and EGFR signaling.
Owing to this conflicting dual role for C3 in glaucoma and human eye analysis, we chose to focus on defining a role for FB and the AP in driving RGC and axon loss in glaucoma using a murine model of glaucoma (modified protocol using cross-linking of HAGM from our previous publication 24 ). The availability of Cfb knockout mice and selective FB inhibitor, ED-79-GX17, made it possible to consider or eliminate FB as a driver of RGC loss in glaucoma in this model. We noted an increase in several complement genes, including CFB, C3, and C1q, on days 3 (significantly elevated), 7 (trend noted), and 30 (significantly elevated) in the ocular hypertensive retinas of HAGM-injected mice. Stasi et al. showed elevated C1q mRNA and protein levels in retina of DBA2J mice at 9 through 15 months, where immunoreactive C1q was associated with Muller glia and astrocytes. 18 Also similar to our findings, in a microbead-induced glaucoma mouse model, Krishnan et al. have shown that mRNA expression of Gfap, cytokines (TNF-α, IL-1β, etc.), and complement genes (C1q, C3, etc.), appear to be elevated following 28 days of IOP elevation. 31 Some of the model-related differences between our current findings and external reports are unclear at this time but could be related to mRNA-to-protein differences. For instance, in our original report on the HAGM model, retinal GFAP protein was significantly increased at day 3 and day 30 compared with controls with more modest elevation noted on day 30, whereas Gfap mRNA was not elevated at day 30. 24 GFAP protein was not measured in the current study. Another possibility is that the number of samples per group was not adequately powered to demonstrate the difference in mRNA at different time points.
HAGM-induced ocular hypertensive mice dosed with the selective FB inhibitor, ED-79-GX17, showed evidence of target engagement in plasma, WEC, and retina (Fig. 4C) with levels of FB breakdown products, C3d+iC3b and Ba, suppressed by 70%–75% after 3 days of dosing. Drug exposure data are supportive of adequate levels of ED-79-GX17 required for suppressing FB breakdown products in the various ocular compartments and plasma (Supplementary Fig. S3). It is therefore anticipated that daily dosing of ED-79-GX17 would consistently suppress FB activation over the 30-day study duration in HAGM mice. However, it was clear that no RGC/axon protection was noted after 30 days of ocular hypertension in mice. We note that our findings are contrary to the work of Hoppe et al.32,33 who showed a protective role when FB was inhibited/knocked out in the microbead-induced glaucoma mouse model, laser-induced ocular hypertensive rat model, and optic nerve crush mouse models. There may be some reasons for these discrepancies, including methods to induce glaucomatous damage, differences in mouse strain backgrounds, and likely lack of availability of littermate controls used in experiments involving knockout mice in these external reports.
There are some caveats and limitations in our study. For example, we have not determined changes to FB protein levels in the mouse models (HAGM WT or CFB knockout mice). We observed ED-79-GX17 exposure to inner retina resulting in 70%–80% FB suppression in mouse at 200 mg/kg dose; however, higher doses may be necessary to fully suppress FB. Doses >200 mg/kg could be toxic or have off-target effects. CFB knockout mice could have compensatory activation of other complement factors (e.g., C1q and/or C3) in retina following ocular hypertension, 30 which were not assessed in our present study. As mentioned previously, power calculations for different biomarkers could require a greater number of samples per condition. We also did not measure protein levels for various biomarkers in the retina after 30-day treatment with ED-79-GX17. We have used Brn3a, a transcription factor for quantifying RGC loss, which are known to be reduced in dying neurons and therefore cannot be a consistent measure of surviving RGCs. Future studies in additional ocular hypertensive rodent models of glaucoma to test FB inhibitors could also consider using RBPMS (as was done for human donor sections in this study) as a method to quantify RGCs.
To summarize, a role for the AP in promoting RGC loss and optic nerve damage in glaucoma has been previously proposed. We and others have detected an increase in FB, C3b, C5, and so on, using RNAscope analysis in human donor glaucomatous retinal tissues forming the initial basis for the relevance of AP in disease. However, given the lack of any clinical data surrounding whether a complement inhibitor of the AP would prevent glaucomatous progression, we primarily relied on preclinical models to test the hypothesis on the potential involvement and therapeutic benefits of the same. We therefore undertook a systematic approach in ascertaining whether FB inhibition would be a potential therapeutic target for glaucomatous neuropathy. The fact that we were unable to protect RGCs and axons after an ocular hypertensive stress via 2 methods, that is, FB knockout mice and oral LMW FB inhibitor, ED-79-GX17, was quite convincing in likely ruling out a role of FB in RGC loss in glaucoma. Despite having adequate suppression of FB (as measured by target engagement, drug exposure, and suppression of FB breakdown product), the persistent loss of RGC in this model of glaucoma suggests that other complement pathway members (i.e., classical or other nodes of complement including C3) or several other factors could still be the drivers of neuropathy. These further point to the potential need for combination therapies involving classical pathway (e.g., C1q inhibition) as well as C3 or other AP inhibitors in glaucoma.
From a translatability perspective, the HAGM mouse model has several key features of human glaucoma, including molecular, biochemical, histopathological, and biomarker changes. 24 These changes also include complement proteins. However, the inability to assess ocular levels of FB and breakdown products in RGCs in living glaucoma patients is a huge gap. Vitreous humor levels may serve as a surrogate; however, repeated sampling before and after the complement inhibition in glaucoma patients is not a practical solution but could be considered in early clinical trials. Similar assessments in aqueous humor have been performed by Annexon when evaluating their anti-C1q inhibitor in glaucoma patients. Lastly, the translatability of therapeutic benefits from any glaucomatous neuroprotection preclinical model to human glaucoma remains a significant challenge (clinical endpoints, shorter trials, longitudinal assessments of ocular target biomarkers, etc.) and requires a high probability of success in demonstrating causality from preclinical studies. Although targeting FB did not meet the causality criterion preclinically in our hands, it is still possible to take an at-risk approach to advance an FB inhibitor for a clinical trial in glaucoma neuroprotection. However, its safety margins, trial design with clear endpoints to demonstrate proof of mechanism, and efficacy will have to be carefully considered. As mentioned earlier, there is also the risk and possibility of multiple complement pathway nodes, that is, C1q and C3, which may still be driving RGC and axon loss in glaucoma.
Footnotes
Acknowledgments
The authors thank Chris Towler, Sunita Yadav, Nag Chemuturi, and Yubin Qiu for their technical support. They also thank Christopher Wilson for critically reviewing the article. The authors would like to thank Lions Eye Research Institute, Tampa, FL, for providing human donor eye globes for the work performed herein. They are also thankful to the donors and their families for their valuable gift.
Authors’ Contributions
Conceived and designed the experiments: K.D., C.G., S.-M.L., A.C., and G.P. Performed the experiments: K.D., M.C., C.X., N.V., A.B., O.D., and N.B. Provided the FB inhibitor: C.M.A. Analyzed the data: K.D., M.C., C.X., N.V., and S.-M.L. Wrote the article: S.-M.L., C.X., K.D., and G.P.
Author Disclosure Statement
K.D., S.-M.L., M.C., C.X., C.M.A., N.V., A.B., O.D., N.B., A.C., C.G., and G.P. were employed by Biomedical Research, Novartis, Cambridge, MA, where this work was conducted.
Funding Information
This work is funded by Biomedical Research, Novartis.
References
Supplementary Material
Please find the following supplemental material available below.
For Open Access articles published under a Creative Commons License, all supplemental material carries the same license as the article it is associated with.
For non-Open Access articles published, all supplemental material carries a non-exclusive license, and permission requests for re-use of supplemental material or any part of supplemental material shall be sent directly to the copyright owner as specified in the copyright notice associated with the article.