
Abstract
Purpose:
The goal of this study was to develop a lot release assay for iPSC residuals following directed differentiation of iPSCs to retinal pigment epithelial (RPE) cells.
Methods:
RNA Sequencing (RNA Seq) of iPSCs and RPE derived from them was used to identify pluripotency markers downregulated in RPE cells. Quantitative real time PCR (qPCR) was then applied to assess iPSC residuals in iPSC-derived RPE. The limit of detection (LOD) of the assay was determined by performing spike-in assays with known quantities of iPSCs serially diluted into an RPE suspension.
Results:
ZSCAN10 and LIN28A were among 8 pluripotency markers identified by RNA Seq as downregulated in RPE. Based on copy number and expression of pseudogenes and lncRNAs ZSCAN10 and LIN28A were chosen for use in qPCR assays for residual iPSCs. Reverse transcription PCR indicated generally uniform expression of ZSCAN10 and LIN28A in 21 clones derived from 8 iPSC donors with no expression of either in RPE cells derived from 5 donor lines. Based on qPCR, ZSCAN10, and LIN28A expression in iPSCs was generally uniform. The LOD for ZSCAN10 and LIN28A in qPCR assays was determined using spike in assays of RPE derived from 2 iPSC lines. Analysis of ΔΔCt found the limit of detection to be <0.01% of cells, equivalent to <1 iPSC/10,000 RPE cells in both iPSC lines.
Conclusions:
qPCR for ZSCAN10 and LIN28A detects <1 in 10,000 residual iPSCs in a population of iPSC-derived RPE providing an adequate LOD of iPSC residuals for lot release testing.
Introduction
Pluripotent stem cells (PSCs) both embryonic (ESC) and induced (iPSC) have the capacity to generate any somatic cell in the body as well as more complex tissues.1,2 This process, termed directed differentiation allows for production of novel cell therapies for diseases as diverse as age-related macular degeneration (AMD),3–5 Parkinson’s disease, 6 and heart disease. 7 Human clinical trials are under way for all 3 of those diseases as well as others. In all cases the terminally differentiated cell derived from an ESC or iPSC is the biological drug product (DP) being applied therapeutically. One of the most important issues in development of ESC/iPSC derived cell-based therapies is to ensure the absence of residual PSCs that could cause tumors following transplantation. 8
All PSCs will form teratomas, a type of germ cell tumor characterized by the presence of multiple cell types. 9 The formation of a teratoma is considered definitive proof of pluripotency and is used to confirm the successful reprogramming of somatic cells to iPSCs.10,11 Conversely, following directed differentiation, the differentiated cell type or tissues derived from PSCs will not form a teratoma as it is no longer pluripotent. Differentiation of PSCs often results in mixed populations of cells requiring further purification or selection of the desired cell type. 12 Purity of the differentiated cells seldom reaches 100%, and the potential for residual PSCs in a population of PSC derived differentiated cells must be taken into account. This is especially important in manufacturing for cell-based therapies, as residual PSCs could form teratomas following transplantation. 13 Several labs have shown that in vivo teratoma formation requires as few as 100 iPSCs.13–15 To address the issue of iPSC manufacturing residuals, it is necessary to develop rapid, highly sensitive assays for detection of undifferentiated PSCs in the DP.8,12 Kuroda et al., 16 compared the use of tumorigenicity assays, flow cytometry, and qPCR to detect tumorigenic or undifferentiated iPSCs in a population of iPSC-derived retinal pigment epithelial (RPE) cells. Tumorigenicity assays, while a direct measure of tumor forming potential require months to perform and are thus too slow for use in release testing of a cell-based DP. Flow cytometry was complicated by issues regarding gating parameters and continued expression of cell surface carbohydrate epitopes such as SSEA and Tra-1–60 or Tra-1–80. On the other hand, qPCR was deemed superior due to short assay time (1 day) and high sensitivity. For LIN28A, the qPCR assay described was reported to have a limit of detection (LOD) of 1 in 50,000 cells. 16
Our laboratory is developing an allogeneic cell therapy for AMD.17–20 This therapy involves replacement of diseased RPE cells with iPSC-derived RPE cells. Our manufacturing process results in RPE with a purity of >99% based on flow cytometry analysis of CRALBP expression. In our initial manufacturing strategy, we proposed to use the qPCR-based assay proposed by Kuroda et al., 16 to identify residual iPSCs in the DP. However, based on feedback from the FDA it was suggested that assay of LIN28A alone would be insufficient for this purpose and that incorporation of multiple markers would be desirable. In the present study, we sought to identify additional pluripotency markers that could be used together with LIN28A to assay for iPSC impurities using qPCR. Our choice of qPCR was based on the sensitivity of the assay. To do this, we examined differences in pluripotency gene expression between iPSCs and RPE derived from them using RNA sequencing (RNA Seq). We found that all pluripotency markers examined were downregulated to varying degrees in iPSC-derived RPE. However, significant variable expression of NANOG, POU5F1, and LIN28B related pseudogenes or lncRNAs was also observed. Only LIN28A and ZSCAN10 were expressed at high levels in iPSCs, were nearly undetectable in iPSC-RPE, and did not exhibit expression of pseudogenes or lncRNAs in RPE that could confound results of qPCR-based assays. We then examined LIN28A and ZSCAN10 as markers for residual iPSCs in an iPSC-RPE population and determined the LOD for a qPCR-based assay. These data suggest that the combination of LIN28A and ZSCAN10 is a rapid and effective assay to identify the maximum percentage of residual iPSC contamination in iPSC-derived RPE, and possibly other cell types manufactured from iPSCs.
Materials & Methods
iPSCs
IMR90 clone 4 (IMR90) was obtained from WiCell (Madison WI). 21 iPSC lines 006-BIOTR-0001 clone 1; 011-BIOTR-0008 clones 8, 9, & 11; 011-BIOTR-0001 clones 138, 147, & 150; 011-BIOTR-0002 clones 201, 214, 221, & 223; and 011-BIOTR-0003 clones 15, 17, 19, 226, & 243, have been previously described,20,22,23 and were obtained through the Mayo Clinic BioTrust. The iPSC donor lines 300-BIOTR-0020 clones 1, 7, & 12 (20/1, 20/7, 20/12) and 300-BIOTR-0022 clones 1, 6, & 7 (20/1, 20/6, 20/7) were generated under cGMPs from dermal fibroblasts isolated from a skin biopsy obtained with IRB approval under informed consent from eligible 24-year-old Asian female (300-BIOTR-0020) and 25-year-old Caucasian female (300-BIOTR-0022) donors respectively. For these 2 iPSC lines, fibroblasts were expanded for 2 passages prior to cryopreservation. Following thaw, fibroblasts were reprogrammed using the Cytotune 2.1 kit (ThermoFIsher) with modifications to the manufacturers protocol. Differentiation of iPSCs to RPE was performed as previously described.22,23
Immunofluorescence
Immunofluorescence was performed as described previously22,23 on RPE grown on fibrin hydrogels for >30 days. Cells were embedded in paraffin and cut in 5 µm sections. Following deparaffinization and hydration, sections were subject to heat and pressure mediated antigen retrieval as described previously 24 and stained for BEST1 using rabbit, polyclonal antibody Pab125, 24 CD147 using mouse monoclonal antibody Tra-1–85 (R&D Systems), or CRALBP using mouse monoclonal antibody B2 (Novus). Immunofluorescence and transmitted light images were obtained on a Nikon E600 microscope (Nikon Instruments, Melville, New York, USA) using a CCD camera and Nikon Elements Software.
Western blotting and ELISA
Western blots were performed as before using a WES SimpleWestern automated immunoblot system (ProteinSimple, San Jose, California, USA) according to the manufacturer’s instructions using antibodies as reported previously. 23 Secretion of pigment epithelum-derived factor (PEDF) was determined as before 23 by ELISA using a kit obtained from R&D Systems (Minneapolis, Minnesota, USA).
Flow cytometry
RPE or iPSCs were dissociated using Accumax™ (Innovative Cell Technologies) and fixed for 10 min in 2% paraformaldehyde. Following fixation, cells were permeabilized in −20°C methanol for 10 min. After rehydration in PBS, cells were stained using mouse anti-CRALBP monoclonal antibody B2 (NOVUS) followed by a phycoerythrin (PE) coupled Goat anti-Mouse IgG1 secondary antibody (Invitrogen). Stained cells were analyzed using a BD FACS Aria II (BD Biosciences). Data were analyzed using Flowjo Software (Tree Star).
RNA-sequencing
RNA Seq and differential gene expression analysis was performed by Azenta Life Sciences (Chelmsford, Massachusetts) on 3 samples each of 22/1 iPSCs and 3 samples of RPE cells derived from them. Reads were aligned and mapped to the HG38 genome assembly. Raw data were deposited in the NCBI Gene Expression Omnibus (GEO) database under the following Accession numbers: GSE276359, GSM8497022, GSM8497023, GSM8497024, GSM8497025, GSM8497026, & GSM8497027. Processed data are provided in the Supplementary Data S1.
RNA extraction and cDNA synthesis
RNA was extracted from cell pellets using TRIzol™ LS (ThermoFisher Scientific) and was further purified using a Zymo RNA Clean & Concentrator™−5 kit (Zymo Research, Irvine, California) following manufacturer’s instructions as before. 25 RNA concentration was measured using a NanoDrop™ ND-1000 Spectrophotometer (ThermoFisher Scientific). After obtaining an RNA concentration, genomic DNA was removed using RNase free DNase1 (Millipore Sigma). cDNA was synthesized using SuperScript™ IV VILO™ Master Mix (ThermoFisher Scientific) following manufacturer’s instructions. Once the cDNA was generated, the sample was treated with RNase at 37°C for 20 min and stored at −20°C until use.
Reverse- Transcription PCR
RT-PCR was performed using the following primers: GAPDH (CTCTGCTCCTCCTGTTCGAC, ACCAAATCCGTTGACTCCGA); ZSCAN10 (CTGACCCACTCCTCCGAAC, CCTTACTCTCAGGAGCGCAG), and LIN28A (GGAAAGAGCATGCAGAAGCG, TGATGCTCTGGCAGAAGTGG). Each PCR reaction contained 12.5 ul 2X GoTaq® Green Master Mix (Promega), 9 uL water, 2.5 uL primers at 10 uM, and 1 uL of cDNA at 0 or 20 ng/uL. The PCR program was 94°C for 2 min, 30x Cycles of 94°C for 30 s, 60°C for 60 s, and 72°C for 60 s, with a final extension for 5 min at 72°C before being held at 4°C PCR products were analyzed using 2% E-Gel™ Agarose Gels with SYBR™ Safe DNA Gel Stain (ThermoFisher Scientific).
SybrGreen qPCR
qPCR using SYBR™ Green Master Mix was performed on 1 ng of each iPSC clone cDNA for ZSCAN10 and GAPDH in quadruplicate, along with no template controls; Each well contained 10 uL SYBR Green PCR 2x Master Mix (ThermoFisher Scientific), 1 uL primers at 10 uM, 5 uL H2O, and 9 uL template cDNA at 0.111 ng/uL. Primers sequences used were the same as those used for RT-PCR. No template controls were also set up using the same formula, but instead used 9 uL H2O instead of cDNA. QPCR was performed in a QuantStudio™5 qPCR system and analyzed using QuantStudio™ Design & Analysis Software v1.3.1.
Spike ins
300-BioTr-0022 CL1 or 006-BIOTR-0001 CL1 RPE cells and iPSC cells were digested with Accumax™ to achieve a single cell suspension. Total cell counts were gathered using a Cellometer Auto 2000, using AOPI stain to count iPSCs and Brightfield to count RPE. A working concentration was made with 111,111 iPSCs added to 999,999 RPE cells (1:10) and thoroughly mixed. Five by 10-fold serial dilutions of the 1:10 iPSC:RPE cell suspension were prepared by diluting into an RPE cell suspension. This corresponded to an iPSC concentration of 1.0% through 0.0001%. RNA and cDNA were extracted and synthesized as described above.
TaqMan™ qPCR
QPCR was performed using 10 ng of cDNA and TaqMan™ Gene Expression Assays for ZSCAN10 (Hs00262301_m1), LIN28A (Hs04189307_g1), and β-actin (Hs01060665_g1) or GAPDH (Hs02786624_g1) in quadruplicate, along with no template controls. TaqMan™ Universal PCR Master Mix (ThermoFisher Scientific) was used with FAM-MGM Dye. qPCR was run on an Applied Biosystems QuantStudio 5 qPCR instrument using the following conditions: Hold Stage: 50°C for 2 min, 90°C for 10 min; PCR Stage 95°C for 15 s, 60°C for 1 min for 40x Cycles. Data analysis was performed using QuantStudio™ Design & Analysis Software v1.3.1. Relative expression of LIN28A and ZSCAN10 were calculated using ΔCt referenced against the housekeeping gene β-actin. Ct was set to 40 (max cycle number) for wells in which no amplification was observed. Expression between samples was compared using the ΔΔCt method.
Results
Differential expression of pluripotency genes in iPSCs vs iPSC-derived RPE
To identify changes in gene expression that correlated with loss of pluripotency following RPE differentiation, we performed RNA Seq using RNA isolated from iPSCs and RPE derived from them. In our initial experiments the iPSC line 300-BIOTR-0022 clone 1 (22/1) was used. This iPSC line was generated using GMPs from dermal fibroblasts obtained from a donor eligible (21 CFR 1271) 25-year-old female Caucasian donor that were reprogrammed using replication deficient Sendai virus vectors to deliver the reprogramming factors (Cytotune 2.1). The iPSCs were determined to be pluripotent on the basis of pluripotency marker expression (SSEA, OCT4, Nanog, Tra-1–60) assessed by flow cytometry and immunohistochemistry, and ability to produce ectoderm, endoderm, and mesoderm in a trilineage differentiation assay (data not shown). A cell bank of 22/1 was produced and cryopreserved 37 passages from the initial biopsy sample. The cells maintained a 46XX karyotype and were Sendai virus free based on qPCR and RNA Seq (data not shown). The directed differentiation of RPE cells from 22/1 iPSCs was accomplished using previously published protocols with modifications as described in methods. Two distinct lots of RPE were used for RNA Seq, both derived from the iPSC cell bank at the same passage. Characterization of RPE cells (Fig. 1) included analysis of morphological appearance (Fig. 1A, B), expression of RPE phenotype markers (Fig. 1C & D), and PEDF secretion (Fig. 1E). Based on flow cytometry analysis of CRALBP expression (Fig. 1F–H), >99% of differentiated cells were RPE.
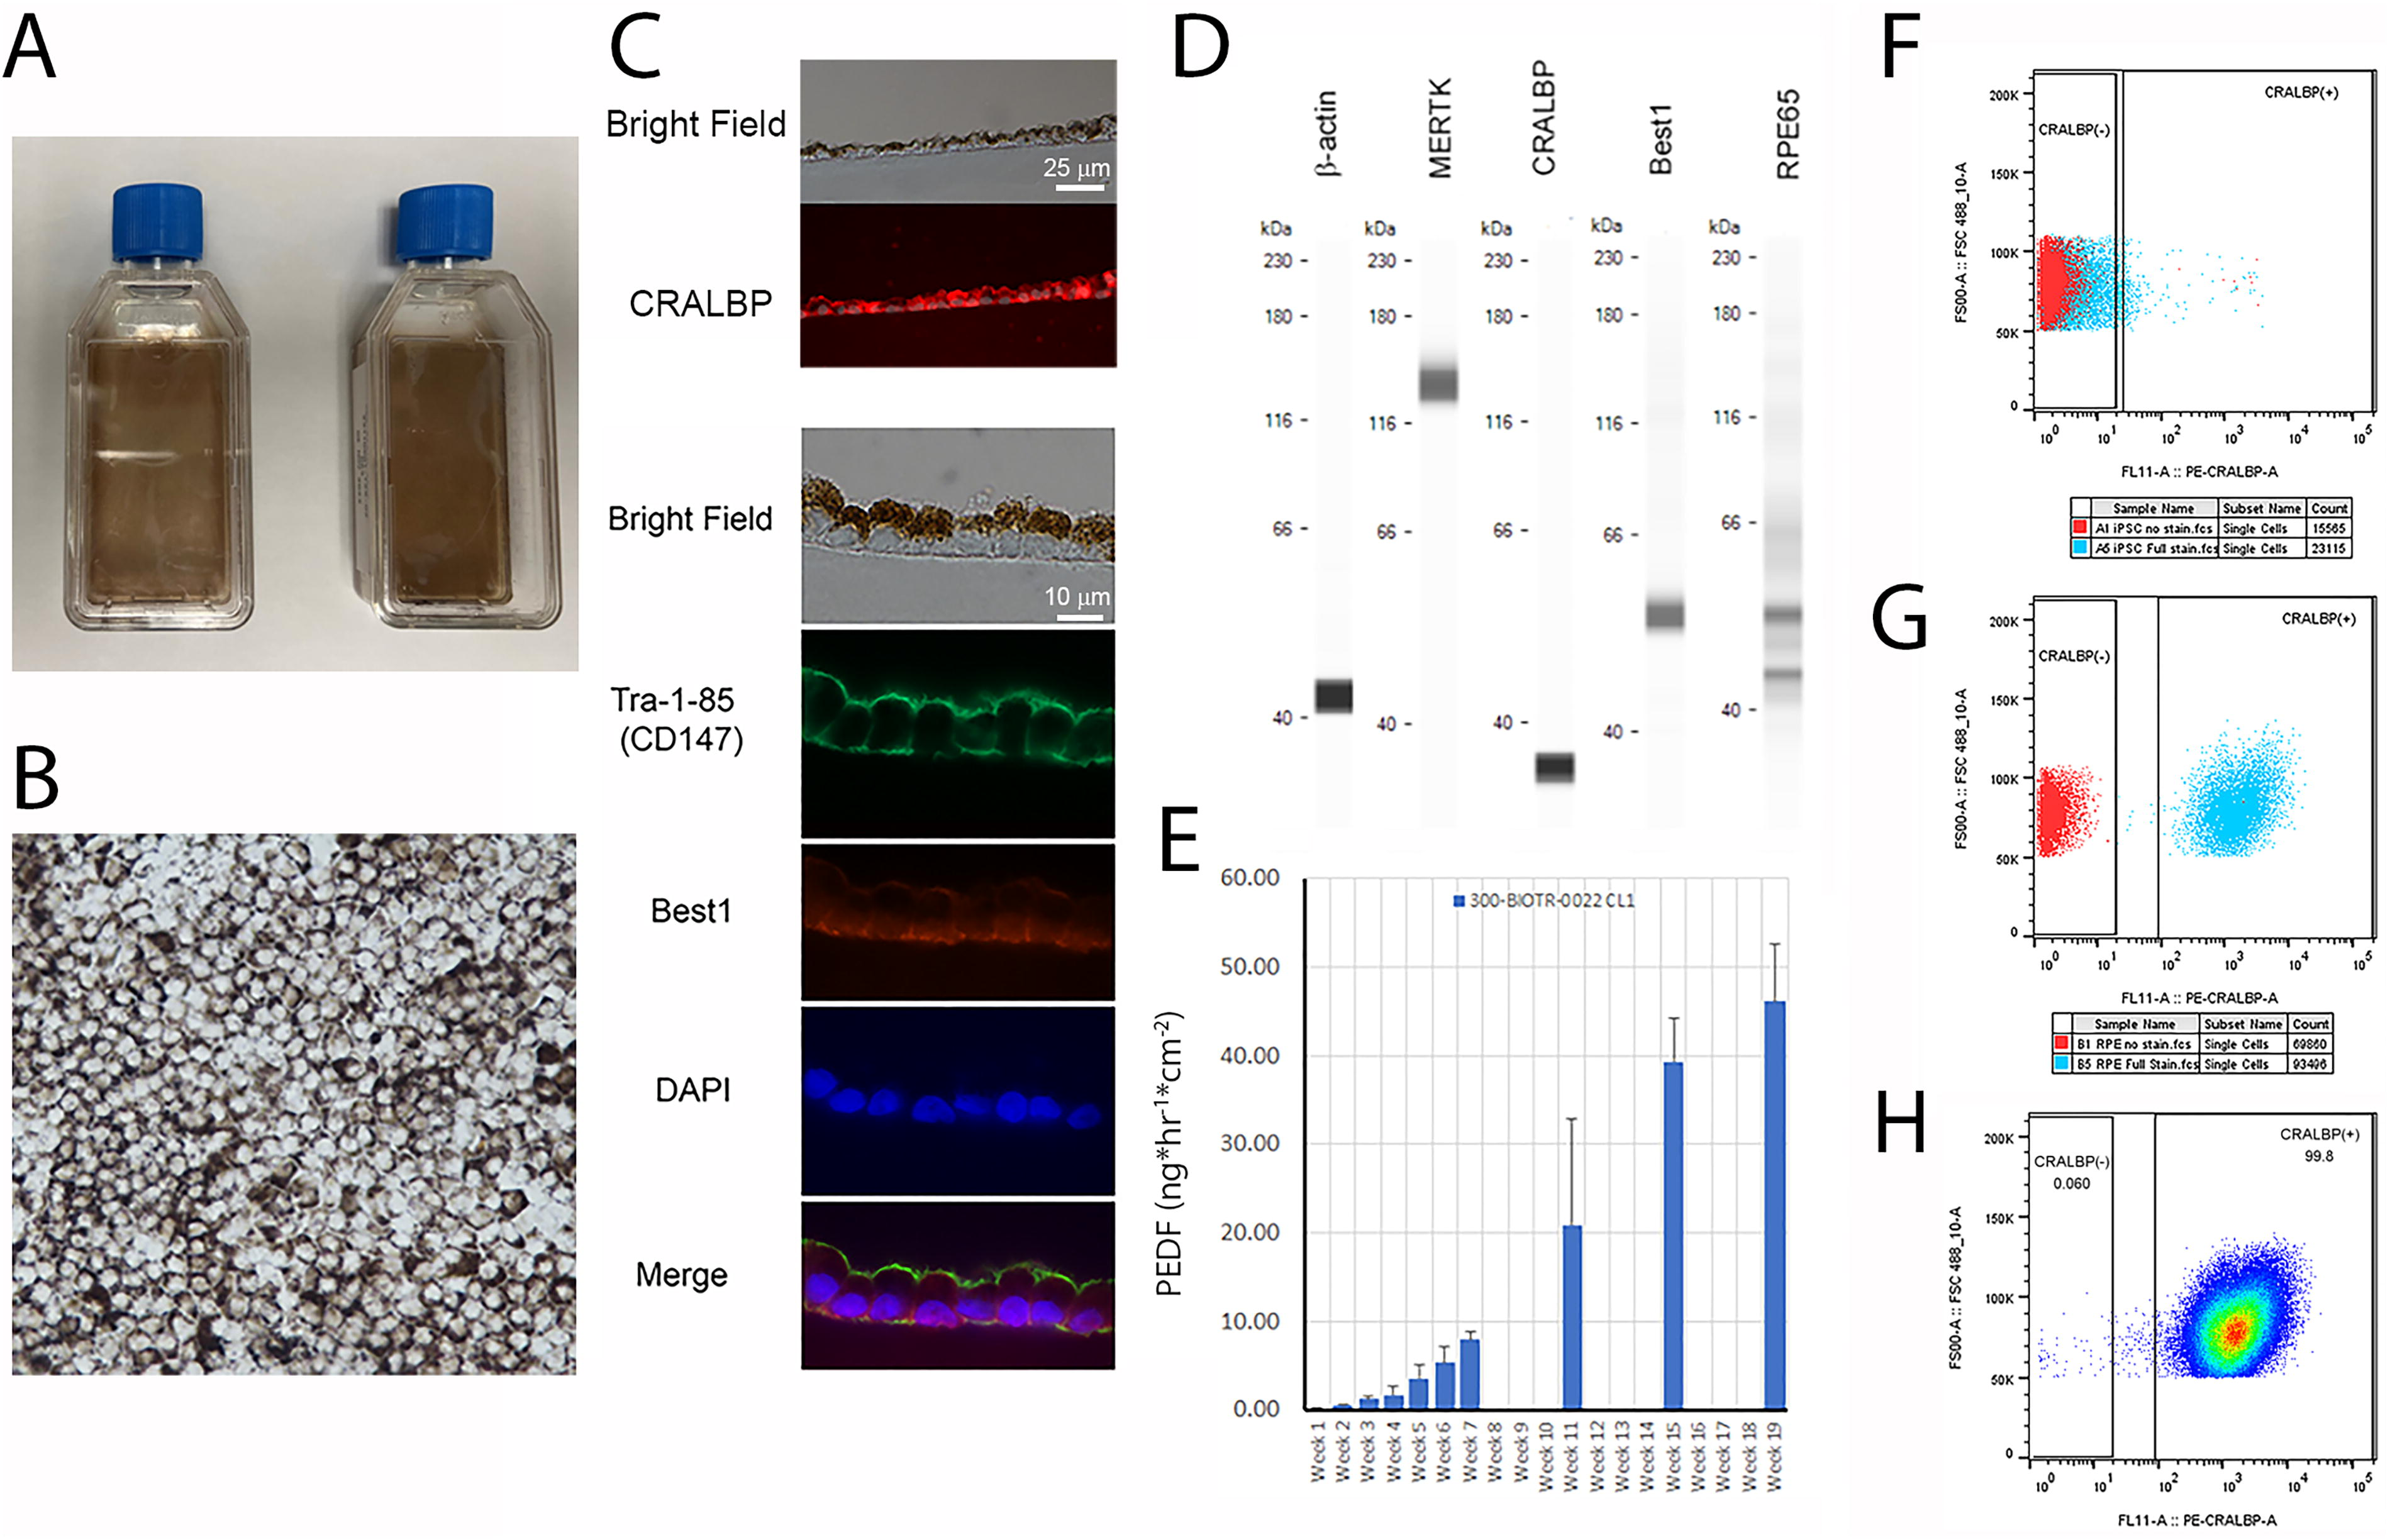
Characterization of iPSC-derived RPE used for RNA Seq. RPE in T25 flasks develop dark pigmentation after 30 days in culture
Processed RNASeq data (see Supplementary Data S1) was sorted for genes that were differentially expressed in iPSCs versus RPE cells. From this list, we identified 13 genes known to be markers of pluripotency which exhibited a log-2-fold change in enrichment ranging from 1.3 to as high as 10.46 in iPSCs versus RPE (Table 1). Of these genes, 8 were among the top 100 genes downregulated as a result of differentiation to RPE. Included in this list was POU5F1 (which encodes OCT4) as well as NANOG. Both genes were abundantly expressed in iPSCs and expressed at only very low copy numbers in RPE cells (Table 1). However, as shown in Table 2, we found expression of 3 NANOG and 4 POU5F1 pseudogenes in RPE or iPSCs. In the case of NANOGP5, expression was significantly (P < 3 x 10¹⁶) enriched in the RPE. All 4 POU5F1 pseudogenes were slightly enriched in RPE versus iPSCs. Although the copy numbers of POU5F1 and NANOG pseudogenes were low in RPE relative to iPCSs, we concluded that these pseudogenes and lncRNAs could confound a PCR-based impurities assay using NANOG or POU5F to assess the presence of iPSC residuals. Further examination of the pluripotency markers in Table 1, indicated that TERT, FOXD3, ZSCAN10, and LIN28A, exhibited log-2-fold changes greater than those observed for NANOG and POU5F1. However, the copy numbers observed for FOXD3 and TERT were ∼10–100-fold lower than for LIN28A and ZSCAN10 in iPSCs. Lin28a has been previously used in a qPCR assay for residual iPSCs in a population of iPSC-derived RPE, 16 and has been used in the reprogramming of cells to iPSCs in place of MYC. 21 In contrast, ZSCAN10 has not been previously characterized of the detection of iPSC residuals or as a reprogramming factor. For these reasons, ZSCAN10 was determined to be the best candidate for developing an additional qPCR assay.
Differential Expression of Pluripotency Genes in iPSCs vs RPE
iPSC versus RPE.
Gene used to reprogram the 22/1 iPSC line.
Expression of Pseudogenes and lncRNAs for Pluripotency Markers in Table 1
iPSC versus RPE.
ZSCAN10 and LIN28A expression in iPSCs and RPE
To confirm the RNA Seq results and determine whether ZSCAN10 expression is ubiquitous in iPSCs, we performed qPCR using SYBR Green. qPCR was performed using cDNA isolated from 22 iPSC clones isolated from 8 different donors. As shown in Figure 2A, all iPSC clones tested were positive for ZSCAN10 expression with ΔCt in the range of 5–8. Though there was clonal variation within different donor iPSC lines (Fig. 2A), when examined by donor (Fig. 2B) the average and standard error of ΔCt for the combined 8 donor samples was 6.87 ± 0.16. Overall, there was no significant difference in ZSCAN10 expression among the 22 clones when examined by either donor or clone (P = 0.334 between donors and P = 0.185 for all clones tested).
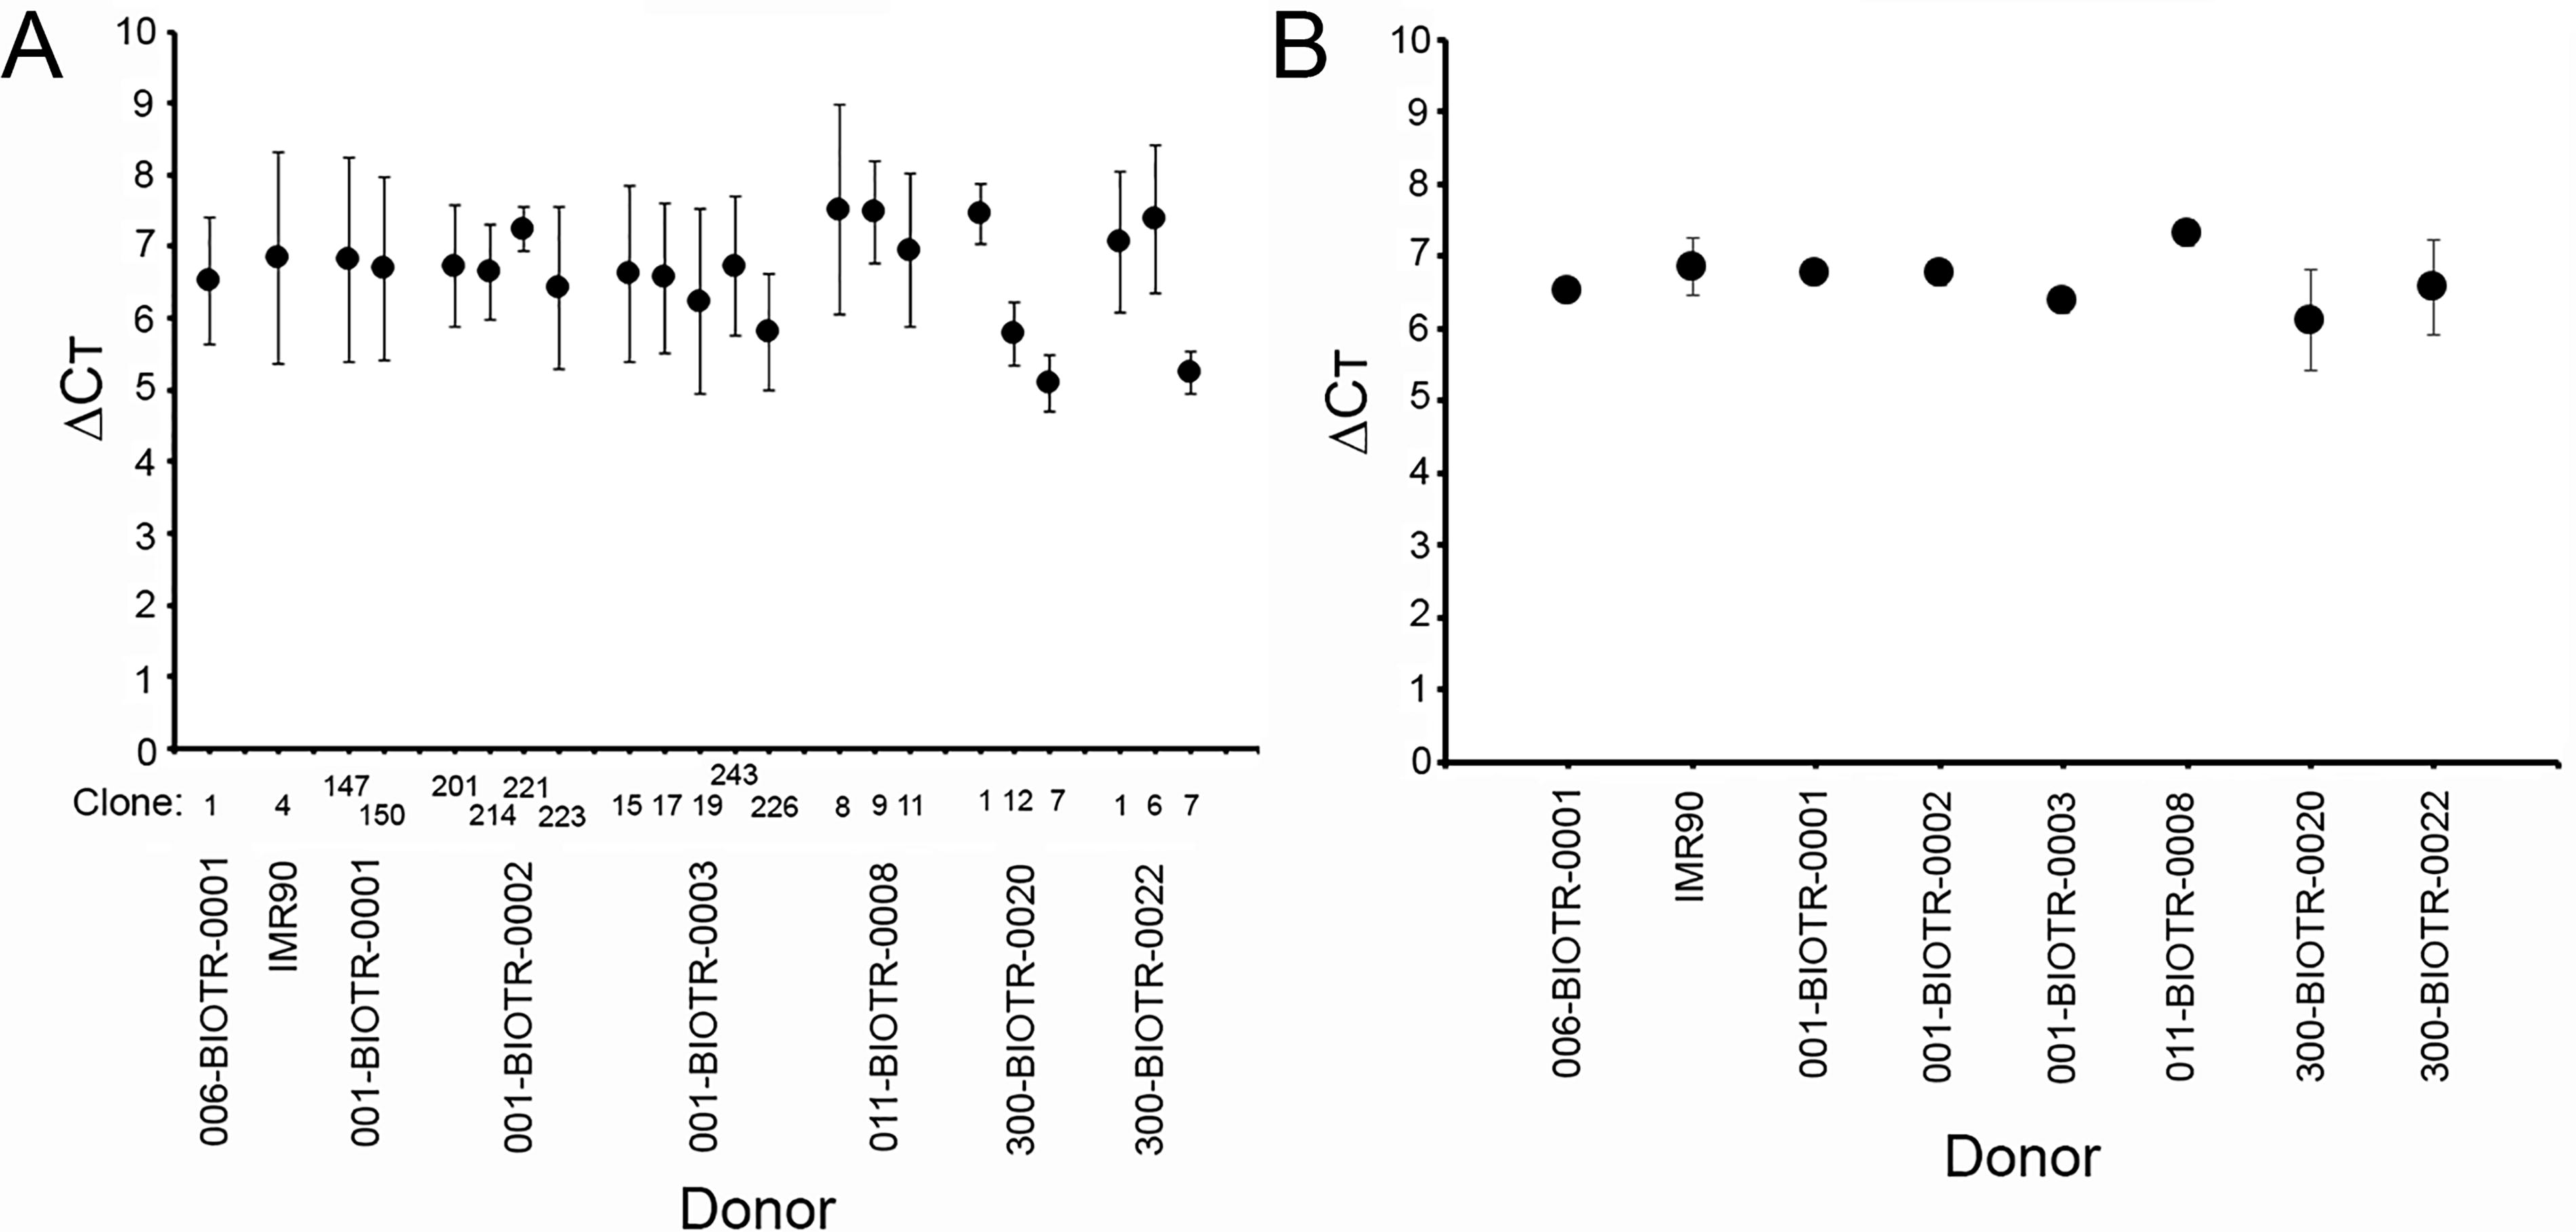
Expression of ZSCAN10 in iPSCs.
To determine whether ZSCAN10 or LIN28A are expressed in iPSC-derived RPE, we performed reverse transcription PCR (RT-PCR) using cDNA isolated from iPSC-RPE differentiated from iPSC lines from 5 different donors. As shown in Figure 3, ZSCAN10 and LIN28A were detected in iPSCs by RT-PCR but not in RPE derived from the same iPSCs. Based on these data, we conclude that both ZSCAN10 and LIN28A are pluripotency markers that are not significantly expressed in iPSC-derived RPE confirming that they could potentially be used to identify residual iPSCs in the differentiated RPE cell population by qPCR.
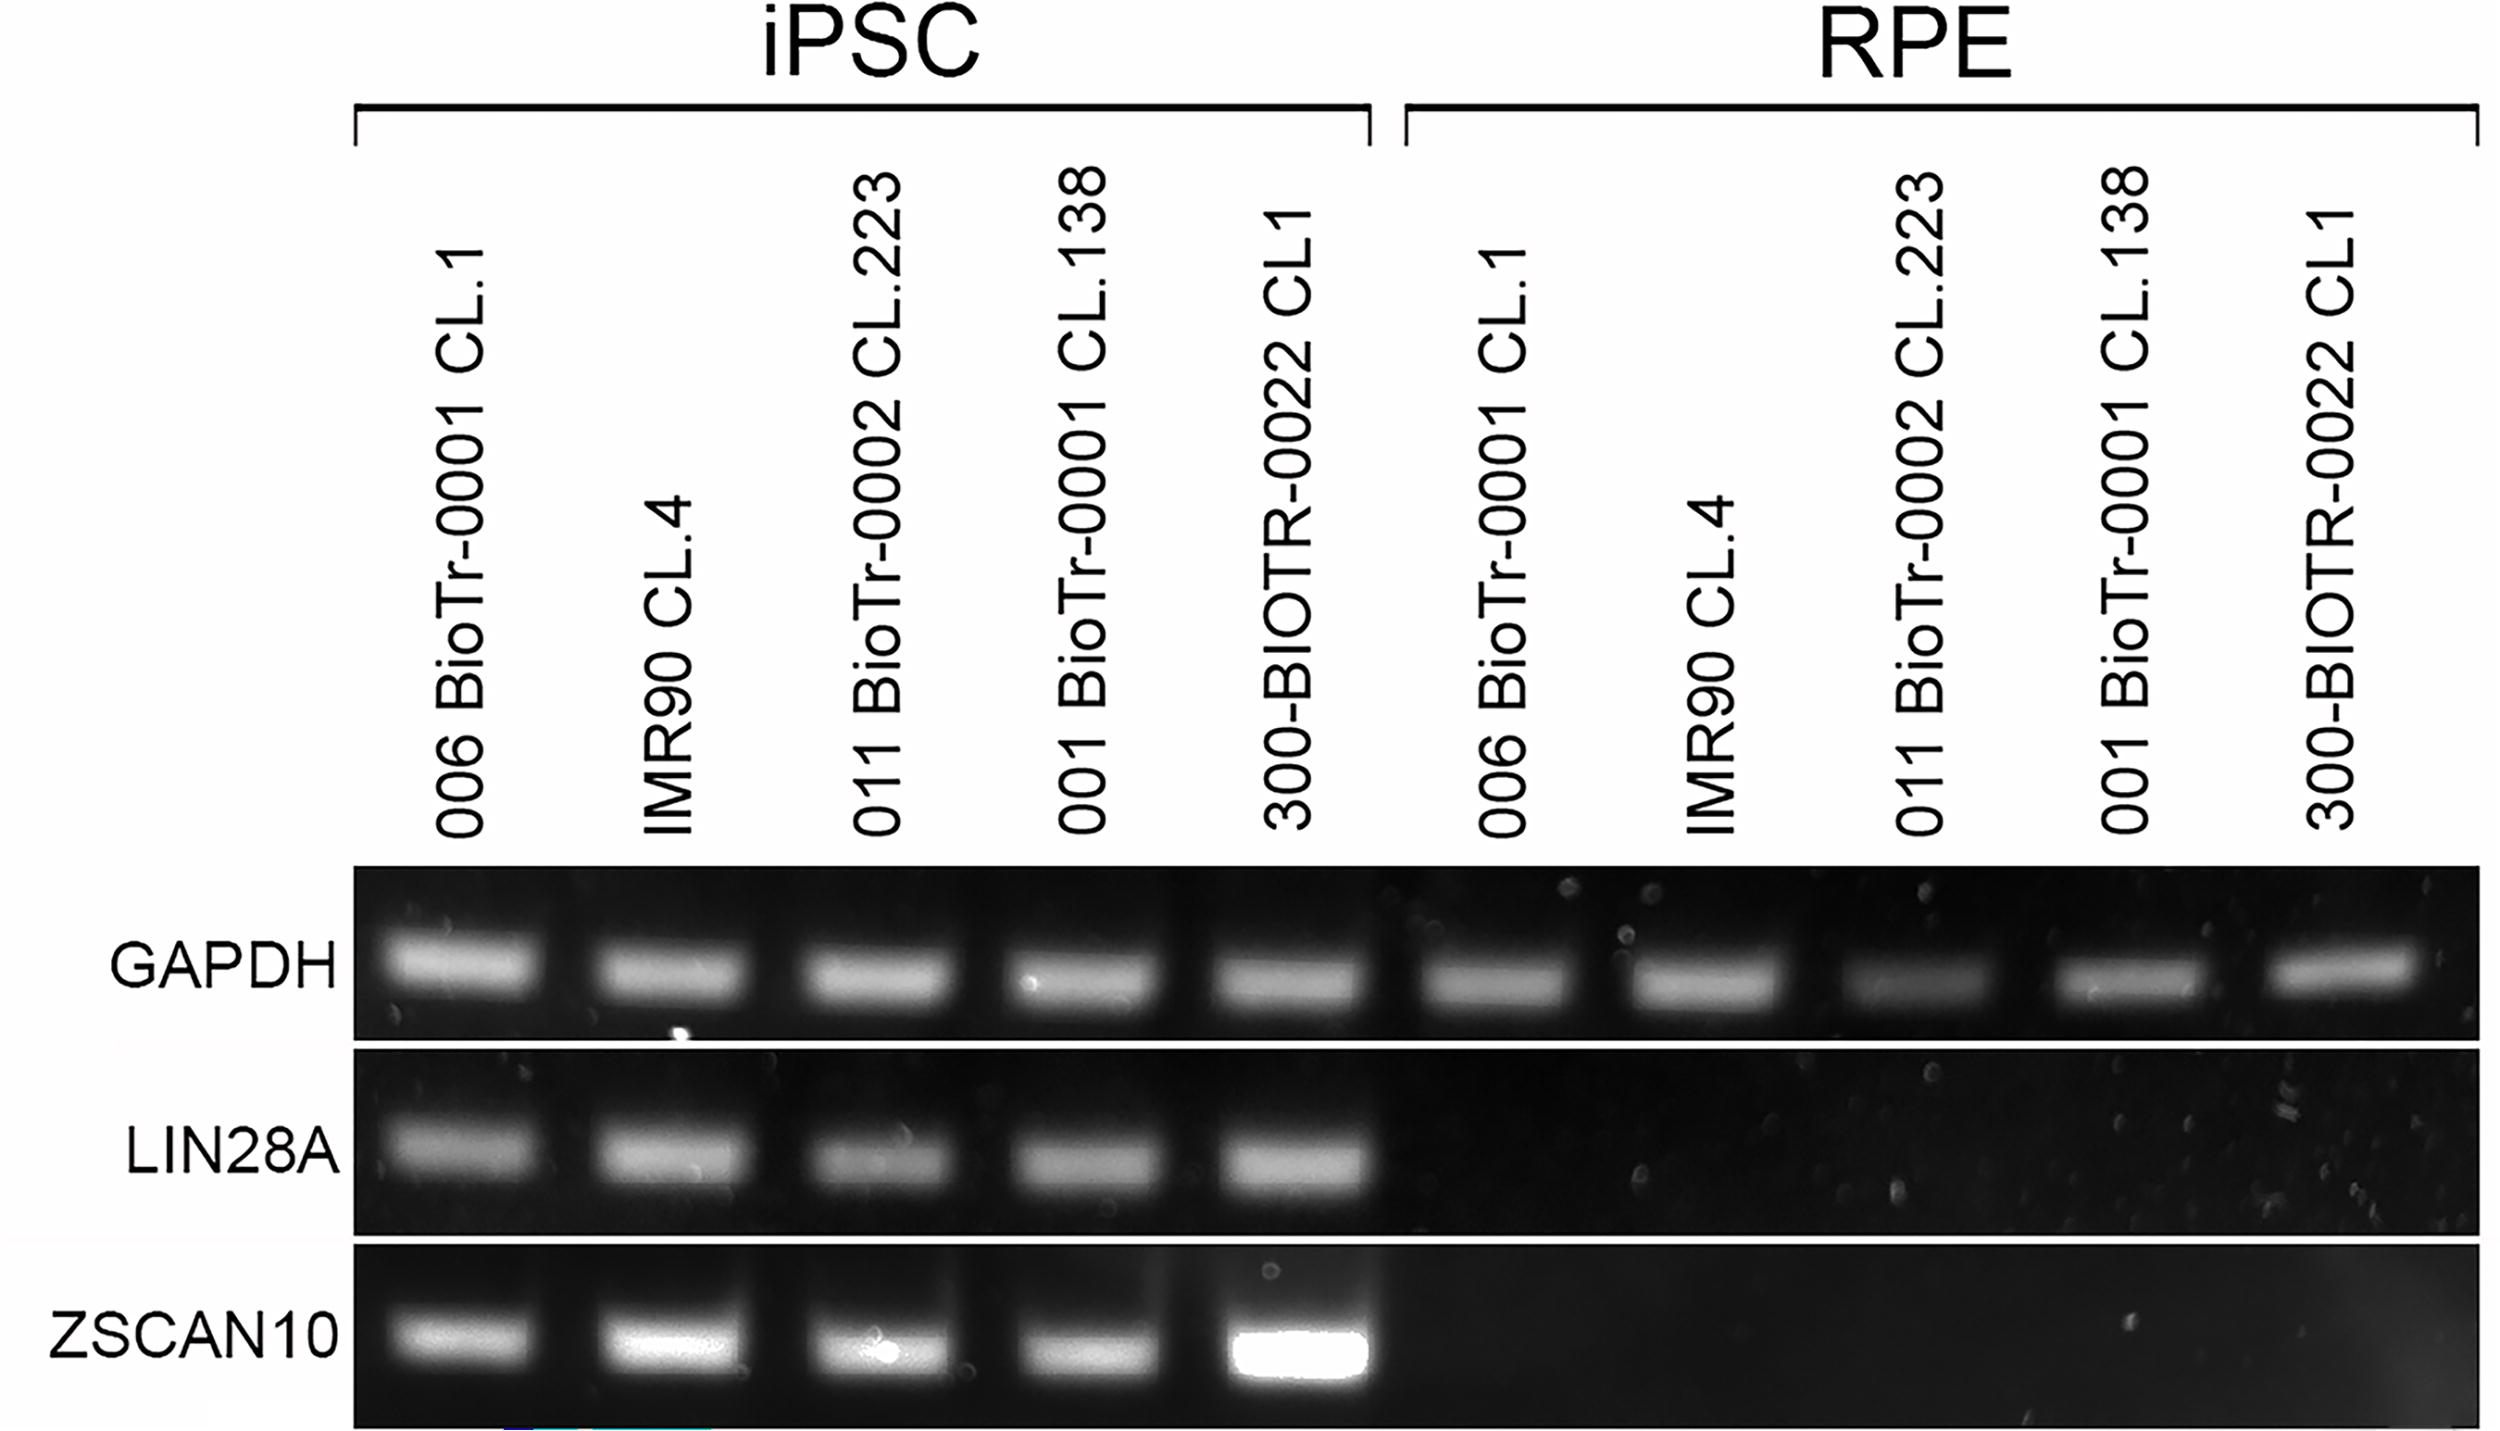
RT-PCR analysis of LIN28A and ZSCAN10 expression in iPSCs and RPE derived from them. Total RNA isolated from 5 iPSC lines and RPE derived from them were reverse transcribed and cDNA analyzed for expression of LIN28A or ZSCAN10. Note that all 5 iPSC lines expressed both LIN28A and ZSCAN10, but RPE did not despite expression of GAPDH control.
Limit of detection of residual iPSCs in a population of iPSC-derived RPE by qPCR
We established a qPCR assay using TaqMan™ primers to identify residual iPSCs in a population of iPSC-derived RPE. To determine the LOD for LIN28A and ZSCAN10, we performed “spike-in” assays by adding iPSC cDNA to RPE cDNA such that it constituted between 0.0001% and 1.0% of total cDNA. “Un-spiked” RPE and iPSC cDNA were also analyzed in the same experiment. As shown in Figure 4, following qPCR, Log ΔΔCt was determined and graphed. For both LIN28A and ZSCAN10, Log ΔΔCt progressively changed relative to iPSC cDNA between the 1.0% and 0.001% spike-in samples but did not change with further dilution. Statistical analysis indicated that the 0.01% spike-in differed from RPE cDNA for LIN28A (P < 0.002) and ZSCAN10 (P < 0.04). Log ΔΔCt was also statistically significant between the 0.01% and 0.001% spike-in samples with LIN28A (P = 0.003) and ZSCAN10 (P = 0.016) implying that the true limit of detection is somewhere between 0.01% and 0.001% iPSCs in the sample. This indicated that our combined LOD for both LIN28A and ZSCAN10 is <0.01% or <1 iPSC in 10,000 RPE cells. When repeated using RPE from a second iPSC line (006-BIOTR-0001, Clone 1) a similar LOD was observed (Fig. 4B).
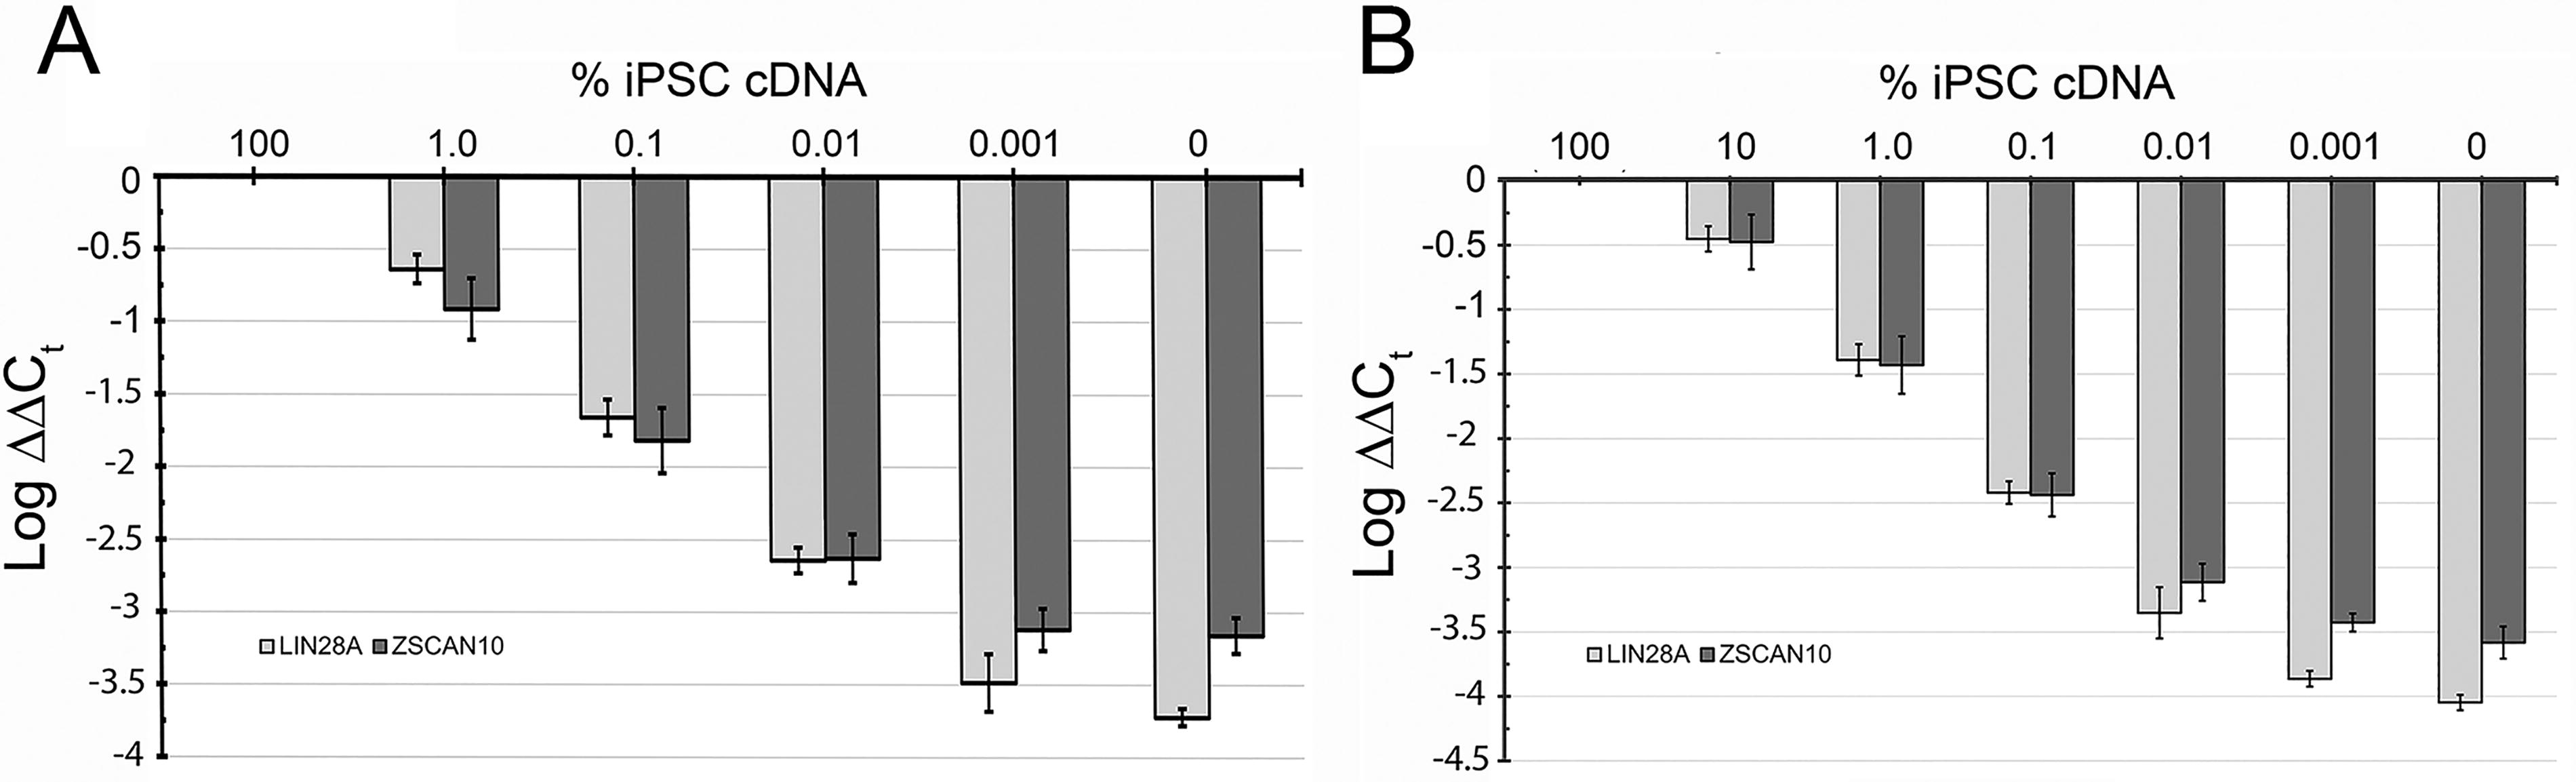
Limit of Detection (LOD) of LIN28A and ZSCAN10 in iPSC-derived RPE cultures assessed using qPCR. cDNA for iPSCs was mixed in the indicated percentages to iPSC-derived RPE cDNA isolated from either the 300-BIOTR-0022 Cl1
Discussion
Our laboratory has been developing an iPSC derived RPE product for treatment of macular degeneration. Adverse effects due to cell therapy could occur due to contaminating cell types, especially residual iPSCs which could form a teratoma. 9 Thus it is important to test for iPSC residuals in a cell therapy product prior to lot release. Kuroda et al., and Ito et al.,16,26 proposed to use LIN28A as a singular marker of residual iPSCs in iPSC-derived RPE and iPSC-derived cardiomyocytes used for cell therapy. Similar to our data, neither group found LIN28A in iPSC-derived cells. However, the FDA has indicated to us that LIN28A alone is not sufficient and that one or more additional markers of pluripotency should be added to our release testing. This study reports the identification of ZSCAN10 as a critical pluripotency marker that is effectively absent from differentiated RPE cells and on its use in combination with LIN28A to assay for iPSC residuals in an iPSC-derived RPE cell population.
Our approach involved using RNA Seq to identify known pluripotency markers that were significantly downregulated following differentiation to RPE and could be used in highly sensitive qPCR assays. Our choice of qPCR was driven by the findings of Kuroda et al.16,27 and Ito et al., 26 who found that TRA-1-60, an antibody recognizing an extracellular carbohydrate epitope, is the most sensitive antibody for detection of iPSCs in populations of iPSC derived RPE or cardiomyocytes using flow cytometry. The LOD reported in those studies was <0.1% or 1 in 1000 cells. Although in vitro tumorigenicity assays performed in both studies suggest that this could be sufficient, Yasuda et al., 28 reported that <100 iPSCs were sufficient to generate teratomas using in vivo tumorigenicity assays. Thus, our goal was to achieve a LOD of 0.01% or better, which Kuroda et al.16,27 and Ito et al. 26 achieved using qPCR for LIN28A and which we have reproduced herein.
Conclusion
Our RNA Seq experiments identified 8 pluripotency markers that were substantially downregulated in RPE cells versus iPSCs (Table 1) including LIN28A. Of the remaining pluripotency markers, ZSCAN10 best fit our criteria for further development. ZSCAN10 is expressed more than 10-fold higher than similar pluripotency markers TERT and ABCG2, and ZSCAN10 did not have a corresponding pseudogene or lncRNA that could confound qPCR detection. Furthermore, ZSCAN10, like LIN28A is expressed in all iPSC lines tested, but was not detected using RT-PCR in RPE derived from 5 of those lines (Fig. 2). Spike in assays confirmed that ZSCAN10 has a limit of detection similar to that of LIN28A of <0.01% or equivalent to 1 in 10,000 cells. Based on these data, we conclude that concurrent qPCR analysis of LIN28A and ZSCAN10 can serve as a lot release assay with the ability to detect <1 iPSC in 10,000 RPE cells and potentially other cell types such as cardiomyocytes.
Footnotes
Acknowledgments
The authors would like to acknowledge the assistance of Drs. Denis Wigle, Zachary Resch, and Jeffrey Winters in obtaining dermal biopsies from donors for iPSC lines 300-BIOTR-0020 and 300-BIOTR-0022. They would also like to acknowledge the invaluable assistance of Lindsey Kirkeby RN, the staff in the Mayo Clinic Transfusion Lab, and the Mayo Clinic BioTrust for their excellent technical assistance.
Authors’ Contributions
M.H.: Conceptualization (supporting), data curation (lead), formal analysis (lead), investigation (equal), methodology (lead), validation (equal), visualization (equal), writing—original draft (lead), writing—review and editing (supporting); C.A.-P.: Conceptualization (supporting), formal analysis (equal), methodology (equal), supervision (supporting), writing—review and editing (equal); E.A.: Formal analysis (equal), investigation (equal), methodology (lead), visualization (equal), writing—original draft (supporting); T.K.: Investigation (equal), methodology (lead), visualization (supporting); E.T.: Investigation (equal), visualization (supporting), writing—original draft (supporting); A.M.: Conceptualization (lead), supervision (lead), formal analysis (equal), funding acquisition (lead), investigation (equal), project administration (lead), visualization (lead), writing—original draft (equal), writing—review and editing (lead).
Author Disclosure Statement
Funding (Seeing Medicines Inc.); Competing interests (Seeing Medicines Inc.); ADM, EA, and TK have personal financial interests.
Funding Information
The study was funded by NIH U01 EY030547, A Discovery Translation Award from Mayo Clinic, and Seeing Medicines Inc.
References
Supplementary Material
Please find the following supplemental material available below.
For Open Access articles published under a Creative Commons License, all supplemental material carries the same license as the article it is associated with.
For non-Open Access articles published, all supplemental material carries a non-exclusive license, and permission requests for re-use of supplemental material or any part of supplemental material shall be sent directly to the copyright owner as specified in the copyright notice associated with the article.