
Abstract
Abstract
Understanding treatment preferences of seriously ill patients is complex. Previous studies have shown a correlation between the burden and outcome of a treatment and the likelihood a patient will accept a given intervention. In this study the Willingness to Accept Life Sustaining Treatment (WALT) survey was used in a predominantly Latino population receiving care at a large urban safety net hospital. Eligible patients were cared for by one of four clinics: (1) human immunodeficiency virus (HIV); (2) geriatrics; (3) oncology; or (4) cardiology. Hypothetical scenarios reflecting outcomes of resuscitation were presented and patients were given information on the burden and outcome of treatment. They were then given the option of accepting or declining treatment; 237 completed the survey. Patients in our study were willing to accept a high level of cognitive (vegetative state) and functional (bed-bound) impairment even when the chance of recovery was exceedingly low.
Introduction
In palliative medicine, the ultimate goal is to provide a cohesive plan that maximizes comfort and avoids suffering. Cassell 1 describes suffering as “a state of severe distress associated with events that threaten the intactness of the person.” Controlling pain, providing psychosocial support, and tending to spiritual care help attain a state of comfort for patients. Often palliative care experts consult on patients during a crisis such as admission to the intensive care unit. Clarifying goals of care are the focus in this setting, which are balanced with discussions of life-prolonging treatments. Ideally, the result is to provide care in alignment with the patient's goals. During the consent process, the risk, burden, and outcomes would seem to support this patient-centered model of care. However, it is unclear how much information a patient will use to make a decision impacting life or death. In the patient with a very limited prognosis, the preemptive decision to either accept or reject cardiac resuscitation may depend upon whether an acceptable level of outcome is achievable and if the burdens of the treatments (rib contusions/fractures and electric shocks) are balanced by the risks of an unacceptable level of survival. Alternatively, the same question could be applied to intubation or chemotherapy and many other life-sustaining interventions. In this study we sought to understand how information on risk, burden, and outcome would influence treatment decisions among patients cared for in a safety net hospital.
Methods
Patient recruitment
Los Angeles County + University of Southern California (LAC + USC) Medical Center Healthcare is a safety net hospital and serves the greater Los Angeles metropolitan area. The population receiving care at this hospital is indigent with most patients living below the poverty line. Over half of the patients seen at the hospital are Latino (64%) and speak Spanish as their primary language. A convenience sample was derived from outpatient ambulatory clinics serving patients with advanced chronic illness that would encompass a range of age and frequency of clinical interventions (medical oncology, cardiology, congestive heart failure [CHF], geriatrics, and acquired immune deficiency syndrome [AIDS] clinics).
Our target was to enroll 70 patients per clinic based on the clinic schedule and availability of the interviewers. Enrollment occurred in each clinic over 1 month during the summer. Written informed consent was obtained for all enrolled patients. Patients were excluded if they were unable to sit for the interview (i.e., being too ill or unwilling) or were unable to provide consent. After completing the survey, each participant was given a modest incentive ($5 gift card). This was not offered until after study completion. The University Institutional Review Board (IRB) affiliated with the Medical Center approved this study.
Data collection
The Willingness to Accept Life Sustaining Treatment (WALT) survey 2 (see Appendix A) has been validated in geriatric populations but has not been validated in non-English speaking populations. 3 The landmark study of treatment preferences conducted by Fried et al. 4 used this survey, accounting for burden and outcome. The authors of this important study operationally defined specific burden and outcome scenarios. These definitions were maintained in our study. Interviews were conducted in either English or Spanish, which required translation and back-translation of the WALT in Spanish. We were unable to validate this version of the survey due to resource limitations but worked with the translation service and tested this on bilingual staff, whom were instructed to stay as close to the original as possible. Using the WALT, we surveyed treatment preferences according to the burden imposed, potential outcomes, and the likelihood of the outcomes.
Burden is presented as either low or high. During the survey the interviewer would explain that low burden interventions would entail minor tests and treatment such as laboratory draws, oxygen masks, or even intravenous fluids. These tests would impose minimal risk and an acceptable level of discomfort. Whereas In contrast, higher burden interventions included long hospitalizations including the intensive care unit, surgical interventions, and ventilator use.
The next step in the WALT asks the participant to then think of the outcomes of a given intervention. Outcomes would include returning to current health, cognitive decline (unable to recognize or recall environment, and family), physical decline (being bedridden or unable to move), and death. Visually, the participants were shown colored pie charts correlating to the percentage of each outcome compared to death (Fig. 1).
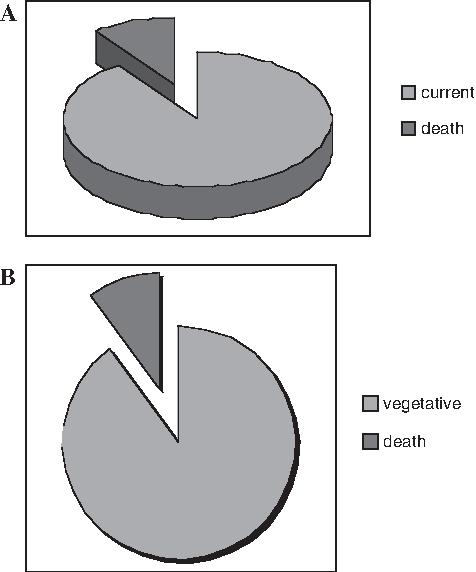
(
The first question of the survey presents the low burden scenario: “Think about if you were suddenly to get sick with an illness that would require you to be in the hospital for a
Statistical methods
χ2 Tests were performed using oncology patients as the comparison group given the high intensity and burden of treatment they experience. Gender was not recorded among patients from human immunodeficiency virus (HIV) or oncology clinics and therefore was not used in multivariate analysis. Patients were categorized as “high WALT” if they affirmed a willingness to accept a severe cognitive impairment with 100% certainty. So a high WALT score would therefore mean that the patient was willing to take substantial risk and discomfort despite almost no benefit from the proposed treatment.
Similarly, a low WALT was assigned to those participants declining treatment if the resulting outcome was a vegetative state. Multivariate logistic regression analysis controlled for age and disability was done to evaluate the likelihood of high-WALT status. All data analyses were performed with STATA 8.0 software (College Station, TX).
Results
We report on 237 subjects; 3 subjects were excluded secondary to missing information on the survey regarding diagnosis. The demographic comparisons between each of the clinics are listed in Table 1. The mean age of our subjects was 58 years old (range, 18–88 years). There were no significant differences in performance scores between groups and at least one functional disability was prevalent in 39%–51% of the patients. Approximately 77% of subjects were primarily Spanish speaking, with a small but significantly larger proportion of primary English speakers from the oncology clinic compared with the geriatric clinic. Subjects had spent a mean time in the United States of approximately 23 years prior to being surveyed (range, 0.25–75 years). The proportion of geriatric patients (35%) who resided in the United States less than 10 years significantly differed from those from the oncology clinic (13%). Treatment preferences according to the burden and outcome of treatment are shown in Figure 2. In general, patients accepted a high level of cognitive and functional impairment for low burden treatments. Oncology patients were significantly less likely to accept a low burden treatment without return to their current health state compared to every other clinic patient 79% versus 85% (HIV), 100% (geriatrics), 95% (cardiology), respectively, particularly with the chance of being bed-bound or in a vegetative state. The distributions for willingness to accept a higher burden of treatment were similar in all groups except for oncology patients. There were no significant differences among oncology clinic patients and HIV with a willingness to accept 6 months of painful daily treatments. However, cardiology clinic patients were significantly less likely to accept this scenario (willingness to accept 6 months of painful daily treatments) compared to oncology clinic patients. A similar question regarding an indefinite period of treatment demonstrated a significant difference in distributions with increasing burden scenarios, whereas oncology clinic patients were less likely to accept treatment (11% versus 42% HIV, 37% geriatrics, 30% cardiology, respectively). There was a significant difference in the distribution in subjects classified as “high WALT” with oncology clinic patients far less likely to be categorized at this level (21% versus 48%, 98%, and 95%, respectively). Patients from the geriatric clinic and cardiology clinic on average were more likely to affirm the highest degree of willingness to accept treatments in all the scenarios compared to oncology patients. The same pattern of response was seen among HIV clinic patients except for a lower willingness to accept cognitive impairment. Among oncology patients, the median response was to reject treatment as opposed to geriatric and cardiology patients, where the highest possible WALT score was the observed median response. HIV clinic patients were also significantly more likely to accept treatment despite cognitive impairment but their median response was under a 50% scenario. In the multivariate logistic regression model controlling for confounding variables (age and total disability), subjects surveyed at the HIV clinic were threefold more likely than oncology patients to accept a high burden of disease with poor outcome (vegetative state). Similarly, geriatric and cardiology clinic subjects were more likely to affirm this high burden (83-fold and 40-fold, respectively).

Treatment preferences according to the burden and outcome of treatment (n = 237).
Variable percentages may total 99%–101% secondary to rounded values.
p < 0.05 statistically significant when compared to cancer clinic patients.
Discussion
Data presented in this study were collected at a large safety net hospital that serves a largely Latino population that are primarily Spanish speaking and with low health literacy. Interestingly, patients in our study were willing to accept a high level of cognitive (vegetative state) and functional (bed-bound) impairment even when the chance of recovery was exceedingly low. However, those patients being treated for cancer were less likely to accept the most burdensome treatments with poor outcomes. These data are consistent with other studies evaluating gaps in end-of-life care in culturally diverse populations.2,5–12 Explanations for this discrepancy have been postulated to be related to a lack of awareness of hospice, language barriers, and the prohibitive cost of healthcare coupled with a lack of confidence in the system. While there is literature to suggest that Latinos have reservations about withholding or withdrawing life support, most studies have utilized small focus groups and recent studies have shown that education can overcome those reservations.
These findings are noteworthy for several reasons. Understanding treatment preferences is important for providers who constantly strive to reduce suffering in patients with end stage illness. Realistic estimates of outcomes and burden are important for patients when they make decisions about their treatment. However, previous studies demonstrate that many patients are not fully informed about different options of care and effectiveness of types of treatment.2,5,9,13–15 Previous investigators found that patients with lung cancer had false hopes of returning to health. 13 Patients only learned of their prognosis by functional decline and contact with fellow patients. Whether our population was simply less educated about treatment options is unclear. Given the WALT survey presents “hypothetical” scenarios, patients may have been more willing to accept a great deal of disability due to false hopes or misconceptions of the burden. However, we found that our oncology patients with were far less likely to want high burden interventions when the outcomes would result in significant impairment when compared to other nononcology diagnoses.
What accounts for the patient's willingness to accept treatment with grave consequences? There are several potential explanations. Health care access may be one potential explanation. It is known that there are low utilization rates of hospice by the Latino population.5–12 Latinos have been demonstrated to underutilize hospice care relative to their prevalence in the community. Evaluation of the Surveillance Epidemiology and End Results (SEER) database found that individuals dying from breast, colorectal, lung, or prostate cancer (n = 70,669) living in areas with a high percentage of African American and Latino residents tended to underutilize hospice care. 3 Disparate access to services, strong religious and familial support systems, and language barriers have been put forth as potential explanations for low utilization of hospice care among Latinos.2,14,15 Focus groups identified the main barriers to hospice utilization as lack of awareness of this option and inability to communicate in their primary language. Latino participants were amenable to comfort based care and hospice and prioritized dignity and modesty in death as most important. We did not measure if our study population had knowledge of the hospice model of care and if this would be an option they would consider in light of the strong preferences for resuscitation. Anecdotally, the palliative care consult service at LAC + USC Medical Center has found it not to be the case that majority of its patients have limited knowledge of the hospice model and that many patients hold out for resuscitative efforts until late in the course of illness. Spirituality is a key element in the Latino culture and central to decision making regarding health care. High levels of religiosity were found to have the most positive attitude toward life support.2,15 Over 80% of patients with cancer in our study who were high WALT identified themselves as Catholics (data not shown). From previous literature using Latino focus groups, spirituality was found to be important means of coping among Latino patients with advanced illness.2,16,17 Therefore, it is probable that Latino patients require involvement of pastoral care in reflection on difficult choices faced at the end of life.
Treatment decisions are often made with family participation. Latinos incorporate family in decision making about the use of life support. Ethnicity was the factor that attributed to these differences. 15 Additionally, physicians are often entrusted in this culture to make choices for patients. 18
Functional disability and the WALT score were not statistically associated in this study. Most of the patients surveyed were ambulatory and had good performance status. It is conceivable that the results may have changed if we had interviewed those with greater symptom burden. In our study, oncology patients were less likely to accept high burden treatment but we were unable to describe this effect based on previous intensity or length of treatment. Furthermore, when grouping patients by their type of cancer there was no association with their score. Presumably, certain cancers that are less responsive to treatment might have higher treatment burdens and therefore influence scores. This is different than other literature showing that patients with cancer would be willing to undergo major adverse effects even if the burden was high and outcome poor in anticipation of a small benefit. The authors of this study attribute this to lack of education about outcomes and alternatives.
Comfort level with physicians has also been found to be important for patients when discussing treatment preferences. Personal connection and trust are very much a part of the Latino culture and are required for open communication. In patients being treated for HIV/AIDS, nonwhite patients were more likely to have discussed treatment preferences if they had a nonwhite physician.19,20
Limitations
We acknowledge limitations of this study but believe it presents findings worthy of dissemination. This was a survey and we could not test a hypothesis of what causes patients to arrive at these decisions. Focus groups may be an important next step. Our study instead found that patients with a diagnosis of cancer are less willing to accept burdensome treatments then patients from other clinics. While we stratified patients by their functional disability to afford a comparison of disease severity, we did not measure psychosocial burden of disease, which may have more influence on patient treatment preferences. Additionally, prospective studies with repeated measures from the time of initial diagnosis would better elucidate the relationship with the experience of treatment burden and WALT scores.
Patient narratives as to why they made certain decisions were not collected. Collecting such qualitative information to investigate if responses might be grouped may provide insight into treatment preferences for end-of-life care. This may help validate the WALT survey for Spanish speakers in future studies.
During an interim analysis we discovered that gender was not initially collected. We made corrections to our data collection forms and investigated in the remaining subgroups whether gender influenced scores. There was no association between gender and WALT score in the remainder of our patient population (geriatrics and cardiac patients; data not shown). Furthermore, during the WALT survey, patients did not always have family present; therefore, responses to the WALT survey might have changed had a family member been present to receive medical information.
Last, while we did measure overall disability using performance status, we were unable to assess individual psychological fatigue from undergoing treatment and this may have provided important insight. Psychosocial factors aside from family have been found to be associated with the desire for treatment. Patients suffering from major depression requested more treatment and this would be an important area to explore. 21
Conclusions
Patients in our study were willing to accept a high level of cognitive (vegetative state) and functional (bed-bound) impairment even when the chance of recovery was exceedingly low. These results warrant further study including educational interventions to address the underlying values that guide decisions. However, it is clear that providers will need to make attempts to describe potential burdens and risks balanced against outcomes when posing interventions to their patients.
Footnotes
Author Disclosure Statement
No competing financial interests exist.
Appendix
| 1. Think about if you were suddenly to get sick with an illness that would require you to be in the hospital for a few days to a week. It would either be that your [CHF, COPD, cancer] worsened, or you got sick with a different illness. In the hospital you would need to have minor tests, such as x-rays and blood draws, and therapies such as intravenous antibiotics and oxygen. Without the treatment, you would not survive. If this treatment would get you back to your current state of health, would you want to have it? |
| Yes - 1 |
| Skip to Q. 8← No - 2 |
| REF - 7 |
| DK - 8 |
| 1a. Now, what if the doctor told you that there was a 50–50 chance that it would work and get you back to your current state of health. If it did not work, you would not survive. Without the treatment, then you would not survive for certain. Would you want the treatment? |
|
SHOW CHART A. |
| Yes - 1 |
| Skip to Q. 1d← No - 2 |
| REF - 7 |
| DK - 8 |
| NA - 9 |
| 1b. Now, what if the doctor told you there was a 10% chance that it would work and get you back to your current state of health and a 90% chance that it would not work. Without the treatment, then you would not survive for certain. Would you want the treatment? |
|
SHOW CHART B. |
| Yes - 1 |
| Skip to Q. 2← No - 2 |
| REF - 7 |
| DK - 8 |
| NA - 9 |
| 1c. Now what if the doctor told you there was a 1% chance that it would work and get you back to your current state of health and a 99% chance that it would not. Without the treatment, then you would not survive for certain. Would you want the treatment? |
|
SHOW CHART C. |
| Yes - 1 |
| No - 2 |
| REF - 7 |
| DK - 8 |
| NA - 9 |
|
|
| 1d. Now what if the doctor told you there were a 90% chance that it would work and get you back to your current state of health and a 10% chance that it would not. Without the treatment, then you would not survive for certain. Would you want the treatment? |
|
SHOW CHART D. |
| Skip to Q. 2← Yes - 1 |
| No - 2 |
| REF - 7 |
| DK - 8 |
| NA - 9 |
| 1e. What if the doctor told your there was a 99% chance that it would work and get you back to your current state of health and a 1% chance that it would not. Without the treatment, then you would not survive for certain. Would you want the treatment? |
|
SHOW CHART E. |
| Yes - 1 |
| No - 2 |
| REF - 7 |
| DK - 8 |
| NA - 9 |
| 2. Think again about being sick with an illness that would require you to be in the hospital for a few days to a week. In the hospital, you would need to have minor tests, such as x-rays and blood draws, and therapies such as intravenous antibiotics and oxygen. Without the treatment, you would not survive. What if the treatment would extend your life beyond the end of treatment for just one week in your current state of health? Would you want to have it? |
| Skip to Q. 3← Yes - 1 |
| No - 2 |
| REF - 7 |
| DK - 8 |
| NA - 9 |
| 2a. If it extended your life for 1 month, would you want to have it? |
| Skip to Q. 3← Yes - 1 |
| No - 2 |
| REF - 7 |
| DK - 8 |
| NA - 9 |
| 2b. If it extended your life for 6 months, would you want to have it? |
| Skip to Q. 3← Yes - 1 |
| No - 2 |
| REF - 7 |
| DK - 8 |
| NA - 9 |
| 2c. If it extended your life for 1 year, would you want to have it? |
| Yes - 1 |
| No - 2 |
| REF - 7 |
| DK - 8 |
| NA - 9 |
| 3. Now think about if you were suddenly to get sick with an illness that would require you to be in the hospital for at least a month. It could be either that your [CHF, COPD, cancer] worsened, or you got sick with a different illness. In the hospital, you would need to have many minor tests, such as x-rays and blood draws, and you would require more tests, such as CT scans. You would need major therapies, such as being in the intensive care unit, receiving surgery, or having a breathing machine. Without the treatment, you would not survive. If this treatment would get you back to your current state of health, would you want to have it? |
| Yes - 1 |
| Skip to Q. 5← No - 2 |
| REF - 7 |
| DK - 8 |
| NA - 9 |
| 3a. Now, what if the doctor told you that there was a 50–50 chance that it would work and get you back to your current state of health. If it did not work, you would not survive. Without the treatment, then you would not survive for certain. Would you want the treatment? |
|
SHOW CHART A. |
| Yes - 1 |
| Skip to Q. 3d← No - 2 |
| REF - 7 |
| DK - 8 |
| NA - 9 |
| 3b. Now what if the doctor told you there was a 10% chance that it would work and get you back to your current state of health and a 90% chance that it would not. Without the treatment, then you would not survive for certain. Would you want the treatment? |
|
SHOW CHART B. |
| Yes - 1 |
| Skip to Q. 4← No - 2 |
| REF - 7 |
| DK - 8 |
| NA - 9 |
| 3c. Now what if the doctor told you there was a 1% chance that it would work and get you back to your current state of health and a 99% chance that it would not. Without the treatment, then you would not survive for certain. Would you want the treatment? |
|
SHOW CHART C. |
| Yes - 1 |
| No - 2 |
| REF - 7 |
| DK - 8 |
| NA - 9 |
|
|
| 3d. Now what if the doctor told you there was a 90% chance that it would work and get you back to your current state of health and a 10% chance that it would not. Without the treatment, then you would not survive for certain. Would you want the treatment? |
|
SHOW CHART D. |
| Skip to Q. 4← Yes - 1 |
| No - 2 |
| REF - 7 |
| DK - 8 |
| NA - 9 |
| 3e. Now what if the doctor told you there was a 99% chance that it would work and get you back to your current state of health and a 1% chance that it would not. Without the treatment, then you would not survive for certain. Would you want the treatment? |
|
SHOW CHART E. |
| Yes - 1 |
| No - 2 |
| REF - 7 |
| DK - 8 |
| NA - 9 |
| 4. Think again about being sick with an illness that would require you to be in the hospital for at least a month. In the hospital you would need to have many minor tests, such as x-rays and blood draws, and you would require more tests, such as CT scans. You would need major therapies, such as being in the intensive care unit, receiving surgery, or having a breathing machine. Without the treatment, you would not survive. If this treatment would extend your life beyond the end of treatment for just one week in your current state of health, would you want to have it? |
| Skip to Q. 5← Yes - 1 |
| No - 2 |
| REF - 7 |
| DK - 8 |
| NA - 9 |
| 4a. If it extended your life for 1 month, would you want to have it? |
| Skip to Q. 5← Yes - 1 |
| No - 2 |
| REF - 7 |
| DK - 8 |
| NA - 9 |
| 4b. If it extended your life for 6 months, would your want to have it? |
| Skip to Q. 5← Yes - 1 |
| No - 2 |
| REF - 7 |
| DK - 8 |
| NA - 9 |
| 4c. If it extended your life for 1 year, would you want to have it? |
| Yes - 1 |
| No - 2 |
| REF - 7 |
| DK - 8 |
| NA - 9 |
| 5. Think about if you were suddenly to get sick with an illness that would require you to be in the hospital for a few days to a week. It would either be that your [CHF, COPD, cancer] worsened, or you got sick with a different illness. In the hospital you would need to have minor tests, such as x-rays and blood draws, and therapies such as intravenous antibiotics and oxygen. However, this time, imagine that at the end of the treatment, you would be in a state where you would be bedbound. You would not be able to get up out of bed to the bathroom by yourself, and you would need help with all of your daily activities. Without the treatment, you would not survive. Would you want the treatment? |
| Skip to Q. 6← Yes - 1 |
| No - 2 |
| REF - 7 |
| DK - 8 |
| NA - 9 |
| 5a. Now, what if the doctor told you that there was a 50–50 chance that it gets you back to your current state or would leave you bed-bound. Without the treatment, then you would not survive. Would you want the treatment? |
|
SHOW CHART F. |
| Skip to Q. 5d← Yes - 1 |
| No - 2 |
| REF - 7 |
| DK - 8 |
| NA - 9 |
| 5b. Now what if the doctor told you there was a 90% chance that it would get you back to your current state and a 10% chance that it would leave you bed-bound. Without the treatment, then you would not survive. Would you want the treatment? |
|
SHOW CHART G. |
| Skip to Q. 6← Yes - 1 |
| No - 2 |
| REF - 7 |
| DK - 8 |
| NA - 9 |
| 5c. Now what if the doctor told you there was a 99% chance that it will get you back to your current state and a 1% chance that it would leave you bed-bound. Without the treatment, then you would not survive. Would you want the treatment? |
|
SHOW CHART H. |
| Yes - 1 |
| No - 2 |
| REF - 7 |
| DK - 8 |
| NA - 9 |
|
|
| 5d. What if the doctor told you there was a 10% chance that it would get you back to your current state and a 90% chance that it would leave you bed-bound. Without the treatment, then you would not survive. Would you want the treatment? |
|
SHOW CHART I. |
| Yes - 1 |
| Skip to Q. 6← No - 2 |
| REF - 7 |
| DK - 8 |
| NA - 9 |
| 5e. What if the doctor told you there was a 1% chance that it would get you back to your current state and a 99% chance that it will leave you bed-bound. Without the treatment, then you would not survive. Would you want the treatment? |
|
SHOW CHART J. |
| Yes - 1 |
| No - 2 |
| REF - 7 |
| DK - 8 |
| NA - 9 |
| 6. Think about if you were suddenly to get sick with an illness that would require you to be in the hospital for a few days to a week. It would either be that your [CHF, COPD, cancer] worsened, or you got sick with a different illness. In the hospital you would need to have minor tests, such as x-rays and blood draws, and therapies such as intravenous antibiotics and oxygen. Now imagine that the treatment would leave you in a state where your mind would not be working, such that you would not be aware of what was going on around you or be able to recognize your loved ones. Without the treatment, you would not survive. Would you want the treatment? |
| Skip to Q. 7← Yes - 1 |
| No - 2 |
| REF - 7 |
| DK - 8 |
| NA - 9 |
| 6a. Now, what if the doctor told you that there was a 50–50 chance that it will get you back to your current state or leave you unaware. Without the treatment, you would not survive. Would you want the treatment? |
|
SHOW CHART K. |
| Skip to Q. 6d← Yes - 1 |
| No - 2 |
| REF - 7 |
| DK - 8 |
| NA - 9 |
| 6b. Now what if the doctor told you there was a 90% chance that it would get you back to your current state and a 10% chance that it will leave you unaware. Without the treatment, you would not survive. Would you want the treatment? |
|
SHOW CHART L. |
| Skip to Q. 7← Yes - 1 |
| No - 2 |
| REF - 7 |
| DK - 8 |
| NA - 9 |
| 6c. Now what if the doctor told you there was a 99% chance that it will get you back to your current state and a 1% chance that it will leave you unaware. Without the treatment, you would not survive. Would you want the treatment? |
|
SHOW CHART M. |
| Yes - 1 |
| No - 2 |
| REF - 7 |
| DK - 8 |
| NA - 9 |
|
|
| 6d. Now what if the doctor told you there was a 10% chance that it will get you back to your current state and a 90% chance that it will leave you unaware. Without the treatment, you would not survive. Would you want the treatment? |
|
SHOW CHART N. |
| Yes - 1 |
| Skip to Q. 7← No - 2 |
| REF - 7 |
| DK - 8 |
| NA - 9 |
| 6e. What if the doctor told you there was a 1% chance that it will get you back to your current state and a 99% chance that it will leave you unaware. Without the treatment, you would not survive. Would you want the treatment? |
|
SHOW CHART O. |
| Yes - 1 |
| No - 2 |
| REF - 7 |
| DK - 8 |
| NA - 9 |
| 7. Now imagine that you required a treatment that could not be finished in 1 week or 1 month, but would have to keep going indefinitely. Think of, for example, being on a respirator (breathing machine), where you would have to stay on it in order to breathe. Your mind would be working fine, but you would only be able to go from the bed to the chair. Without the treatment, you would not survive. Would you want the treatment? |
| Yes - 1 |
| Skip to Q. 8← No - 2 |
| REF - 7 |
| DK - 8 |
| NA - 9 |
| 7a. What about if you were not aware of what was going on around you? Would you want the treatment? |
| Yes - 1 |
| No - 2 |
| REF - 7 |
| DK - 8 |
| NA - 9 |
| 8. FOR CANCER PATIENTS ONLY, FOR OTHERS GO TO SURROGATE DECISION-MAKING SECTION (PAGE 41) |
| Imagine that there was a treatment for your cancer that would go on for 6 months. It would result in uncomfortable symptoms on a daily basis. These would be nausea, fatigue, loss of appetite, or any others you can think of. The symptoms would end when the treatment ended and you would be back to your current state of health. It would extend your life for 1 year beyond the end of the treatment. Without the treatment, you would not live the 6 months. Would you want the treatment? |
| Yes - 1 |
| Skip to Next Section← No - 2 |
| REF - 7 |
| DK - 8 |
| NA - 9 |
| 8a. If it extended your life for 6 months beyond the end of the treatment, would you want to have it? |
| Yes - 1 |
| Skip to Q. 9← No - 2 |
| REF - 7 |
| DK - 8 |
| NA - 9 |
| 8b. If it extended your life for 1 month beyond the end of the treatment, would you want to have it? |
| Yes - 1 |
| No - 2 |
| REF - 7 |
| DK - 8 |
| NA - 9 |
| 9. FOR CANCER PATIENTS ONLY |
| Now imagine a treatment that would go on for 6 months. It would result in uncomfortable symptoms on a daily basis. These could be nausea, fatigue, loss of appetite, or any others you can think of. At the end of the treatment you would continue to have fatigue and potentially other symptoms that would cause you to be able to do fewer activities than you can do now. It would extend your life for 1 year beyond the end of the treatment. Without the treatment, you would not live the 6 months. Would you want the treatment? |
| Yes - 1 |
| Skip to Next Section← No - 2 |
| REF - 7 |
| DK - 8 |
| NA - 9 |
| 9a. If it extended your life for 6 months beyond the end of the treatment, would you want to have it? |
| Yes - 1 |
| Skip to Next Section← No - 2 |
| REF - 7 |
| DK - 8 |
| NA - 9 |
| 9b. If it extended your life for 1 month beyond the end of the treatment, would you want to have it? |
| Yes - 1 |
| No - 2 |
| REF - 7 |
| DK - 8 |
| NA - 9 |
CHF, congestive heart failure; COPD, chronic obstructive pulmonary disease; CT, computed tomography.