
Abstract
Abstract
Background:
Previous studies have reported survival estimates in palliative populations using the Palliative Performance Scale (PPS) (where 100=best status, 0=death). However, little research has examined the association of the PPS with hazard of death in ambulatory populations.
Objective:
We examined the association between performance status and the instantaneous hazard of death in ambulatory cancer patients, using longitudinal PPS scores.
Methods:
This retrospective, population-based cohort study included cancer outpatients who had at least one PPS assessment completed between 2007 and 2009. PPS scores were recorded opportunistically by health care providers at clinic or home care visits. We used a Cox proportional hazards model to determine the relative hazard of death based on repeated measures of PPS score, while controlling for other covariates.
Results:
Among 11,342 qualifying cancer patients, there were 54,207 PPS assessments. The distribution of PPS scores at first assessment were 23%, 56%, 20%, and 1% for PPS scores of 100, 90–70, 60–40, and ≤30, respectively. A quarter of the cohort died within 6 months of the first assessment. The relative hazard of death increases by a factor of 1.69 (95% confidence interval [CI]: 1.72-1.67) for each 10-point decrease in PPS score. Thus the hazard of death increases by 8.2 (1.694) times for a person with PPS score of 30 compared with a person with a score of 70.
Conclusion:
The PPS was significantly associated with hazard of death in ambulatory cancer patients; the relative hazard of death increased based on lowered PPS scores. Providers should consider broadening its use to include patients throughout their disease trajectory.
Introduction
What has not been researched is whether the PPS is associated with hazard of death in a cross-sectional, heterogeneous, cancer population instead of a clearly identified palliative population. Moreover, few tools account for changes in a patient's performance status over time. Thus patients and families, as they move across various stages of the cancer trajectory, want to know how their chances of survival have changed. More accurate estimates can allow patients and families the time to find closure on personal and spiritual matters. In addition, tools that can provide critical prognostic information to clinicians about ambulatory patients' hazard of death can help to facilitate earlier identification of patients in need of palliative care services. Survival estimates also can inform decisions around which treatment options to pursue. To date, tools that estimate the hazard of death in cross-sectional, ambulatory, cancer populations have not been well-researched.
As part of an initiative called the Ontario Cancer Symptom Management Collaborative (OCSMC), since January 1, 2007 all cancer centers across the province of Ontario, Canada, standardized the assessment of performance status in cancer outpatients by using the PPS. 15 Using the longitudinal PPS data collected from this initiative, this study examines the association between PPS and hazard of death in a cohort of ambulatory cancer patients.
Methods
Study population
This retrospective population-based cohort study describes the association between longitudinal performance status using the PPS and hazard of death among ambulatory cancer patients. Patients eligible for assessment included those living in all regions of the province, with any cancer diagnoses, of any age, from ambulatory and/or home settings, and receiving any treatment intent. The cohort included patients who were diagnosed with cancer between January 1, 2007 and March 31, 2009 and had at least one PPS assessment after diagnosis. Diagnosis date was retrieved from the Ontario Cancer Registry, a comprehensive population-based cancer registry created to capture all incident cases of cancer in the province.16,17 Patients were followed until their date of death or until time of analysis, at which time they were considered censored. Patients were excluded if they had an invalid or missing provincial health insurance number (which precludes linkage), or if they could not be linked to the Ontario Cancer Registry.
PPS was assessed by a physician or nurse during a visit to the cancer center or by a home care nurse during a patient's home visit. As a result, a patient may have had several PPS scores recorded over their duration of follow-up. PPS assessments happened on an opportunistic basis, depending on how each cancer center or home care program implemented the OCSMC initiative. The aim of the OCSMC initiative was to screen patients at every cancer clinic visit or home visit; however, in reality patients were not systematically screened at regular intervals. Initially, the OCSMC targeted all lung cancer patients and patients registered for palliative care of any cancer type. Most cancer centers began with these targets in the initial months, and they later expanded to include all cancer types as they were able. A few cancer centers began screening all cancer types from the beginning; almost all cancer types were being screened by the end of the first year of implementation. As a result, both the assessment times and the number of assessments vary considerably among cohort patients. In 2009, about 55% of the lung cancer population and 30% of the remaining cancer patients in Ontario were screened. 18
Covariate definitions
The independent and time-varying variable of interest is performance status, determined using the PPS. For each patient, every PPS score and the date at which the score was taken was retrieved. Other covariates were based on common baseline measures available in the data and were defined by methods used in similar, previous research.19–21 Specifically, date of death, age, sex, and neighborhood income quintile (based on postal code linkage) 22 were taken from the Registered Persons Database, a validated source for sociodemographic and date of death data. 23 Type of cancer diagnosis was retrieved from the Ontario Cancer Registry; cancer types were categorized by the four largest groups, with the remaining cancer types categorized as “other.” For patients with multiple primaries we selected the first diagnosis date that preceded the first assessment date. Comorbidity was calculated using the Deyo modification of the Charlson score, based on diagnoses coded in Canada's Discharge Abstract Database in the 12 months prior to first assessment, with scores for primary and metastatic cancer subtracted. 24
Statistical analysis
The individual is the unit of analysis. Following the descriptive analyses, Kaplan-Meier survival analysis was used to model time to death on PPS scores at baseline and, subsequently, Cox proportional hazards modeling was utilized to adjust for repeated measures of PPS and then also to control for other covariates. 25 Note Cox proportional models are not useful in predicting survival time to death with time-varying covariates, but they are useful in determining associations with hazard of death. Moreover, because PPS is a time-varying covariate, standard Kaplan-Meier methods and log-log plots could not be used to assess the proportional hazard assumption for our extended Cox model. Instead, this assumption was assessed by methods that incorporate a time-dependent regression coefficient into the model via a time-interaction term. 26 In other words, the interaction between PPS score (our main exposure variable) and survival time was included in the model to examine if the proportional hazards assumption was appropriate. Specifically, we tested if the regression parameter for this interaction term was significantly different from zero. Although the p value was lower than 0.05, the parameter estimate was only 0.08 (standard error was 0.0023). Because this is a province-based analysis, small standard errors and low p values are common. However, in practice, due to the point estimate being so close to zero, we did not believe that presentation of an interaction model was warranted. This implies that that the regression coefficient is not a function of time and the proportional hazard assumption for the PPS variable is reasonable.
Model covariates included age, sex, Charlson score (binary: no [0] or any comorbidities [1] beyond cancer), income quintile, and cancer type. As well, the PPS score was tested for appropriateness as a continuous time-dependent covariate in our regression models. 27 The PPS score was updated in the model at each assessment time for every patient. By treating PPS as continuous, we avoid the need to select an arbitrary reference category in the regression model. That is, the hazard of death ratio for PPS score provides the adjusted relative hazard of death for every 10-point increase in PPS score.
Results
We identified 11,342 cancer patients who had at least one PPS assessment during our study period, for a cumulative total of 54,207 PPS assessments. Mean age at diagnosis was 64 years, and 55% of patients were female (Table 1). At first assessment, 83% of patients had PPS completed in the clinic versus the home, and 20% had a Charlson score of ≥1. Distribution of PPS scores at first assessment were 23%, 56%, 20%, and 1% for PPS scores of 100, 90–70, 60–40, and ≤30, respectively. The most common cancer was lung (27%), followed by gastrointestinal (25%), and breast (18%); these cancer types had corresponding mean PPS scores of 69, 73, and 86, respectively, considering all assessments (Table 2). Overall, mean number of PPS assessments per patient was 4.8, with a median of 2 (lower quartile [Q1]=1; upper quartile [Q3]=5). Thirty-eight percent of the cohort had one PPS assessment, whereas 18% had >6 assessments. The median time from diagnosis to first PPS assessment was 102 days (Q1=49 days; Q3=222 days), with 29% having a PPS assessment within 8 weeks of diagnosis. Thirty-five percent (n=4004) of the cohort died during the study period, and 25% (n=2914) died within 6 months of their first PPS assessment.
Twenty-nine values missing.
PPS, Palliative Performance Scale.
PPS, Palliative Performance Scale.
Figure 1 displays the crude survival analysis of our cohort using the baseline PPS, by PPS scores. Of those with initial PPS scores of ≤30, only 25% were alive after 52 weeks compared with 85% survival for those with initial PPS scores of 90. Table 3 provides the estimated ratio of hazard of death as PPS score declines (i.e., performance status worsens). The hazard of death ratio increased by 4.5% for each 10-point drop in PPS, when only baseline PPS was considered (model A). Similarly, the hazard of death ratio increased by 5.6% for each 10-point drop when all PPS assessments were accounted for and PPS was a time-varying, repeating variable (model B). However, when other baseline covariates were included and PPS was a time-varying covariate (model C), the relative hazard of death increased by 1.692 times (95% confidence interval [CI]: 1.666-1.718) for each 10-point decease in PPS score, controlling for the other covariates. Thus in model C, the hazard of death ratio increases exponentially as PPS score decreases. For example, the relative hazard of death increases by 8.2 (1.6924) times for a person with a PPS score of 30 compared with a person with a PPS score of 70, which is the same relative hazard comparing PPS scores of 40 with 80. The most extreme comparison shows that the relative hazard of death is 114 times higher for a person with a PPS score of 10 compared with a person with PPS score of 100. Conversely, one can use the inverse (1/1.692=0.591) if comparing high to low PPS scores (i.e., improvement in performance status). For example, a person with a PPS score of 70 has a 40.9% (1–0.5911) decrease in the hazard of death compared with a person with a score of 60, controlling for other covariates.
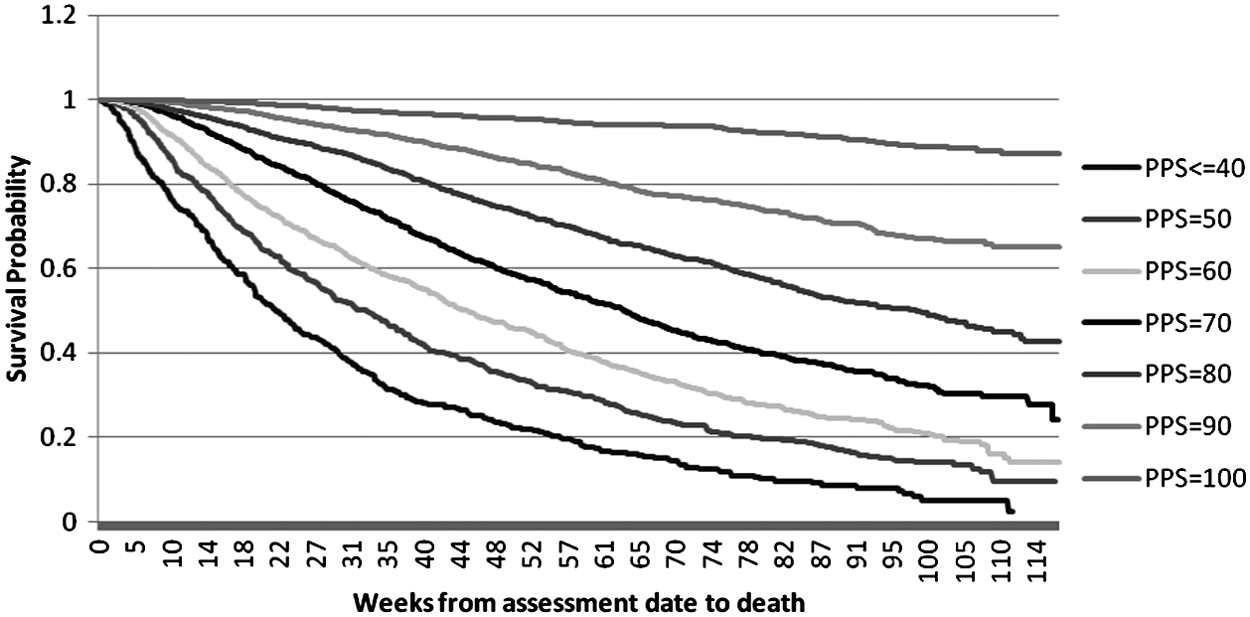
Kaplan-Meier survival curve by Initial PPS score.
PPS score is treated as 1 to 10.
Twenty-nine values missing for income quintile. These are not included in the analysis.
Cancer type categorized into five values.
CI, confidence interval; GI, gastrointestinal; GU, genitourinary; PPS, Palliative Performance Scale.
Bold hazard ratios imply statistically significant point estimates.
Table 3 also shows how other covariates of age, sex, income quintile, Charlson score, and cancer type affect the hazard of death. The hazard of death was lower in females than males (0.779 hazard ratio; 95% CI: 0.730-0.832). The estimated hazard of death increased by 1.004 times (95% CI: 1.002-1.007) if a patient was one year older (or 1.041 times if a patient was 10 years older). Overall, Charlson score and income quintile were not significant covariates in our model. Compared with lung cancer, all other cancer types had a lower hazard of death, with breast cancer having the lowest hazard (0.171; 95% CI: 0.141-0.207).
Discussion
To our knowledge, this is the first study to examine the association between hazard of death and PPS scores in an ambulatory cohort of all cancer types. We examined a population-based sample of longitudinal PPS scores throughout the continuum of cancer care; thus our sample size is large and number of assessments is unparalleled. Results show that the PPS tool is independently associated with the relative hazard of death in an outpatient cancer population: each 10-point decrease in PPS score (i.e., performance status decline) was associated with an increased relative hazard of death of 1.692, after controlling for age, sex, comorbidity, income, and cancer type. The relative hazard of death exponentially increases as PPS score declines.
The implications of these results might help to improve patient care. Our data demonstrate that PPS scores are useful in determining hazard of death when used in combination with other clinical factors, among a broad population of ambulatory cancer patients, beyond the hospice settings where it was originally designed. These results support the broader use of the PPS in community, hospital, and/or outpatient clinics. The relative hazard can be compared against the patient's own PPS score from a prior visit or relative to another PPS score. The standardized PPS scores are most informative to physicians treating patients across the trajectory of cancer care when interpreted in combination with other clinical factors. The change in PPS scores over time can indicate the rate of tumor progression and relative hazard of death if other clinical reasons for the change are excluded. Ultimately, providing more accurate information about patients' hazard of death can help them and their families better plan and prepare for what is expected in the future and inform their decision making around treatment and care plans. Having a standardized tool that helps indicate changes to relative hazard of death might trigger conversations about additional support, such as home care nursing and advance care planning. Moreover, it might allow providers to initiate discussions about palliative care and hospice referrals earlier in the trajectory of care.21,28 Early referral to hospice palliative care services has been associated with avoiding hospitalization and emergency department use at the end of life, and hospital deaths in cancer patients. 29
These results are novel in several ways. First, past studies on PPS have used only one-time, baseline measurement of PPS to predict death mostly by Kaplan-Meier plots;3–14 in contrast, this study uses repeated measurements of PPS over time via a Cox proportional hazards model. The latter approach accounts for multiple assessments and PPS score changes over time at the individual level. Second, Kaplan-Meier survival analysis cannot account for other covariates, whereas this analysis controls for other variables known to be associated with death. Third, past studies mostly focused on hospice populations, many with small sample sizes, whereas this study analyzes the PPS’ utility to predict death in ambulatory cancer patients using a large, population-based sample.
Our findings are consistent with past studies, despite the noted differences in the populations studied. Like past studies focusing only on palliative cancer patients, our study found that PPS was significantly associated with hazard of death, with higher hazard of death ratios associated with lower PPS scores. This finding was consistent in the survival analysis and the regression models, although the patients in our study lived longer because we examined a healthier, ambulatory cancer cohort, exemplified by much higher PPS values at baseline. As in past research, females had a lower hazard of death compared with men, controlling for other covariates. Increasing age was associated with a higher hazard of death.
Several study factors affect the interpretation of our results, potentially biasing them toward more pessimistic relative hazard ratios. Due to the OCSMC's initial target cancer types during roll-out, our sample likely has more lung cancer and palliative patients represented than a general cross-section of ambulatory patients. For comparison, a 2008 Canadian Cancer Statistics report shows that lung cancer comprised 13% of incident cancers and 25% of cancer deaths in Ontario, whereas our study cohort includes 27% lung cancer patients. 30 However, our model does control for lung cancer and other major cancer types as covariates. As well, because the PPS assessments occurred on an opportunistic basis, it is possible that providers were more inclined to complete the PPS for sicker patients. Unfortunately, the databases used in this study did not include cancer stage or treatment information to verify this. Other confounding variables associated with hazard of death, such as family history of cancer, lifestyle choices, and so forth, were not available for analysis. Also excluded from our cohort are those who died before completing a PPS assessment either because they were too sick to attend the ambulatory cancer clinic or because they chose not to complete any patient-reported outcomes. Unfortunately, the impact of those patients never screened with PPS is unknown. Despite these limitations, our sample size is large, province-wide, and inclusive of all cancer types, across the cancer trajectory. The PPS’ utility in estimating hazard of death requires further study in a controlled sample, although these results indicate it has clinical value, particularly when considered with other clinical factors.
Conclusion
The PPS has previously been used solely in predicting time to death in an already identified palliative population. This is the first study to demonstrate the association between PPS scores and hazard of death in an ambulatory cohort of cancer patients. The findings suggest that the PPS can be used in ambulatory cancer patients, in order to improve the estimates of hazard of death for these patients, and to accurately identify patients for timely referral to palliative care services.
Footnotes
Acknowledgments
This study was funded by the Ontario Institute for Cancer Research and supported by the Institute for Clinical Evaluative Sciences (ICES), which receive funding by the Ontario Ministry of Health and Long-Term Care (MOHLTC). The opinions, results, and conclusions reported in this paper are those of the authors and are independent from the funding sources.
Author Disclosure Statement
No competing financial interests exist.