
Abstract
Abstract
Background:
The experiences of people with pain under palliative care is not well documented longitudinally. This work aims to describe the prevalence, intensity, progression, and associations of self-reported pain scores of people under a community palliative care service, by retrospectively examining how routinely collected pain scores changed over time.
Methods:
Pain was subcategorized depending on intensity, allowing group differences to be explored using analysis of variance. Bivariate analysis was used to explore the relationship between pain scores and other symptoms using Spearman's Rho correlation.
Results:
Over two years, 3027 patients were seen, with data collected an average of 17.3 times (52,387 data points). At referral, 50% (n=1402) were pain free. Of those with pain, mean score was 2 (range 0–10). The majority had cancer (90%), with no significant difference between the severity of reported pain scores between cancer and nonmalignant diagnoses (P=0.27). A significant gender difference was noted, with females statistically more likely to report severe pain (χ2 (3026)=5.61, p=0.018). Similarly, those <60 years were more likely to report pain χ2(3025)=3.07; p=0.022). Longitudinal changes in pain revealed the pain scores of people admitted with pain <7 always reported lower pain scores than those with severe pain on admission (90 days, F(1, 654)=55.72, p<0.001; 60 days, F(1, 1008)=48.62, p<0.001; 30 days, F(1, 1522)=60.36, p<0.001; 7 days, F(1, 1897)=15.4, p<0.001). However, pain scores of those with pain <7 on admission rose as death approached compared with those who reported severe pain.
Conclusion:
Even in the context of expert delivery of palliative care where pain is most likely to be optimally managed, pain continues to be a problem. Work such as this suggests that the different mechanisms that contribute to pain may influence patients' experiences even when analgesia is optimized in a specialist setting. Particular attention is needed in the future to explore the relationship between severe pain and mobility.
Introduction
However, clinical experience strongly suggests there are subgroups of people for whom pain is severe, persistent, and difficult to control even in the specialist palliative care settings. The problem with considering just the average scores of a cohort is that the average scores may be only partially informative, potentially failing to reflect the range of scores that includes “worst pain levels.” A simple approach to overcome this and offer vastly more detail would be to subclassify people's self-reported longitudinal pain scores into none, mild, moderate, and severe ranges, therefore allowing more detailed understanding of how pain is experienced over time. Not only would such detail be useful at an individual patient level, but also at service delivery level.
For patients, this detail is important to ensure pain is addressed appropriately, with best practice guidelines recommending that clinicians question patients about their pain using validated tools on a regular basis.2,3 Previous work has suggested that the intensity of the initial pain experience when people first present has been identified as a predictive factor for ongoing poor pain control at a two-week review. 4
At a service level, the number of people likely to experience pain allows health professionals to understand better the numbers of people who will require assessment and management of difficult pain problems.
The aim of this work is to understand the prevalence, intensity, progression, and associations of prospectively collected self-reported pain scores across a community palliative care population, which included people with cancer and noncancer diagnoses. Particular attention was paid to the subgroup of people referred to palliative care services with severe pain as defined by a numeric rating score (NRS) of 7 or more out of 10 (≥7/10).
Methods
Study setting
Silver Chain Hospice Care Service (SCHCS) is the sole regional community palliative care program that provides multidisciplinary specialist palliative care for all the metropolitan area of Perth, Western Australia. The multidisciplinary team includes general practitioners, registered nurses, palliative medicine consultants, care aides, social workers, volunteers, counsellors, and pastoral care workers. Nursing services are available 24 hours/day, 7 days/week. Such services are supported by general practitioners and clinical nurse consultants. The service receives approximately 2000 referrals annually for palliative care and is free of charge to patients with life-limiting illnesses, with costs met by state health care funds.
Study population
This study was based on routinely collected data obtained from 3027 consecutive referrals to a community-based palliative care service between November 1, 2009 and November 30, 2011.
Data collection from Silver Chain Hospice Care Services records
Routine clinical practice in this palliative care service is that at each nursing contact with a person, self-reported symptom scores are electronically recorded, including pain, bowel problems, insomnia, nausea, breathing problems, appetite problems, and fatigue, using the validated Symptom Assessment Scale (SAS). 5 The SAS is an NRS reporting the degree to which the people find the symptoms bothersome, where 0=no problems experienced and 10=the worst imaginable problems experienced. The SAS does not provide an in-depth assessment of individual symptoms, but serves as a screening tool for symptoms that warrant more intensive assessment.
For this study these scores were analysed at four discrete time points, namely 90, 60, 30, and 7 days before death, allowing changes in pain scores over three distinct time periods to be considered, with particular attention paid to the group who described pain scores of 7 or greater at the time of referral to the service.
At each visit the other symptom scores were collected together with measures of people's performance status and actual ability to undertake activities of self-care.
Performance status was measured by the clinician-reported Australian-modified Karnofsky Performance Scale (AKPS); 6 and people's actual capacity to undertake activities of self-care was measured by the Resource Utilisation Groups, Activities of Daily Life (RUG-ADL) 7 (see Table 1).
Patients were categorized according to the life-limiting illness that accounted for their referral to palliative care, namely cancer diagnoses or nonmalignant diagnoses.
Deidentified demographic data were also collected, which included age, gender, date of death, and place of residence at the time of referral.
Data analyses
The demographic data were reported using descriptive statistics. In order to conduct a longitudinal analysis, the time points of interest were calculated backwards from death. This allowed prevalence and incidence of reports of pain to be charted at discrete time points allowing changes over time to be evaluated. Four time points were chosen, creating three discrete time periods over which to consider change, with sufficient numbers of people alive at each point to have data available. Symptom scores were included in the analysis if a visit had occurred exactly on the day or three days either side of the census day. Census days were 90, 60, 30, and 7 days from death.
The intensity of pain was substratified into four levels: 0 (none); 1–3 (mild); 4–6 (moderate); and 7–10 (severe).
Group differences were assessed using analysis of variance. The relationship between pain scores and performance status measures was also examined. Data were analysed using Stata statistical software version 12.0 (StataCorp., 2011, College Station, TX).
Ethics
The study was approved by the SCHCS Human Research Ethics Committee with only aggregate data presented, with cells sizes sufficiently large to ensure no individual could be identified from this work.
Results
Descriptive data
All referrals to SCHCS were included, resulting in a sample of 3027 client records. On average, patients were seen 17.3 times between referral and death by the nursing community palliative care team, with this group responsible for collection of routine symptom scores. The average time length of survival while on the service was 83 days (SD±87.88; median 53, range 0–676). This generated 52,387 data collection points.
The demographics are summarized in Table 2. Almost 60% of clients were male (n=1793) with the mean age at time of admission being 70.63 (SD±14.22; median 73, range 0–102 years). The majority of referrals to the palliative care service were made because of an underlying cancer diagnosis.
Pain scores on admission to palliative care services
At the time of referral to palliative care, the admission pain score for almost half of the clients (46.7%) was zero. The mean pain score was 2 (SD±2.24; median 2, range 0–10). At admission, 7% (n=208) (see Table 3) had severe pain as defined by a pain score of ≥7.
Twenty-two initial visits missing data.
Pain scores at each time point
The numbers of pain scores available at each data point is summarized in Table 4. Not all 208 clients with severe pain on admission have scores at each time point (nor are all clients without severe pain on admissions included in each time point). This is due to either or both of two reasons: (1) people may have a shorter length of stay than 90 days; or (2) people did not have a visit within the window for data inclusion (within three days either side of the census points at 90, 60, 30, and 7 days before death).
Correlation of pain scores with other factors on admission
Despite the fact that more males were admitted to the palliative care service, a significantly greater proportion of females were admitted with high pain scores (8.18% [n=105] versus 5.97% [n=107]; χ2 (3026)=5.61, p=0.018).
In addition, the subgroup of people admitted with pain scores greater than 7 were significantly younger than the average age of the group overall (67.7 years versus 70.6 years; t (3025)=3.07, p=0.022).
There was no significant difference in the proportion of people with high pain scores between diagnostic groups (cancer/noncancer; p=0.27).
Longitudinal prevalence and severity of pain
People with self-reported severe pain scores on admission had significantly higher pain scores at each subsequent time point than those admitted with pain scores <7: 90 days, F(1, 654)=55.72, p<0.001; 60 days, F(1, 1008)=48.62, p<0.001; 30 days, F(1, 1522)=60.36, p<0.001; 7 days, F(1, 1897)=15.4, p<0.001.
Even though the pain scores of the group admitted with higher pain scores were always higher than scores of those admitted with lower pain scores, the former group's score fell more significantly. The group with pain ≥7 decreased significantly to an average of 4/10 at 90 days and further decreased to 2.72/10 at 7 days before death (F(3, 379)=2.92, p=0.03). In contrast, those with lower pain on admission had a significant mean increase in pain from 90 days to 7 days (F(1, 4702)=3.74, p=0.01) (see Figure 1).
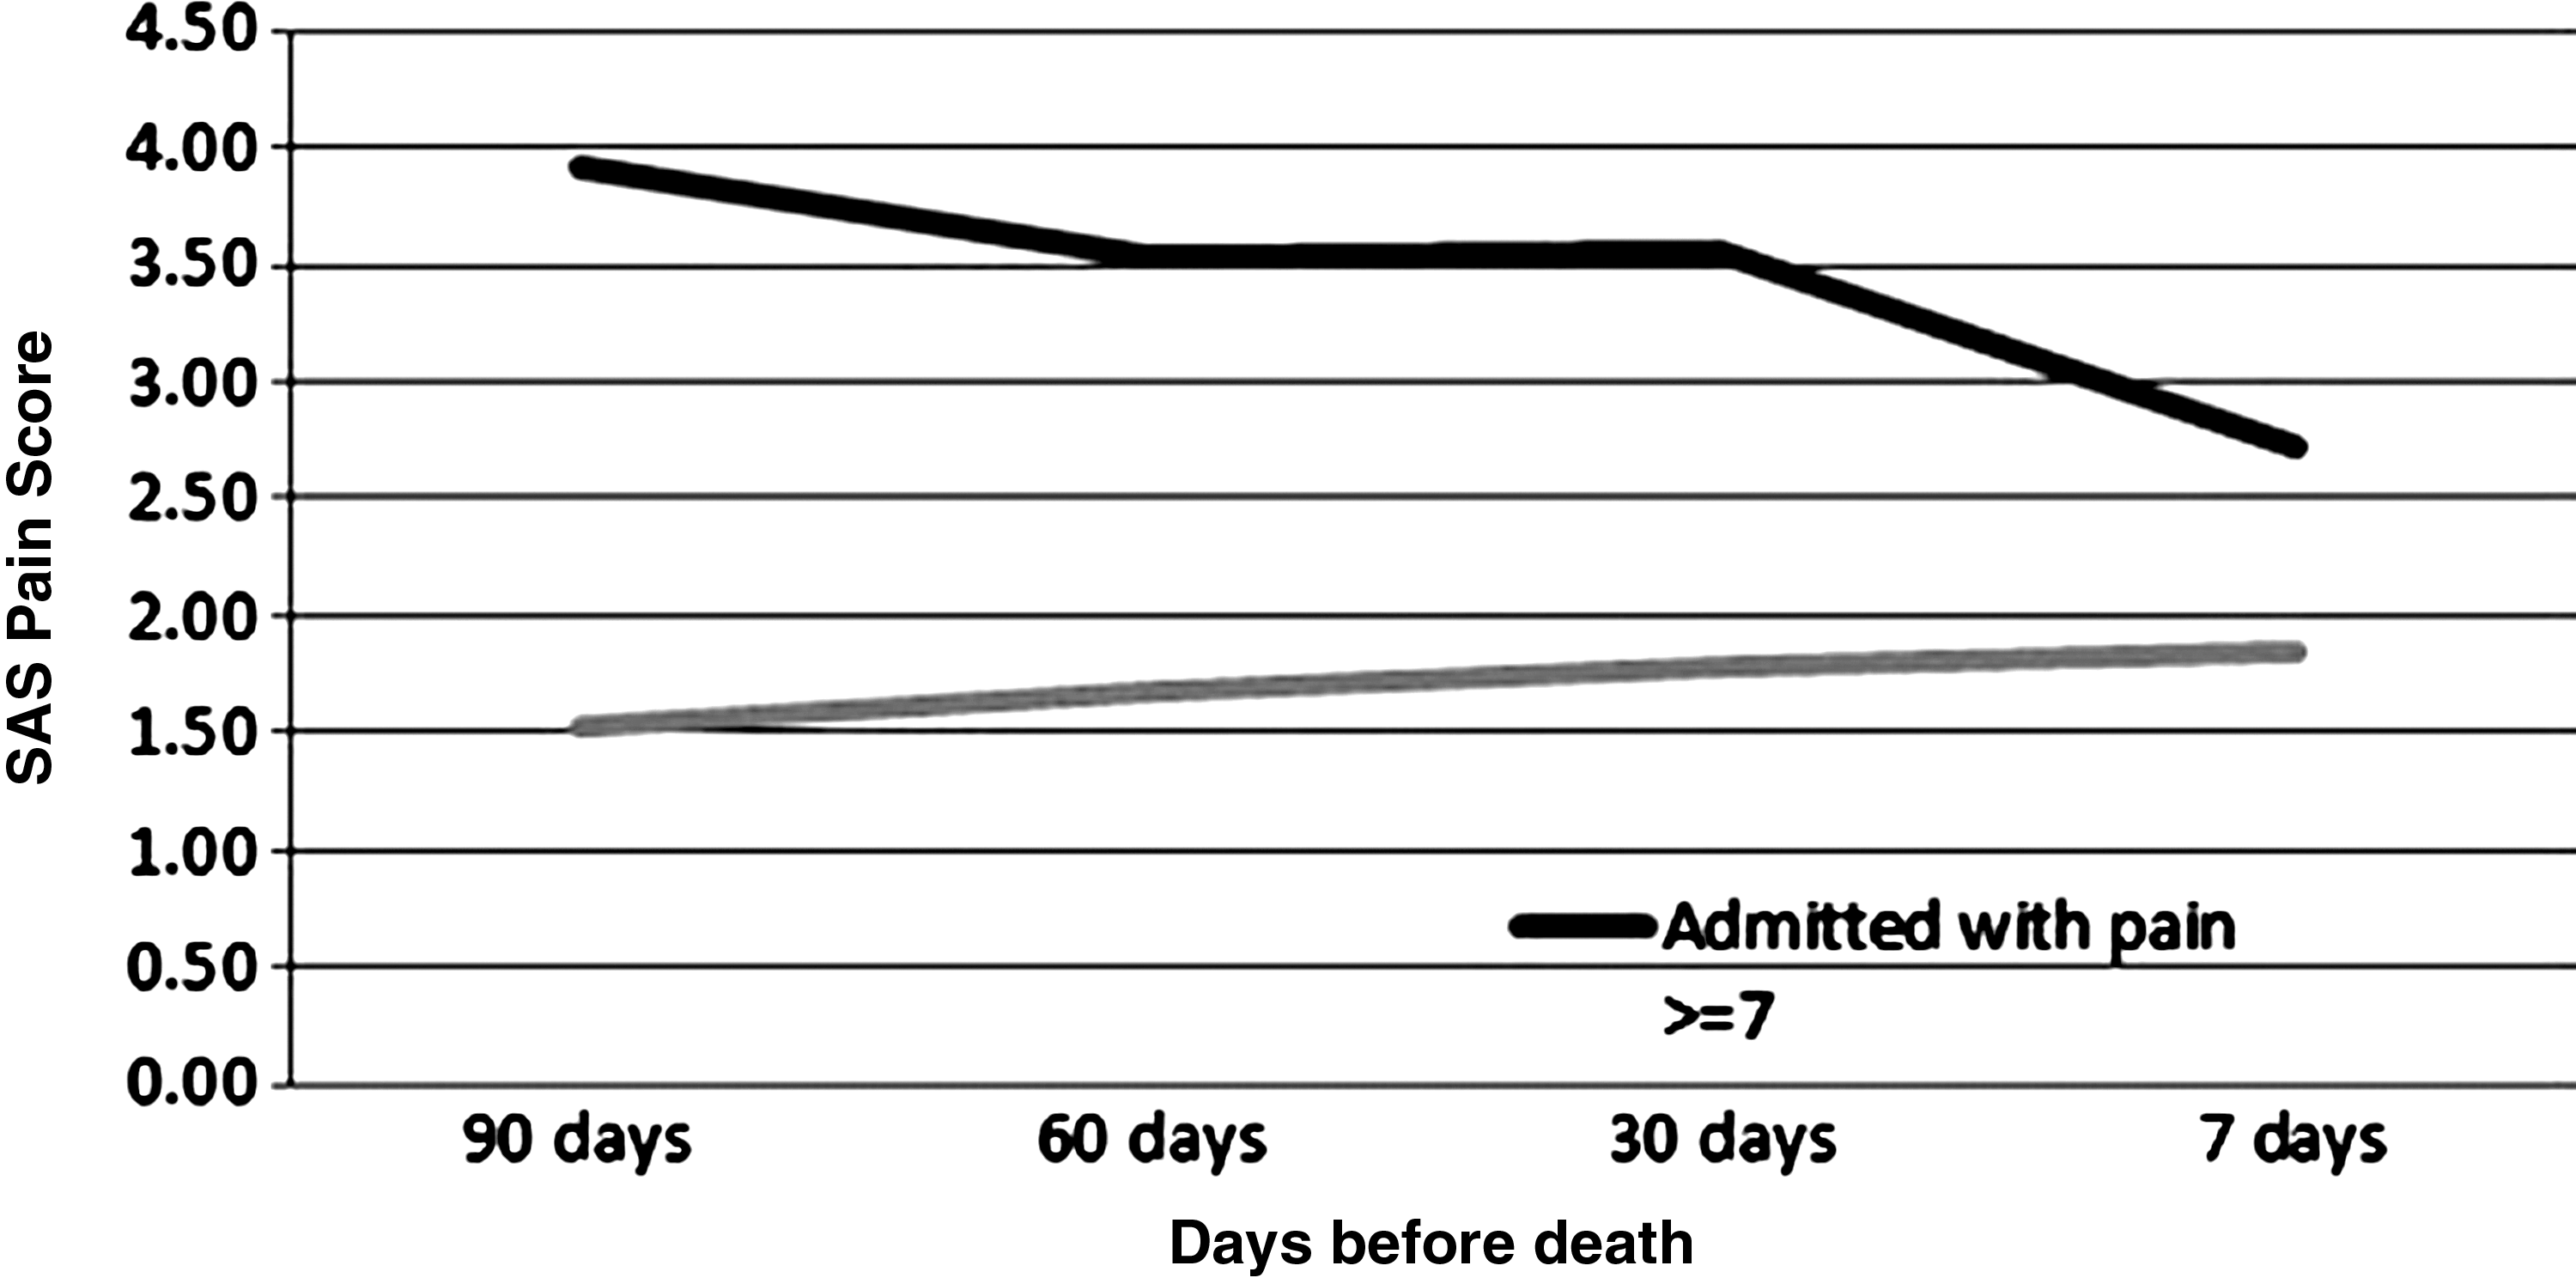
Changes in pain scores over time.
Association of pain with other variables
There was no significant difference between the performance status (AKPS) of those admitted to the service with pain scores ≥7 compared to those with pain scores of <7. Over time, regardless of pain scores, the performance status of this cohort deteriorated as death approached as evidenced by the changes in the AKPS between each time point. However, there was no significant difference at any time point in AKPS between those admitted with severe pain and others. When examining the RUG-ADL scores, there was no difference in functional dependence between those admitted with pain scores ≥7 and those with pain scores <7 except at seven days before death. At this point, people admitted without severe pain have significantly more functional dependency (mean=8.7) than those admitted with severe pain (F(1, 1610)=4.43, p=0.03, mean=7.9).
In contrast, when the pain scores of people admitted with pain scores ≥7 were examined over time, as their RUG-ADL scores increased (reflecting increased dependency), their pain scores improved. However, examining the RUG-ADL and pain scores for those admitted with pain scores <7 revealed that there was a small increase in their pain scores over time as well as a similar increase in ADL score seen in clients with severe pain on admission (see Figures 2 and 3).

Pain and ADL scores for people with pain scores <7 on admission.
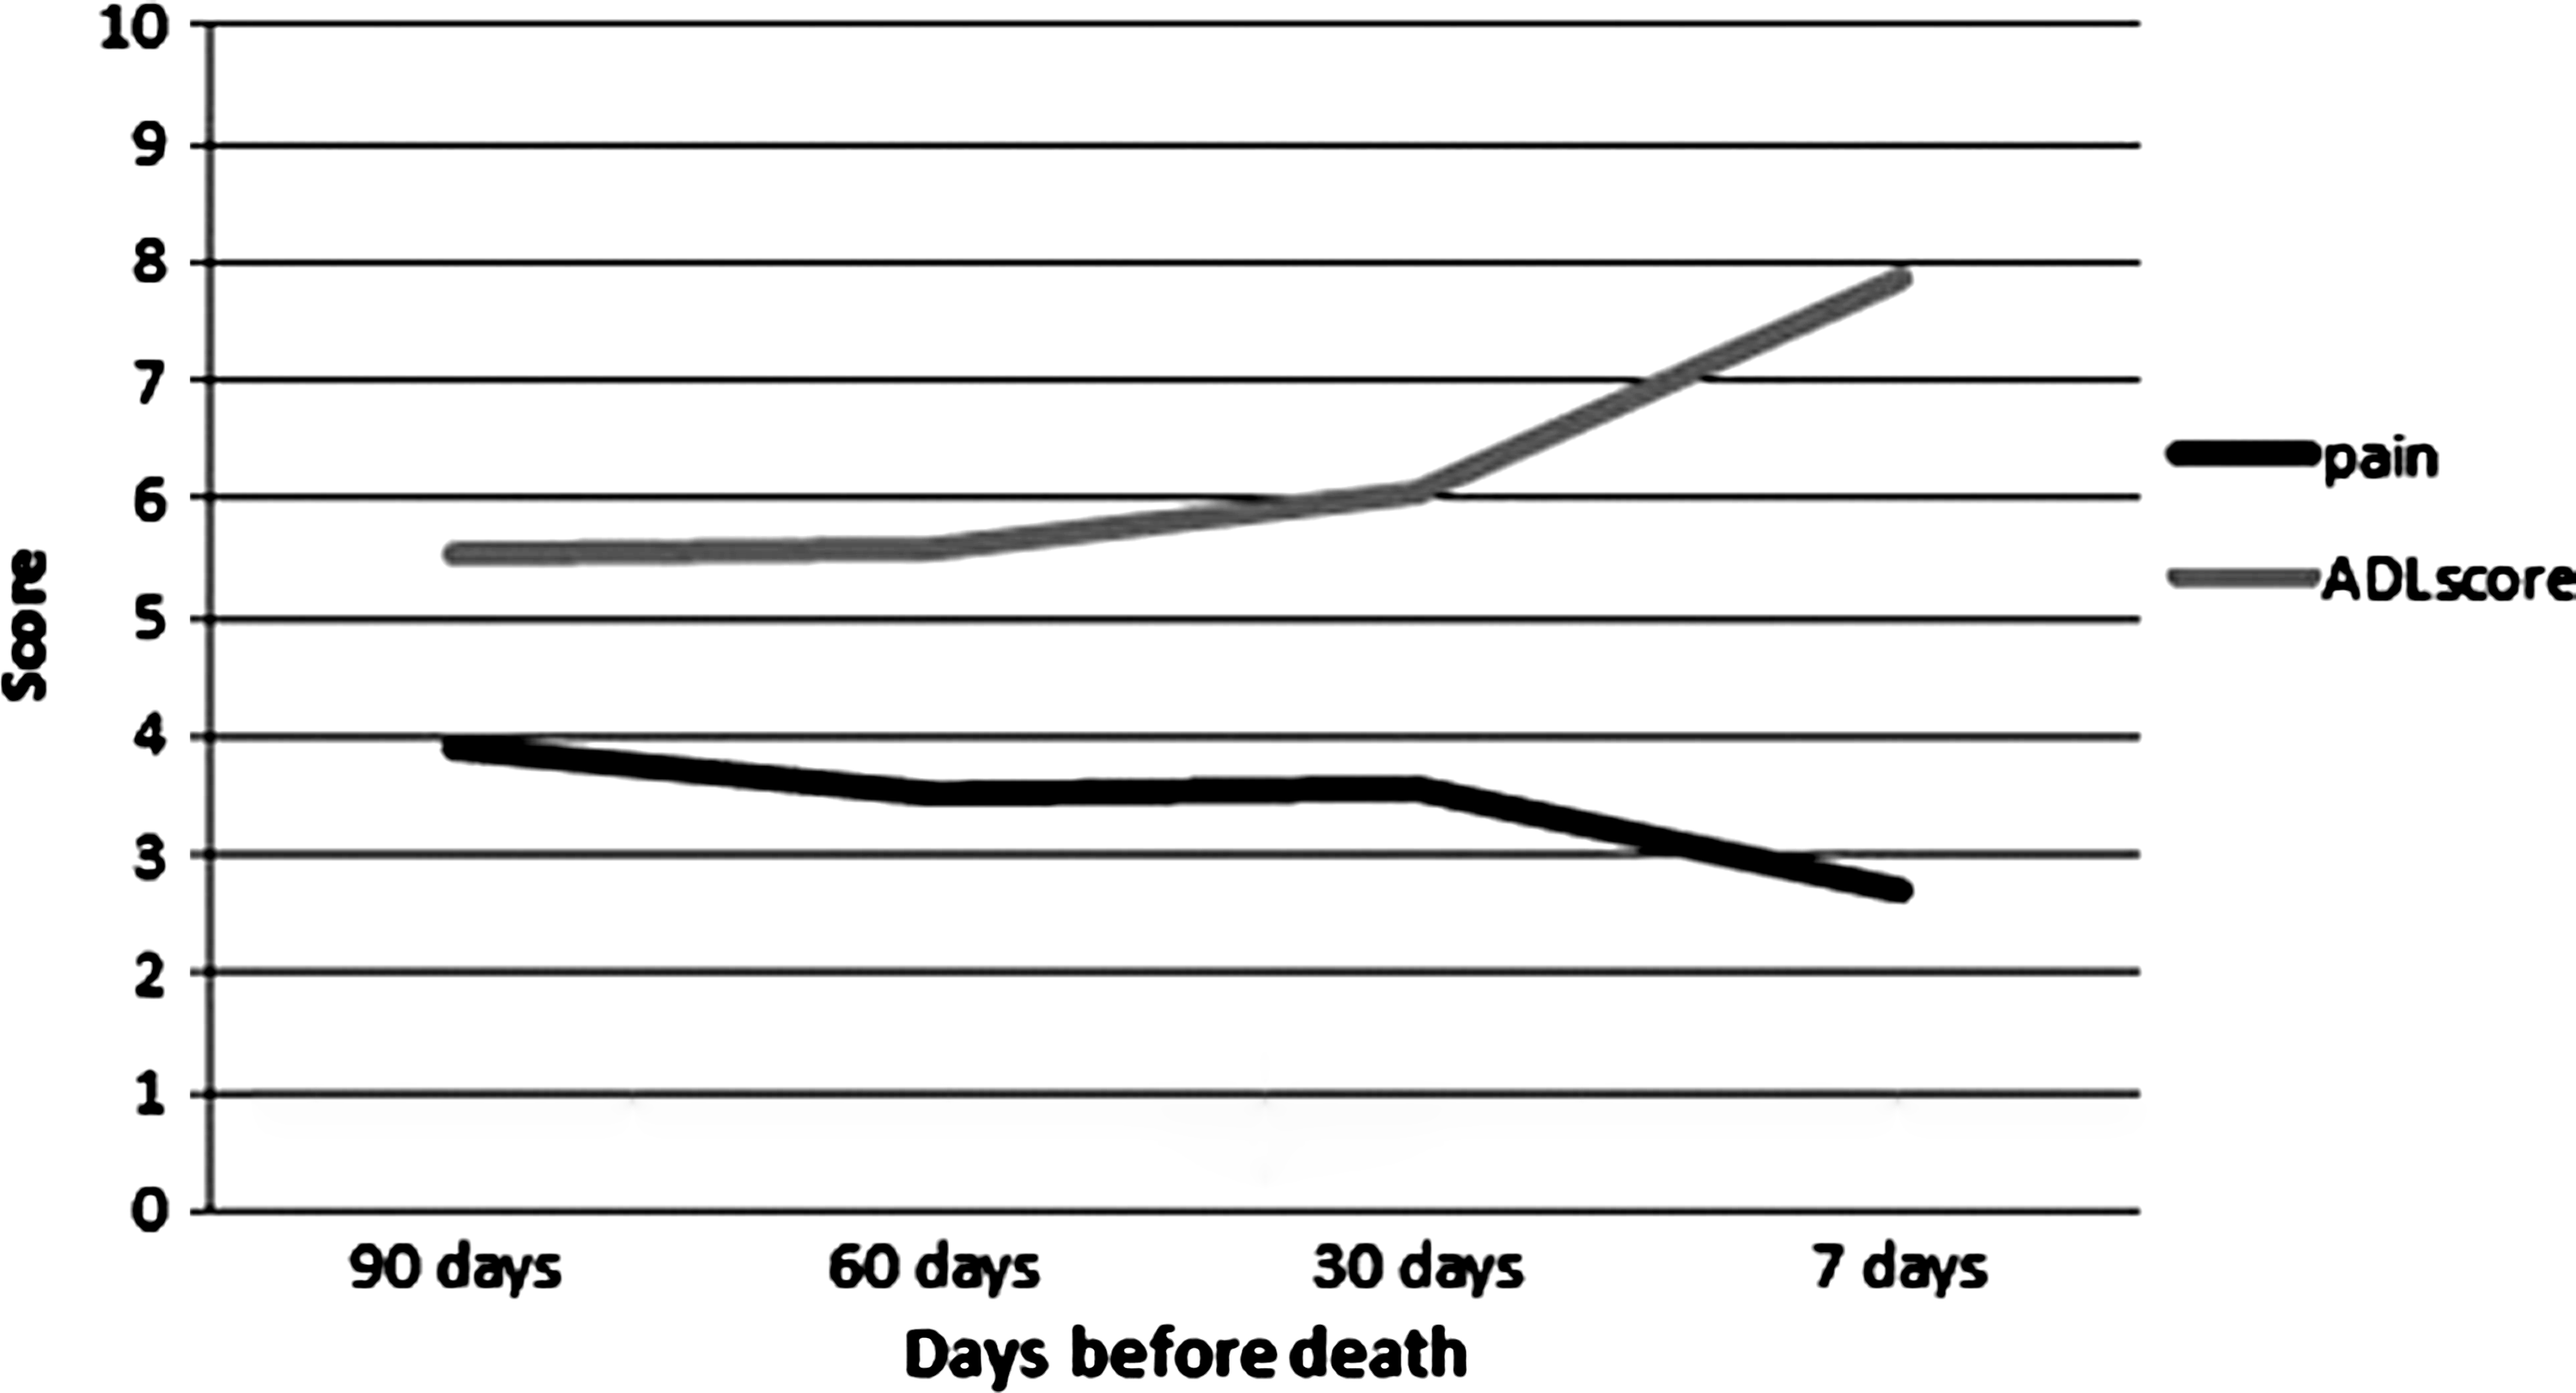
Pain and ADL scores for people with pain scores <7 on admission.
The mean SAS total score was calculated by adding the score of each symptom at each visit. Figure 4 shows that at each time point, apart from seven days from death, the clients who were admitted with severe pain had a significantly higher score, indicating on average a higher symptom load (90 days, F(1, 617)=19.86, p<0.001; 60 days, F(1, 966)=27.06, p<0.001; 30 days, F(1, 1420)=18.26, p<0.001).

Relationship of pain to SAS scores.
Discussion
This paper reports the prevalence and intensity of self-reported pain scores over time in a population of patients referred for specialist palliative care. Previous observations support that people cared for by specialist palliative care tend to have superior outcomes in pain and other symptoms compared to people not referred to these services. Objectively recording the experiences of people while receiving optimal care as outlined in this work helps identify areas that require further exploration.
At the time of referral nearly half the patients were pain free. This contrasts with a meta-analysis of prevalence studies of pain in advanced cancer, which report rates of pain at 64% (CI 58% to 69%). 8 Of those who did have pain on admission to the palliative care service, a significantly higher proportion of women reported pain despite the fact that more men were admitted to the service. Previous observations report there may be differences in the way women perceive pain and respond to analgesia compared with men. 9 While more recent data have failed to illustrate any significant differences between pain scores reported by women compared to men, another observation was made regarding gender differences in pain perception. A cohort study (n=1325) revealed pain tends to cluster with different symptoms in men compared to women. In women, physical symptoms tend to cluster independently from psychological symptoms, whereas in men, pain tends to cluster with anxiety and depression. 10 More work is required to understand the reported differences between genders at a population level.
Another subgroup that reported higher pain scores in this study were younger people. On admission to the palliative care service, people with severe pain scores were significantly likelier to be younger than the group overall. This relationship has been observed in other cohort studies,10,11 with younger patients (<60 years) more likely to experience pain, and older patients (>60 years) more likely to experience fatigue. It is of interest noting that the small group <16 years of age, 70% (n=20), had no pain.
When the pain scores of people ≥7 were examined over time, this group's scores were always higher than the group admitted with <7. This is despite the fact that the group with severe pain had scores that reduced significantly over time as would be expected with support of a specialist care service. In contrast, the scores of those admitted with pain <7 increased over time. The reduction in the severe pain scores was concurrent with increasing dependency, as suggested by the RUG-ADL scores, reflecting deteriorating function. This suggests that severe pain experienced by this group may have been worsened by movement when functional status was better, a symptom generally acknowledged as being more difficult to treat. Pain triggered by movement or incident pain is associated with higher morphine-equivalent doses and longer times to achieve stable pain control. 12 The nature of pain and the temporal relationships to factors such as mobility were not routinely measured in this dataset, although they would be part of the clinical assessment initiated in response to symptom screening.
Pain scores did not differ between those who lived alone and those who lived with others. It can be assumed if pain is worsened by movement, that continuing to perform all the activity needed to manage living alone is difficult. While there is no way to understand from these data the amount of external support people were receiving, it is interesting to speculate on people's resilience and determination despite pain.
Finally, the total SAS was surprisingly stable for the patients admitted with pain <7 over the three months prior to death. In contrast, those admitted with higher pain scores had an increase in the total SAS. This was despite the reduction in pain, raising the question of whether good pain control may place people at risk of more adverse effects of analgesia such as constipation, fatigue, and nausea. Another possibility may be that this group with higher scores was inherently more unstable and therefore carrying greater symptom burdens. The final possibility is, as others have suggested, that different symptoms cluster together. Recently, Kirkova and colleagues 13 suggested that while there may be clinical correlations between symptoms, these were not reflected statistically. This group concluded that it is highly likely that symptom clusters depend upon population factors (diagnosis, stage of illness), data collection instrument, and the analysis. These observations require more work, as by improving understanding of the factors that lead to clustering, it may be possible to improve overall symptom control.
Strengths of this study
Using routine data collection, this study allows the experiences of people with pain complicating their life-limiting illness to be examined longitudinally from the time of referral to death. In particular, this study allows the changes in pain scores in the subgroups defined by severity to be analyzed separately.
Limitations of this study
This study used data collected prospectively which is then anchored at death. It means that detail about the nature of pain experienced was not able to be aggregated from the clinical notes. It is not possible to codify the number of responses from patients themselves, and those from families or health professionals.
Implications for further research
More work is required to understand the optimal approaches to assessing and managing pain reported as severe at the time of referral to palliative care services. The relationship of deteriorating functional performance to improvement in pain strongly suggests some severe pain to be incident pain. Although it is possible to manage background pain in the majority of cases, the management of incident pain remains more problematic.
Further clarity is required to understand whether there are reproducible symptom clusters. This is required as there is a possibility that optimally managing one symptom may have a flow on effect to improving other synchronous symptoms.
Footnotes
Author Disclosure Statement
No competing financial interests exist.