
Abstract
Abstract
Background:
Currently, more than half of all nursing home residents use hospice at some point. Studies have shown benefits to hospice enrollment for patients; however, the literature on ownership differences in hospice care in general has indicated that for-profit hospices offer a narrower scope of services and employ fewer professional staff. Although nursing home staffing patterns have been shown to be essential to quality of care, the literature has not explored differences in number of patients per staff member for hospice care within nursing homes.
Methods:
We hypothesized that for-profit hospices would have a higher number of patients per staff member for home care workers (HCWs), registered nurses (RNs), and medical social workers (MSWs), and this relationship would be moderated by the proportion of hospice users living in nursing homes. Using data from the National Hospice Survey, a random sampling of all Medicare-certified hospices operating between September 2008 and November 2009, we identified 509 hospices that served individuals living in a nursing home, with 89 hospices having 50% or greater of their clients living in a nursing home.
Results:
Adjusted analysis indicated a higher number of patients per staff member for HCWs and RNs among for-profit hospices. Moreover, compared with nonprofit hospices, for-profit hospices with a high proportion of nursing home residents had 36 more patients per HCW (p=0.011) and 24 more patients per RN (p=0.033).
Conclusions:
Staffing is an important indicator of hospice quality, thus our findings may be useful for anticipating potential impacts of the growth in for-profit hospice on nursing home residents.
Introduction
Although previous research has examined differences in nonprofit and for-profit hospices, this research has not focused on differences within the nursing home setting. Evidence about nonprofit and for-profit hospices in general has indicated that for-profit hospices provide a narrower scope of services 10 and employ fewer professional staff. 11 In particular, for-profit hospices have been shown to use fewer registered nurses (RNs) as a proportion of all nurses and use fewer medical social workers (MSWs) as a proportion of all counselors. 12 Within nursing homes, studies have shown that receiving hospice compared with not receiving hospice is associated with higher quality of care5–7 and satisfaction 13 ; however, these studies did not examine differences between nonprofit and for-profit hospices delivering care in nursing homes. Specially, the literature has not explored differences by ownership type in number of patients per staff member for hospice nursing home care, even though staffing patterns are essential to nursing home quality of care.14–15 Because nursing home residents often have substantial functional and cognitive impairment, they may be particularly vulnerable to suboptimal hospice care.
Accordingly, we sought to determine differences in staffing patterns of for-profit and nonprofit hospices caring for nursing home residents. Using data from the National Hospice Survey, a cross-sectional national survey of Medicare-certified hospices, 11 we estimated the association between hospice ownership type and reported staffing patterns. Based on financial incentives, we hypothesized that for-profit compared with nonprofit hospices would have a higher number of patients per staff member for RNs, MSWs, and home health aides. Additionally, we hypothesized that this relationship could be moderated by the proportion of hospice users residing in a nursing home for each individual hospice. Because staffing can be an important indicator of hospice quality, our findings can be useful for anticipating potential impacts of the growth in for-profit hospice on nursing home residents.
Methods
Study design and sample
We conducted a cross-sectional study using data from the National Hospice Survey, conducted between September 2008 and November 2009. 11 The National Hospice Survey sample was selected randomly from all Medicare certified hospices included in the 2006 Medicare Provider of Services (POS) file. To incorporate newly operational hospices, the National Hospice Survey sample also included randomly selected hospices that had been operational for 2 years or less from the 2008 Medicare POS file. A more detailed account of the sampling methodology used to create this dataset is described in an earlier publication. 11 A total of 914 hospices were contacted for participation (775 hospices obtained from the 2006 POS file and 139 newly operating hospices obtained from the 2008 POS file); 208 (23%) were excluded because the facility was either closed or no longer providing hospice care. Of the remaining 706 hospices, 591 hospices (84%) had the staff member most knowledgeable about the survey questions complete the web-based survey. Data from each survey were combined with the information from the 2008 Medicare POS file by hospice ID for analysis. We limited the sample for the current analysis to include only hospices that reported treating any nursing home residents, for a total sample size of 509 hospices. Within this sample, 89 hospices treated primarily nursing home residents (defined as having more than 50% of patients residing in the nursing home) and were used to conduct subgroup analyses.
Measures
The primary dependents variables were the average number of patients per staff member for each staff type. The survey questions asked, “Please estimate the number of patients per day your hospice cared for during a typical day in the past 12 months in nursing home setting” and the number of full-time (staff type) employed over the past 12 months. We calculated the number of hospice users per staff member for RNs, MSWs, and home care workers (HCWs). We constructed each value by dividing the hospice's response for the average number of patients served per day over the past year by the average number of full-time equivalent RNs, MSWs, and HCWs employed over the past 12 months, respectively.
Our primary independent variable was hospice ownership type, which was self-reported by the hospice and classified as for-profit, government, or nonprofit. Additional covariates included hospice size (average number of patients served per day), years in operation since Medicare certification (0–9 years and ≥10 years), census geographic region (New England, Middle Atlantic, East North Central, West North Central, South Atlantic, East South Central, West South Central, Mountain, and Pacific), and proportion of hospice users residing in a nursing home (the average number of hospice users living in a nursing home per day over the past 12 months divided by the total average number of hospice users per day over the past 12 months). Additionally, we created a binary variable representing ≥50% of hospice users residing in a nursing home (equal to 1) and 0 if the proportion was <50%.
Statistical analysis
We used standard descriptive statistics to describe our sample of hospices and the distribution of our outcome variables. We then used t tests and analyses of variance (ANOVA)s to estimate the unadjusted associations between hospice organizational characteristics (ownership type, hospice size, years in operation since Medicare certification, proportion of hospice users residing in a nursing home, and census geographic region) and our staff-related outcomes (numbers of patients per staff member for each type of hospice staff ). We used multivariable linear regression models to estimate the adjusted associations between hospice organizational characteristics and our staff-related outcome measures. Additionally, because we hypothesized that the proportion of hospice users residing in a nursing home could moderate the association between ownership type and staffing, we tested this moderation by including in our multivariate model the interaction between ownership type and proportion of hospice users residing in a nursing home as a continuous variable and categorical variable with a cut point at 50%. We also performed subgroup analysis among hospices that had at least 50% of their users residing in nursing homes. All analyses were performed using SAS software, version 9.2 (SAS Institute, Cary, NC).
Results
Study population and sample characteristics
Within our sample, approximately 7% of hospices had at least 2 out of 3 of their patients in nursing homes and an additional 11% of the overall sample (n=89 hospices) had at least half of their users residing in nursing homes. A total of 51% of hospices in our sample had at least one-quarter of their users residing in nursing homes. Survey response rates did not differ significantly by hospice geographic region, years since Medicare certification, or size, although for-profit hospices were significantly less likely to respond, as has been previously reported. 11
Sample characteristics of the 509 hospices that served nursing home residents are shown in Table 1. The sample was evenly distributed between for-profit and nonprofit ownership type. On average, hospices served approximately 94 (standard deviation [SD] 179.9) individuals per day. Nearly 42% of hospices had been operating for less than 10 years. Overall, approximately 30% of hospice users resided in nursing homes. The mean number of patients per hospice HCW was 15 patients (SD 44.3); the mean number of patients per hospice RN was 8 (SD 26.9) patients; and the mean number of patients per hospice MSW was 22 (SD 57.6) patients.
Staffing patterns
In unadjusted analysis (data not shown), for-profit hospices had more than twice as many patients per HCW compared with nonprofit hospices (p value of 0.009). For-profit compared with nonprofit hospices also had more patients per RN and MSW, but these differences were not significant (p values of 0.081 and 0.114, respectively). Hospice size was significantly associated with a higher number of patients per staff member for HCWs, RNs, and MSWs (p values of 0.005, 0.023, and <0.001, respectively). Years in operation since Medicare certification was significantly associated with the number of patients per HCW, with younger organizations having a higher number of patients per HCW (p value of 0.043); however, years since Medicare certification was not significantly associated with the number of patients per RN or per MSW (p values of >0.10). Geographic region was not significantly associated with the number of patients per staff member for any staff type (p values of >0.05).
Stratifying by having at least 50% of hospice users living in a nursing home exhibits a difference in the breakdown of patient per staff type by ownership type (Fig. 1). Among hospices that had 50% or more of their users residing in nursing homes, there was a significantly higher number of patient per staff type for HCWs and RNs (p values of 0.003 and 0.007, respectively) but not for medical social workers (p value of 0.439). The difference in ownership type was not seen for HCWs, RNs, or MSWs in hospices with less than half of their users residing in nursing homes (p values of >0.05).
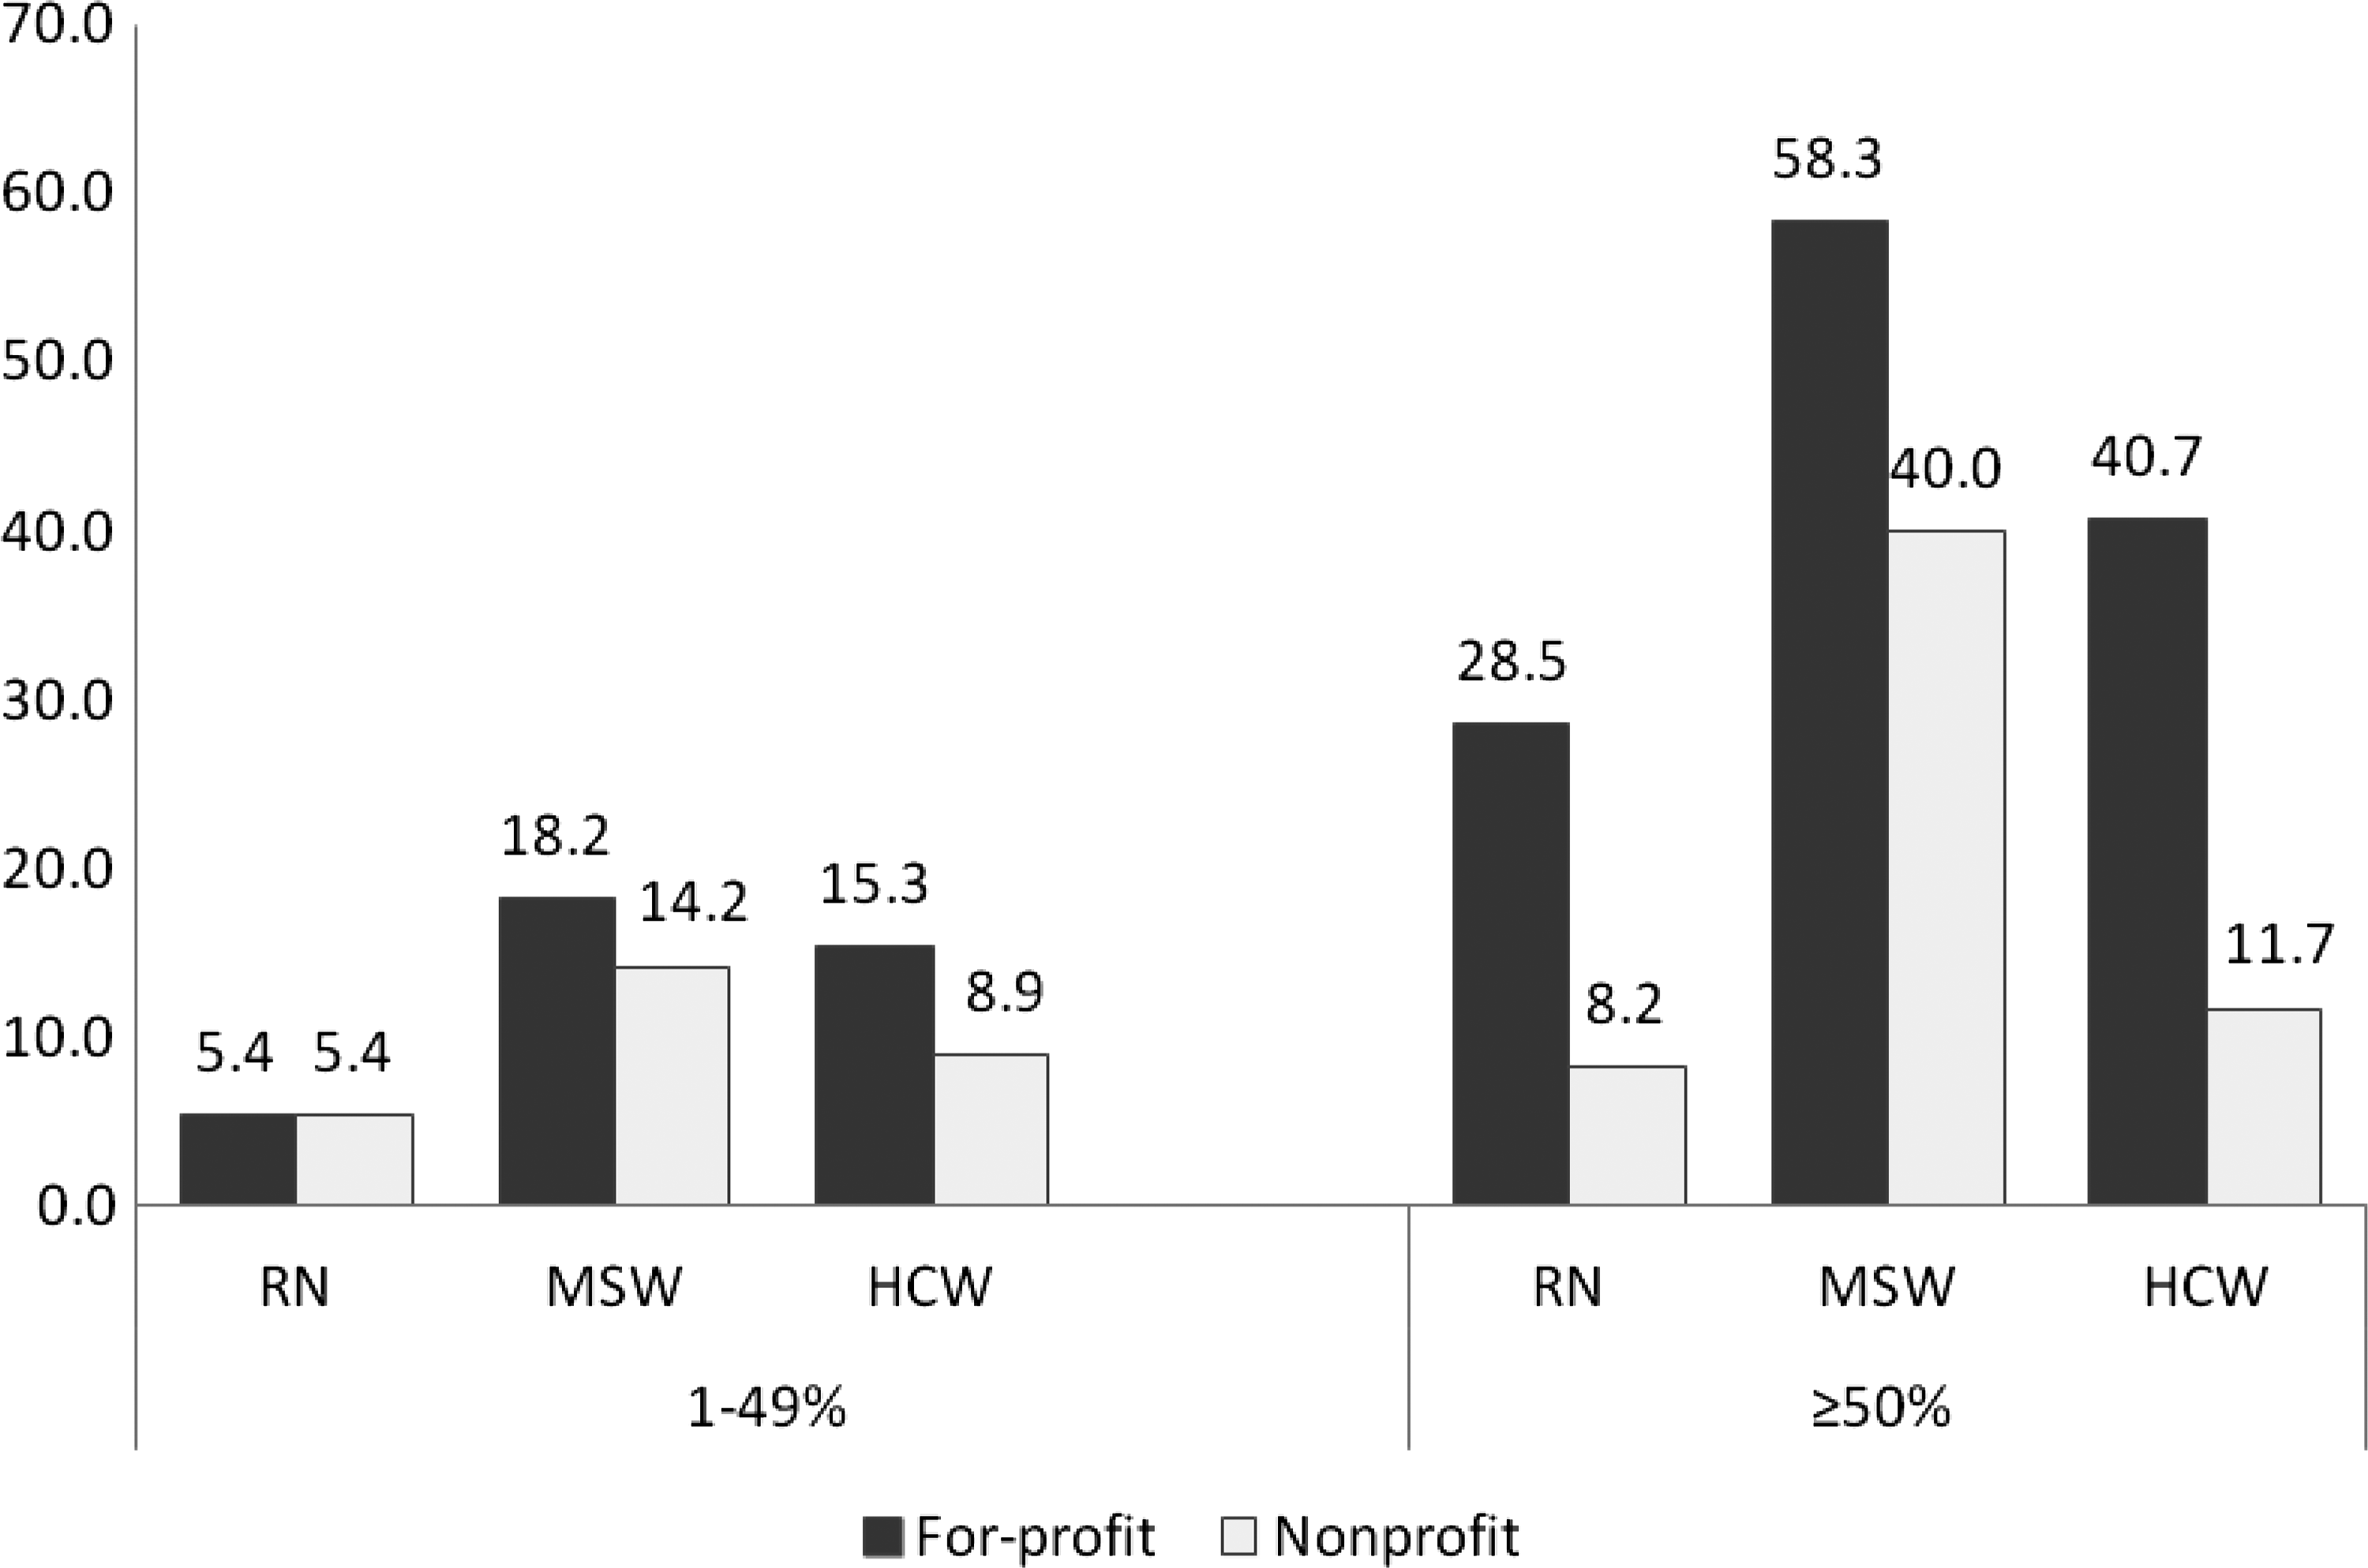
Average number of hospice patients per staff type by percentage of users residing in nursing homes for for-profit and nonprofit hospices.
In analysis adjusted for geographic region, hospice size, and years in operation since receiving Medicare certification, the association between ownership type and number of patients per staff member remained significant for HCWs and became significant for RNs (Table 2). Compared with nonprofit hospices, for-profit hospices had 16 additional patients per each HCW (p value of 0.002) and 6 additional patients per each RN (p value of 0.036). Hospice size was also significantly associated with the numbers of patients per HCW, per RN, and per MSW (p values of 0.004, <0.001, and <0.001, respectively) with larger hospices having more patients per each staff type. We also tested for a moderating effect of size on the relationship between ownership type and patients per staff member; however, because this effect was not significant it is not presented or included in models. Neither the number of years in operation since Medicare certification nor geographical region was significantly associated (p values of >0.05) with the number of patients per staff member in the adjusted analysis. Building upon our main effects analysis, we found that the association between ownership type on number of patient per staff member was significantly moderated by proportion of nursing home residents for HCWs and for RNs (p values for interaction terms of 0.040 and 0.003, respectively).
Subgroup analysis
Among the sample of hospices that had 50% or greater of their users residing in a nursing home (n=89), for-profit hospices had 36 more patients per HCW (p value of 0.011) and 24 more patients per RN (p value of 0.033) compared with nonprofit hospices (Table 3). Among hospices that had less than 50% of their users residing in a nursing home (n=420), for-profit hospices had 11 more patients per HCW and one more patients per RN (p values of 0.048 and 0.653, respectively) compared with nonprofit hospices.
Discussion
We found distinct differences by hospice ownership type in staffing patterns, particularly for HCWs and RNs. The magnitude of the associations was large, with for-profit hospices on average having 15 more patients per HCW and 5 more patients per RN than nonprofit hospices. The relationship was apparent among the full sample of hospices but was particularly pronounced among hospices that had more than 50% of their patients residing in nursing homes. Reports by the Office of Inspector General (OIG) 2 have highlighted concerns about hospices that predominately care for nursing home residents, noting that these are for the most part for-profit hospices and may have opportunities to provide less complex care over a longer duration. Nevertheless, ours is the first study of which we know that has examined, among a national sample of hospices, the role of ownership on staffing patterns for hospices serving nursing home residents.
Previous literature has demonstrated the substantial value of hospice care within nursing homes. Hospice presence in nursing homes has been linked to increased pain management6–7 and lower rates of hospitalization in the last 30 days of life. 5 Moreover, nursing homes that offered hospice services were more likely to have special programs and trained staff for hospice or palliative care, 16 and these were also linked with higher likelihood of having special programs for mental health services. 16
Nevertheless, this literature had not examined differences in for-profit and nonprofit hospices care in the nursing home setting. Our study suggests that, despite the overall benefits of hospice in the context of nursing homes, hospices differ in their approaches with for-profit hospices using fewer staff for their patient populations compared with nonprofit hospices.
The recent OIG report expressed concerns about hospices targeting the nursing home environment because of the potential for increased profits. 2 Nursing home residents tend to have less invasive care needs but require a longer duration of care; additionally, the current Medicare reimbursement system pays an identical rate for care regardless of the location or daily services provided, which have both been linked to increased profit margins. 2 Moreover, since 2005, Medicare spending on hospice care based in nursing homes has grown nearly 70%, and the majority of these hospices primarily serving nursing home residents have been for-profit. 2 Our analysis adds to the expressed concerns as for-profit hospices may employ fewer staff per patient. Currently, the requirements for the Medicare Certificate of Participation for hospices does not address specific staffing requirements, although patient-to-staff ratios exist as part of hospice licensure regulations in some states. Our study indicates that for-profit hospices tend to have more patients per staff member, which could lead to lower quality of care.
Our findings should be interpreted in light of several limitations. First, we cannot evaluate whether a higher number of patients per staff member result in poorer quality of care. It may be that for-profit hospices are more efficient in their use of staffing without compromising quality, that their nursing home-hospice contracts allow for more care to be provided by existing nursing home staff or that they have invested in better technology for delivering services. The only data we have on technology is the use of an electronic medical record, which was significantly more likely among nonprofit than for-profit hospices. Second, our study is limited by the potential for response rate bias because for-profit hospices were less likely than nonprofit hospices to respond; the direction of this bias is unclear. Additionally, because our data were collected at the hospice level, we only had access to the overall number of patients per staff member and were not able to directly estimate the number of patients per staff member providing care to nursing home residents, nor were we able to determine if patient-level health outcomes were affected by staffing differences. Although we assumed these ratios were equivalent, it is possible that they could differ. In this analysis we were only able to assess the number of staff and did not have measures of their skill-level or capacity, which would be valuable for interpreting the observed differences. Last, we lacked specific data on services offered by each facility and patient-level data on services received or health status. Future studies are warranted to explore more comprehensive measures of staffing quality within hospice care and its association with patient-level health measures.
With the marked increase in the proportion of for-profit hospices, identifying differences in ownership type may have far-reaching implications. Our data demonstrated that for-profit ownership was associated with a significantly higher number of patients per HCWs and per RNs. Staffing represents a critical element of hospice care and thus serves an important role in measuring quality. Future studies are needed to examine if differences in staffing patterns by ownership type are linked to measures of quality of care and patient and family satisfaction.
Footnotes
Acknowledgments
This study was supported by grant 1R01CA116398-01A2 from the National Cancer Institute (Bradley) and grant 1K99NR010495-01 from the National Institute of Nursing Research (Aldridge-Carlson).
Author contributions: MEC, EB: study concept and design; MEC, MDAC: acquisition of subjects and/or data, analysis and interpretation of data; MEC, MDAC, HLS, EB: preparation of manuscript.
Author Disclosure Statement
No competing financial interests exist.