
Abstract
Abstract
Background:
Prior research on community-based specialist palliative care teams used outcome measures of place of death and/or dichotomous outcome measures of acute care use in the last two weeks of life. However, existing research seldom measured the diverse places of care used and their timing prior to death.
Objective:
The study objective was to examine the place of care in the last 30 days of life.
Methods:
In this retrospective cohort study, patients who received care from a specialist palliative care team (exposed) were matched by propensity score to patients who received usual care in the community (unexposed) in Ontario, Canada. Measured was the percentage of patients in each place of care in the last month of life as a proportion of the total cohort.
Results:
After matching, 3109 patients were identified in each group, where 79% had cancer and 77% received end-of-life home care. At 30 days compared to 7 days before death, the exposed group's proportions rose from 33% to 41% receiving home care and 14% to 15% in hospital, whereas the unexposed group's proportions rose from 28% to 32% receiving home care and 16% to 22% in hospital. Linear trend analysis (proportion over time) showed that the exposed group used significantly more home care services and fewer hospital days (p < 0.001) than the unexposed group. On the last day of life (place of death), the exposed group had 18% die in an in-patient hospital bed compared to 29% in usual care.
Conclusion:
Examining place of care in the last month can effectively illustrate the service use trajectory over time.
Introduction
P
The results in the numerous trials, along with several systematic reviews,12–15 have demonstrated that the specialist team model improves patient outcomes such as quality of life, satisfaction, and symptom burden. In terms of health system outcomes, this research has largely focused on measures that can be determined using administrative data, such as place of death—either supporting a home death or avoiding a hospital death—and avoiding hospitalizations and emergency department (ED) visits in the last two weeks of life. These have been validated as indicators of poor end-of-life quality, because they emphasize too much focus on aggressive care.16,17 For example, a recent pooled study of 11 community-based specialist teams showed that exposure to a team versus usual care reduced the risk of being in hospital by 32% and having an ED visit by 23% in the last two weeks of life, and dying in hospital by 54%. 18 However, these outcomes are limited in a few important ways. The outcomes are often dichotomous variables, which are limited in exploring the trajectory of diverse settings and services used over time, prior to death, at a population level. 19 In other words, these measures do not capture the true patient journey. For instance, using these measures, a patient who is well supported at home for the majority of their end-of-life care but goes to the hospital appropriately in the last day or two of life would be undifferentiated from the patient who did not have any home supports and was in hospital for the last month of life.
To address this knowledge gap, we sought to examine the places of care across the last 30 days of life. We used data from a prior study, which linked administrative databases to investigate the efficacy of specialist palliative care teams to help patients avoid hospital deaths and ED visits and hospitalizations in the last two weeks of life compared to usual care. 18 Our primary aim was to examine how place of care in the last 30 days of life differs between patients exposed to a community-based, specialist palliative care team intervention versus usual care in the community. Our secondary aim was to compare health care costs associated with end-of-life care service use between the two groups. Our hypotheses were that exposure to a specialist team would be associated with fewer in-patient hospital days, more home care services used, and lower overall costs, compared to usual care.
Methods
Study design
Linking administrative databases, we conducted a retrospective cohort study in Ontario, Canada, during fiscal year 2009–2011. In Ontario, multiple regions in the past many years have independently developed their own community-based, specialist, palliative care teams. We identified patients treated by community-based specialist palliative care teams (exposed). As defined by the prior randomized controlled trials of community-based palliative care teams, a specialist team included a core group of interdisciplinary team members, specifically palliative care physicians, nurses, and family physicians who provide integrated palliative care to patients in their homes.3,4,6–8,10 A common role of the teams was to manage symptoms, provide education, coordinate care, and provide additional or enhanced support and care 24/7. The teams also had to be the only such team in their respective region. Across the province, 11 teams met these criteria, and their adult patients served who died by April 1, 2011 were included in our analysis.
Matching to create a comparison group
To create equivalent comparison groups and reduce selection bias, we used propensity score matching to assemble a group of unexposed patients who were similar to each of the intervention groups. We created a pooled cohort, each consisting of pairs of exposed patients and unexposed subjects who were selected from an appropriate control population. Matching on the propensity score can estimate the effect of the intervention, which is unbiased by differences in measured preintervention covariates.20,21 We matched on variables prior to exposure to the intervention: age, sex, cancer or noncancer, comorbidity, region and time, home care service intent, and overall length of time exposed to home care services, as described elsewhere. 18
Data sources
Each team provided a list of patients admitted to the intervention team during fiscal years 2009–2011. This list was linked to multiple administrative databases via a unique, provincial health insurance number. We used the provincial vital statistics database to confirm date of death. We used the discharge abstract database to determine hospital and palliative care unit admissions, and hospital death. The National Ambulatory Care Reporting System details ED visits, while the continuing care reporting system calculates stays in chronic or complex care beds. The home care database provided dates of publicly funded home care service use and service type. We used the Ontario Health Insurance Plan database and the physician billing codes to determine physician home visits used for palliative care. Statistics Canada census data were used to determine region and rurality, using postal code data.
Outcomes
The primary outcome was place of care for each of the last 30 days of life. Based on having any service use during the last month of life, as confirmed by billing records and fee codes, a patient was categorized into the location of care based on the following hierarchy (highest to lowest average resource cost): (1) inpatient hospitalization, (2) palliative care unit, (3) ED department, (4) complex continuing care unit, (5) home care, (6) physician home visit, and (7) other. Based on this, a patient using both a home care service and a physician home visit on the same day would be categorized into the home care category. Note we did not include hospice as a setting, because for the roughly 100,000 Ontarian deaths a year, there were only 26 residential inpatient hospices during the study period, each with an average of 10 beds; thus the vast majority of Ontarians do not have access to a hospice bed. Moreover, there is no central hospice database and thus their data cannot be linked with the other administrative data.
The secondary outcome was the average per person costs of health care services for the exposed versus unexposed groups in the last month of life. Prior costing research has developed costing macros for the above services, validated to Ontario data.22,23 Costs for physician billings included all physician costs beyond palliative home visits and regardless of specialty or setting of care, since this secondary analysis was focused on accurate costs for services used, not place of care. As well, hospital inpatient costs and palliative care unit costs were combined, since they came from the same database.
Analytic approach
We graphed each of the two cohorts by place of care as a proportion of the total cohort. To test significance over time, we conducted a linear trend analysis of the proportion of resource utilization by setting with respect to time (days to death), including covariates for exposure status (exposed versus unexposed) and the interaction of the time with exposure. To test significance of place of care trends, we set each location as binomial: 1 = yes they used that service on that day versus 0 = no they did not use that service. We then used logistic regression, adjusting for the matched and repeated measures using autoregressive correlation structure in generalized estimating equations. We also used a paired t-test to determine if total costs in the last month of life were statistically different between the two groups. The study was approved by McMaster University's research ethics board.
Results
The 11 specialist teams served 3912 patients between 2009–2011 (exposed), whereas the control regions had 41,333 deaths (unexposed) (see Table 1). The unexposed group differed from the exposed group. For instance, the percentage of cancer deaths in the exposed group was 79% compared to 35% in the control group (p > 0.001). Moreover, 77% of the exposed group received end-of-life home care services compared to 15% of the unexposed group (p > 0.001). After propensity score matching, 3109 exposed patients were matched to 3109 unexposed patients, and the characteristics of the two groups were very similar. Therefore, after propensity score matching, the main observed systematic difference between the two groups was their exposure to a specialist team.
IQR, interquartile range.
The primary outcome was place of care in the last 30 days of life (see Fig. 1). In both groups, the overall use of health care services generally increased closer to death. For home care services 30 days compared to 7 days before death, the exposed group showed a rise of 33% to 41%, whereas the unexposed group showed a rise of 28% to 32%. For hospital services 30 days compared to 7 days before death, the exposed group showed a rise of 14% to 15%, whereas the unexposed group showed a rise of 16% to 22%. A week before death, the exposed group had 6% in a palliative care unit compared to 10% in the unexposed group. On the last day of life, the exposed group had 18% die in an inpatient hospital bed compared to 29% in usual care. This means that in the last week of life 3% of the exposed group and 7% of the unexposed group moved to an acute care setting. Presumably, the patients who received home care, a palliative care physician home visit, or were categorized as “other” were at home on that day, since they were not in another acute care setting; this means that 77% of the exposed group and 67% of the unexposed group were being cared for in their homes a week before death.
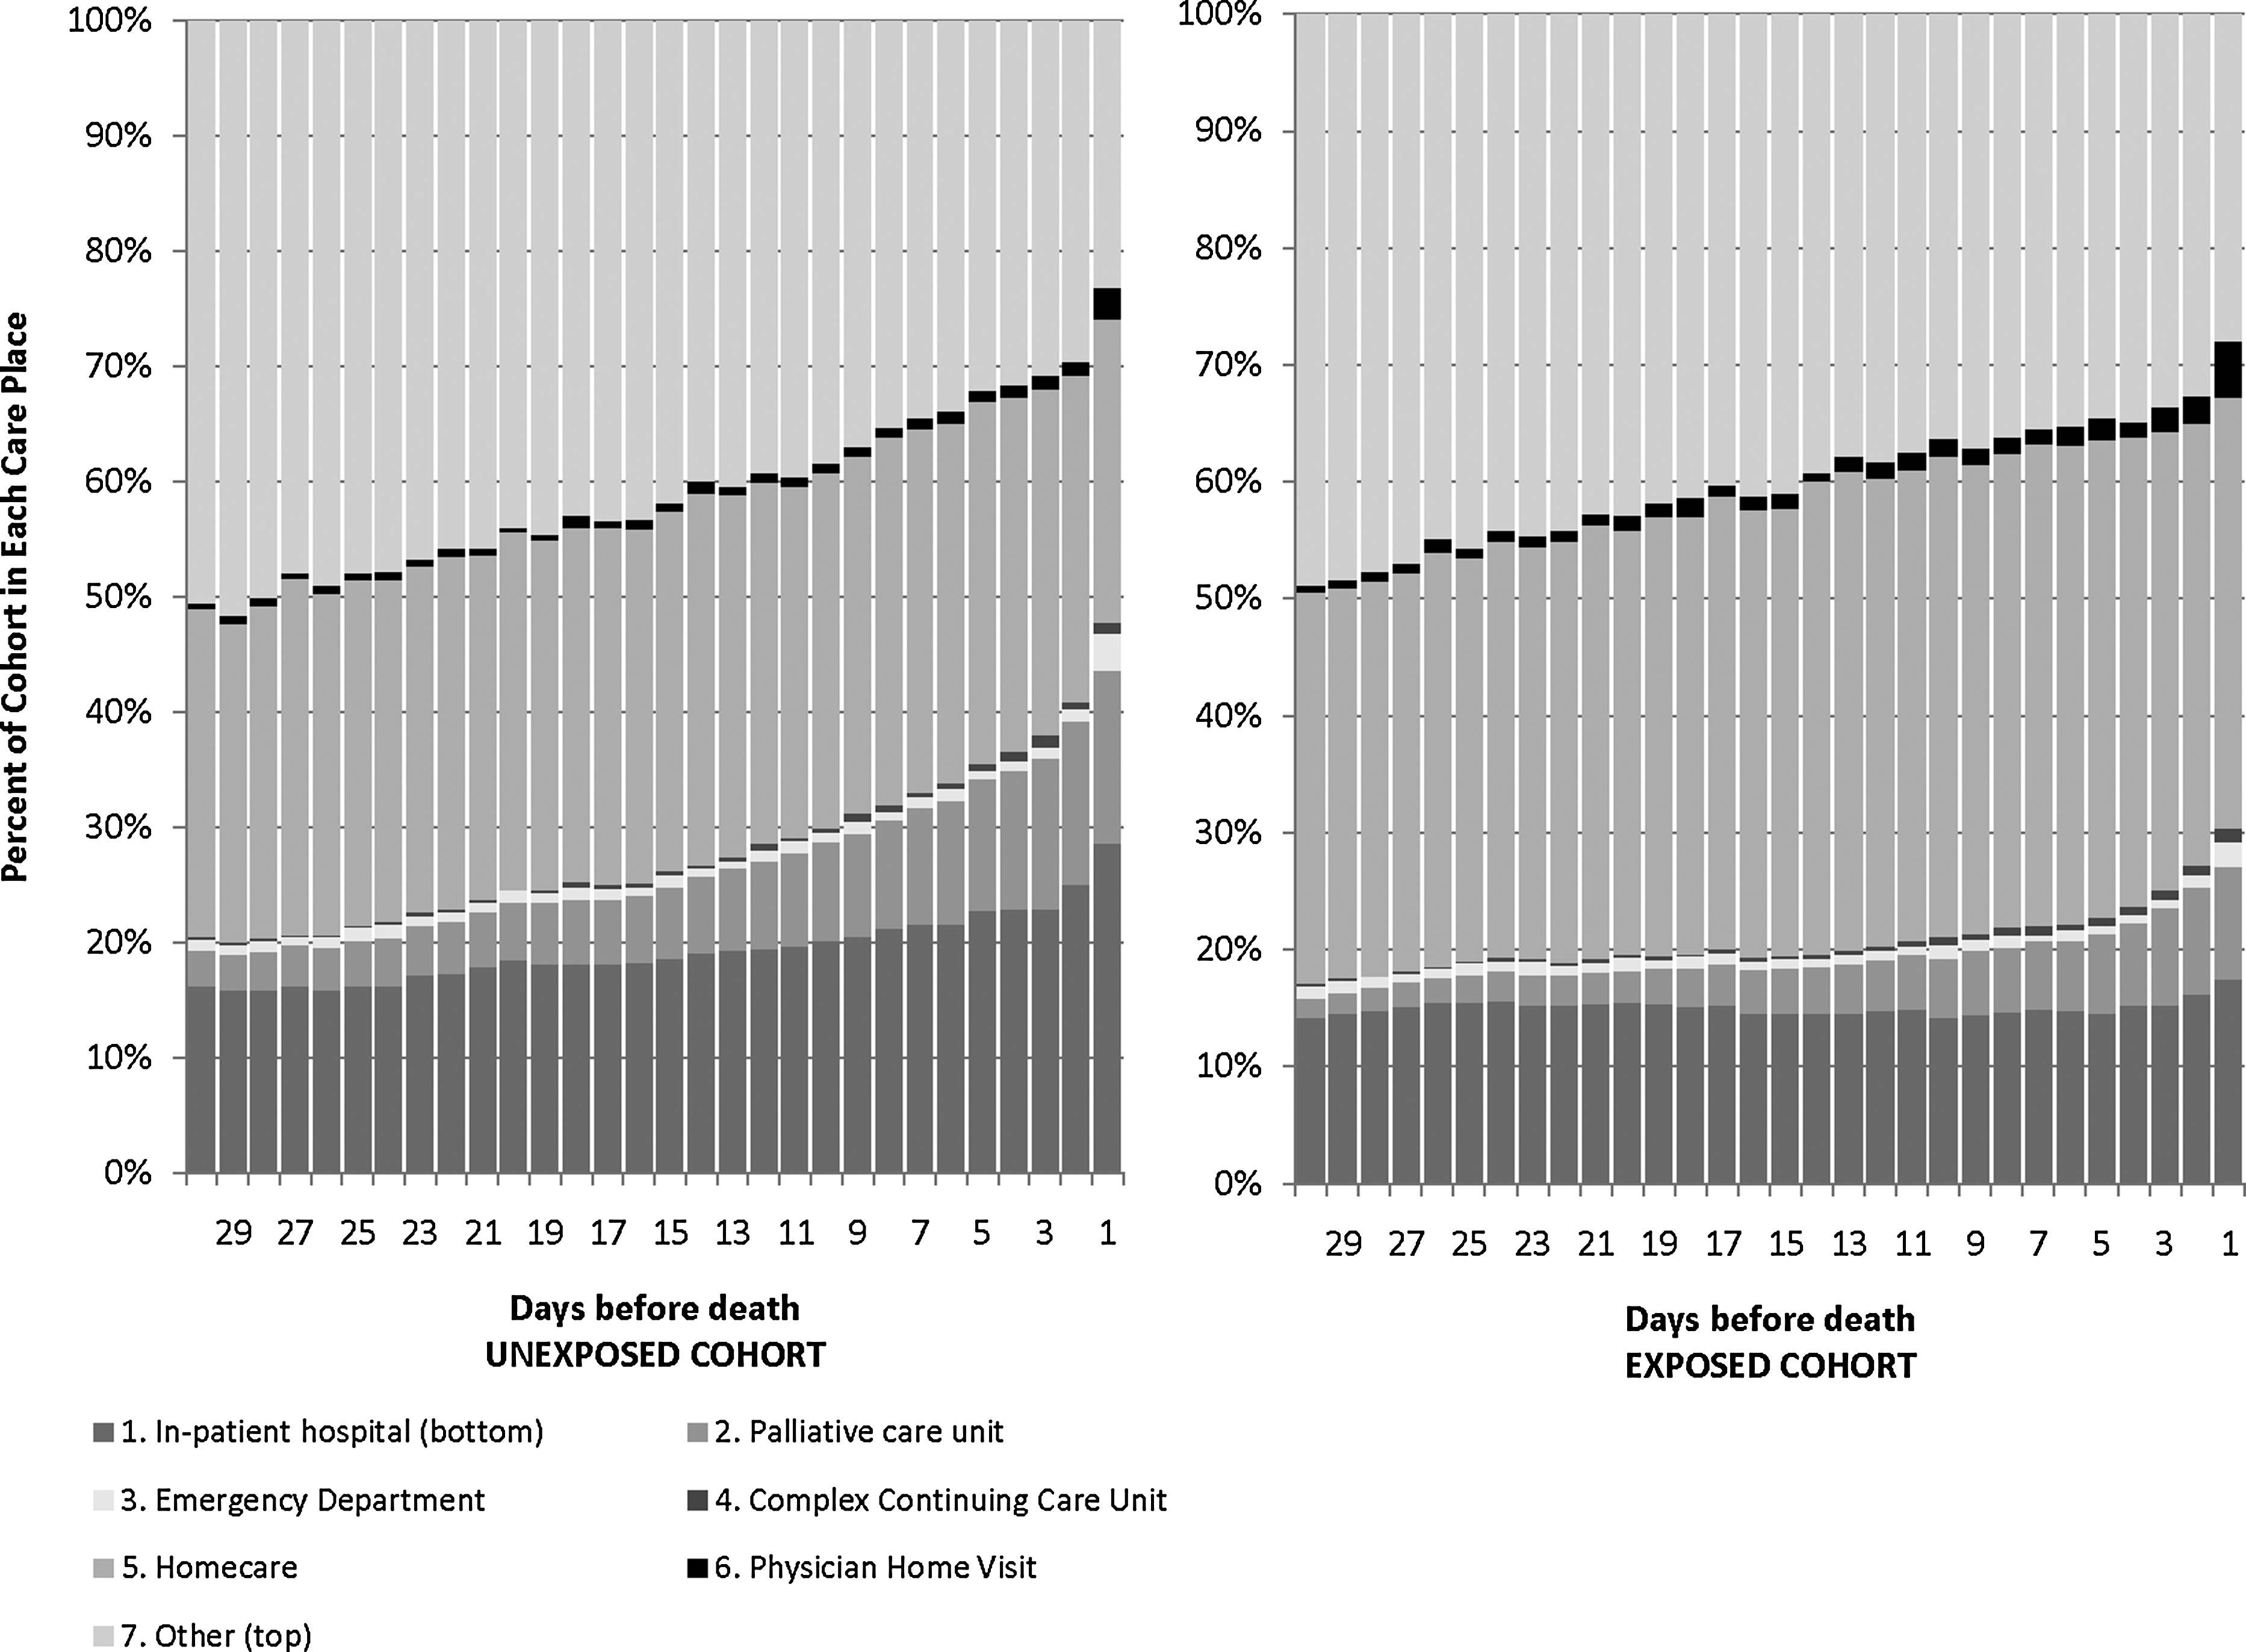
Comparing Place of Care in Last Month of Life Between Patients Exposed and Unexposed to Specialist Palliative Care Intervention.
The above trends were significant as confirmed by our linear trend (slope of the proportions over time) statistical analysis over time. Our analysis showed that the exposed group used significantly fewer inpatient hospital days (p < 0.001) and fewer palliative care unit days (p < 0.001) than the unexposed group. The exposed group also had significantly higher use of home care services compared to the unexposed group (p < 0.001). Moreover while use of hospital resources increased as the patient got close to death for both exposure groups, the rate of increase was lessened for the exposed group compared to the unexposed group (interaction of time and being exposed: p < 0.001). Conversely, the exposed group had a higher rate of increase in home care service use than the unexposed group (p < 0.001). There were negligible differences between the two groups in their use of the other resources interacting with time.
The secondary outcome was the average per person costs of health care services, which was significantly different (p < 0.001) (see Fig. 2). The average cost of the unexposed group was $12,362 (SD = $12,362) in total health care services in the last 30 days of life, whereas the exposed group was $10,649 (SD = $9,713), resulting in an average savings of $1,536 per exposed patient. The most significant cost changes occurred in hospital and home care. The exposed group had higher home care costs by $229 but lower hospital costs by $2,701 compared to the unexposed group.

Comparing Cumulative Health Services Costs Between Exposed and Unexposed in the Last Month of Life.
Discussion
Our study compared the place of care in the last 30 days of life between a community-based cohort exposed to a specialist palliative care team versus usual care. The data showed that our hypotheses were correct: the exposed group used fewer hospitalizations and more home care services over time, while overall costing less. These results complement existing literature on place of death and hospital and ED avoidance in the last two weeks of life by examining more services and their timing. For example, this study demonstrated that the specialist palliative care team was associated with a reduced total number of inpatient hospital days and palliative care unit days across the last 30 days of life. It also provided data on the timing of which hospitalizations occurred (e.g., a 4% increase in the proportion being admitted to hospital on the last day of life among the unexposed group), which could also help health system planners with resource allocation.
The approach to use place of care over time may be beneficial for quality improvement. It shows the use of services over time in a visual way; this can inform the reader about the transitions between multiple providers and settings, which are common during end-of-life care, at a population level. Moreover, the approach provides some information on the effect of, timing of, and relationships between various types of services used at the end of life. For instance, this study's data offers a possible explanation for the reduced hospitalizations over time: the increased home care use over time—in other words, not just that the patients were exposed to a specialist palliative care team, but that more exposed patients were receiving home care visits on more days in the last month of life. The approach can also be adapted to examine subsets of disease cohorts (e.g., cancer or heart failure patients), or the timeframe extended depending on the relevant illness trajectory. Examining place of care can be a beneficial outcome measure to understand trajectory of service use over time and can help to measure policy goals to support care for patients at home for longer periods.
Our study is limited in several ways. Our place of care analysis does not indicate whether the care delivered at those settings was high quality or satisfactory based on caregiver or patient report; it still relies on administrative data. We also were not able to control for variables such as marital status, education level, caregiver supports available, which are related to end-of-life health service use but not available in the administrative data. Moreover, the categories for place of care were mutually exclusive, thus did not account for multiple settings of care in one day. In our costing analysis, we could not account for all publicly funded costs, such as drugs, or costs borne by the family, such as private home care. Future research should examine the places of care across a large population over time or the number of transitions between settings. It should also explore the collection of preferred place of care and patient reported outcomes about quality of care.
In conclusion, this study demonstrates that measuring and reporting place of care is feasible and informative, and builds on the literature on place of death and dichotomous outcomes of acute care use in the last two weeks of life. In our study comparing two groups, exposed to specialist palliative care teams and unexposed (usual care), we found that the exposed were associated with using less hospitalizations and more home care over time. By examining the last month of life, we are providing detailed data about the patient end-of-life service use trajectory, which can support quality improvement activities.
Footnotes
Author Disclosure Statement
No competing financial interests exist.
Acknowledgments
This study was funded by a grant from the Canadian Institutes of Health Research (No. 115112) and used databases maintained by the Institute for Clinical Evaluative Sciences, which receives funding from the Ontario Ministry of Health and Long term Care. The opinions, results, and conclusions reported in this paper are those of the authors and are independent from the funding sources.