
Abstract
Abstract
Background:
It is unknown how the prevalence of hospitals with palliative care programs (PCPs) at the state level in the United States correlates with the treatment of critically ill patients.
Objective:
We examined the relationship between state-level PCP prevalence and commonly used treatments for critically ill patients as well as other public health metrics.
Methods:
We compiled state-level data for the year 2011 from multiple published sources. These included the poverty rate from the U.S. Census, public health measures such as the number of primary care physicians per 100,000 persons from America's Health Ranking website, and state-level rates for a series of validated ICD-9 (International Classification of Diseases, 9th Revision) procedure codes used for critically ill patients (e.g., prolonged acute mechanical ventilation [PAMV]) from the State Inpatient Databases (SID), Healthcare Cost and Utilization Project (HCUP), and Agency for Healthcare Research and Quality. State-level percentages of PCPs came from a published report by the Center to Advance Palliative Care (CAPC). We used the Kruskal-Wallis test and Pearson's correlation coefficient for statistical inference.
Results:
State-level poverty rates were negatively correlated with the percent of hospitals with PCPs: r = −0.39, p = 0.005. States with more hospital-based PCPs had significantly lower rates of PAMV, tracheostomies, and hemodialysis but higher rates of nutritional support than states with fewer PCPs.
Conclusions:
States with more poverty and/or at high risk for delivering inefficient health care had fewer hospital PCPs. Hospital-based PCPs may influence the frequency of some interventions for critically ill patients.
Introduction
P
However, palliative care is still underutilized. Its use varies by geographic region for reasons that have not been fully studied. The Center to Advance Palliative Care (CAPC) and the National Palliative Care Research Center (NPCRC) produced a landmark collaborative study in 2011 that examined the number of PCPs at the hospital for hospitals with 50 or more beds for each state (and the District of Columbia) in the United States. The authors gave each state a letter grade of A through F, with As for the top performers (>80% of hospitals with PCPs) and Fs for states where less than 20% of hospitals had PCPs.8,9 Although the authors did note that there were geographic disparities in palliative care access and that public and sole community provider hospitals tended to have fewer PCPs, they did not examine how palliative care access related to poverty and other disparity measures. 8
Goldsmith and colleagues examined national data from 2006 on palliative care access in the hospital setting. 7 They found that greater access to hospital palliative care at the state level was correlated to several key measures of health care utilization such as lower Medicare hospital death rates, fewer intensive care unit (ICU)/critical care unit (CCU) admissions per 1000 decedents in the last 6 months of life, and lower overall Medicare spending per enrollee. 7 Similarly, Grant and co-workers concluded that patients in states with more palliative care access were less likely to die in a hospital and had fewer ICU admissions during the last 6 months of life based on findings from the 2008 CAPC State-by-State Report Card. 10 However, there does not appear to be a study that examines how more detailed socio-economic measures and the rates of established interventions for critically ill patients (e.g., mechanical ventilation) correlate with the percent of hospitals with PCPs at the state level. Our study fills this gap in the literature.
Methods
Data sources
This study uses data from multiple sources. Data on the prevalence of hospital-based PCPs at the state level were taken from Morrison and colleagues. 8 These published results are used for the CAPC 2011 Report Card, although they reflect the American Hospital Association Annual Survey Database for the fiscal year of 2009. We obtained the 2011 U.S. poverty rate at the state level from the U.S. Census Bureau. 11 We used three public health measures taken from America's Health Rankings (AHR) online website (www.americashealthrankings.org) and from a private communication of 2011 data from this organization to us on March 3, 2014. The AHR is a collaborative effort of the United Health Foundation (www.unitedhealthfoundation.org), the American Public Health Association (www.apha.org), and Partnership for Prevention (www.prevent.org). It is funded entirely by the United Health Foundation, a recognized 501(c)(3) organization, and more details can be found on its website. 12
The three public health variables for each state from AHR were: Low Health Status, Preventable Hospitalizations, and Number of Primary Care Physicians. Low Health Status is the percentage of adults who say their general health is fair or poor. This measure serves as a proxy for chronic comorbidities within each state. AHR compiles these data from a surveillance system run by the Centers for Disease Control and Prevention. Preventable Hospitalizations is a measure of the discharge rate of Medicare enrollees aged 65 to 99 years with full Part A entitlement and no health maintenance organization (HMO) enrollment from hospitals for ambulatory care sensitive conditions. These conditions are best treated in an outpatient setting and are thus deemed “preventable.” 13 Therefore, it is a quantitative measure of health care inefficiency. Number of Primary Care Physicians measures access to primary care for the general population and is defined as the number of primary care physicians (i.e., those who identify themselves as family practice physicians, general practitioners, internists, pediatricians, obstetricians, or gynecologists) per 100,000 persons. We chose this measure as limited access to a family physician makes it more likely a sick person is not treated in a timely manner, which is another measure of inefficient care.
Finally, we created state-level measures of how intensively patients were treated. Barnato and associates developed and validated a series of ICD-9 procedure codes that represent common “life-sustaining” treatments typically given to critically ill patients. These include intubation and mechanical ventilation, tracheostomy, hemodialysis, enteral or parenteral nutritional support, gastrostomy tube insertion, and cardiopulmonary resuscitation (CPR). 14 Using these procedure codes and the codes for diagnostic radiology procedures (a resource use measure; ICD-9 code 87.x), we extracted these discharge data from the State Inpatient Databases (SID), Healthcare Cost and Utilization Project (HCUP), Agency for Healthcare Research and Quality (AHRQ). This is a publically available online database from the AHRQ HCUP. 15 We used data from the years 2007 and 2011. The HCUP SID has state-level data for 35 states for the year 2011, and there were 32 states that had data for both 2007 and 2011. For each state, we collected information for each treatment variable as a rate of discharge per 100,000 persons and analyzed this 2011 rate and the percent change in the rate from 2007. The database is online (www.hcupnet.ahrq.gov) and its use has been exempt from institutional review board (IRB) approval as it is registry data aggregated at the state level. No human subjects were enrolled specifically in this study, and the study was exempt from regulations guiding the protection of human subjects because it is a secondary analysis of publicly available aggregated data at the state level or data from peer-reviewed publications.
Statistical methods
We quantified the correlation between the poverty rate and the percentage of hospitals with PCPs at the state level via Pearson's correlation coefficient. States at high risk for delivering inefficient health care would have a population that has more acute and chronic conditions and limited access to health care professionals. To identify these states, we flagged those with above median levels of poverty, low health status, and preventable hospitalizations and below median levels of primary care physicians and examined their hospital level of palliative care access.
Next, we stratified the states into three groups by prevalence of hospital-based PCPs at the state level: (>80%, 61% to 80%, ≤60%). We used the Kruskal-Wallis test to compare the prevalence of the life-sustaining treatments for 2011 and for changes from 2007 levels to 2011 by these three groups. We also used the Kruskal-Wallis test to compare median prevalence rates by high-risk versus non-high-risk states for 2011. We used Pearson's correlation coefficient to quantify the relationship between the prevalence of hospital-based PCPs and the treatment variables. P values <0.05 were considered statistically significant. Analyses were done using Stata/MP 13.1 for Windows (StataCorp., College Station, TX).
Results
Figure 1 shows that poverty was negatively correlated with hospital-based PCPs at the state level: r = −0.39, p = 0.005. This indicates states with more impoverished citizens were less likely to have hospitals with PCPs. We then examined the correlations between the percentage of hospital-based PCPs and: Low Health Status (r = −0.52, p < 0.001), Preventable Hospitalizations (r = −0.35, p = 0.012), and Number of Primary Care Physicians (r = 0.55, p < 0.001). Hence, states with sicker populations and more preventable hospitalizations also had fewer hospital-based PCPs.
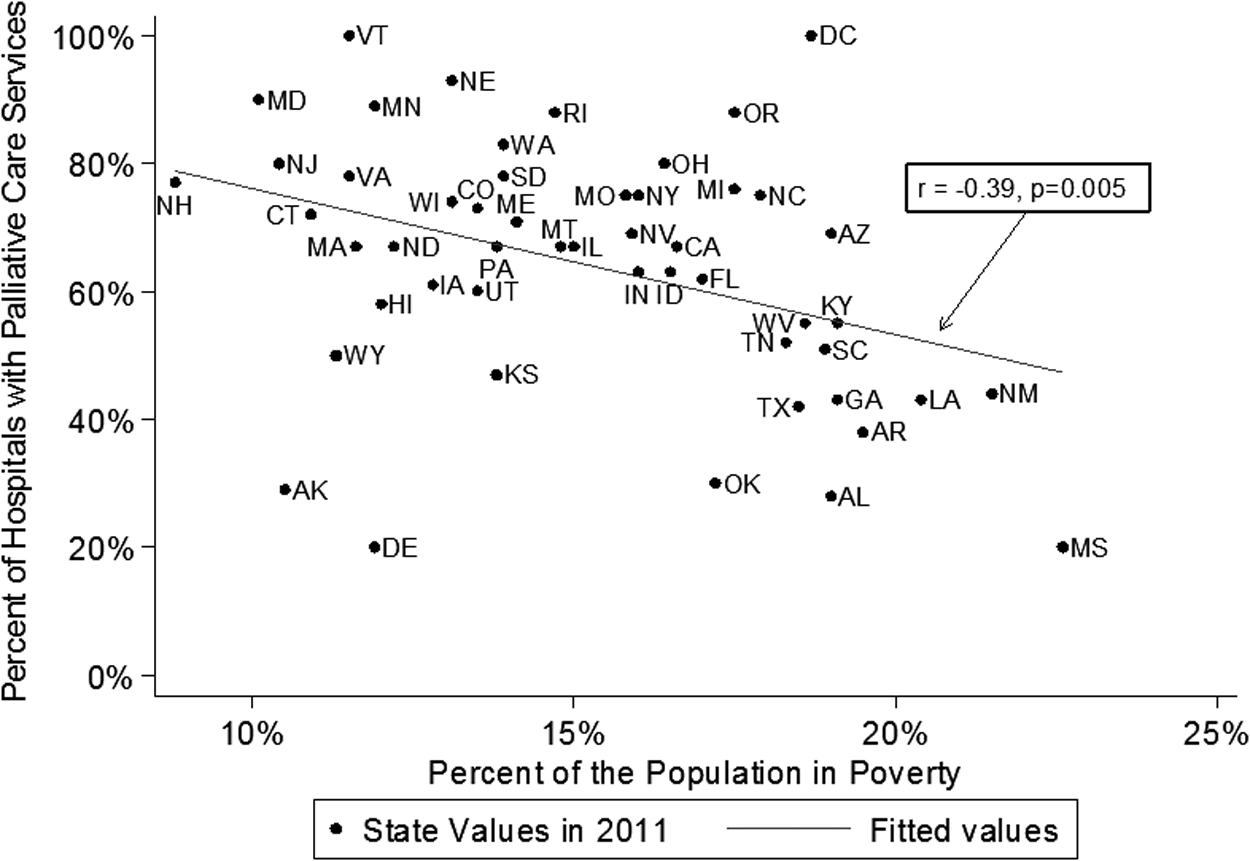
The correlation between poverty and the percent of hospitals with palliative care programs in 2011. States with higher poverty rates in 2011 had fewer hospitals with palliative care programs.
We found 11 of the 50 states and the District of Columbia (n = 51) met our definition of “high risk” for inefficient delivery of health care. Three of the states (Florida, Indiana, and Missouri) had PCPs at more than 60% of their hospitals. This level was given a grade of “B” by Morrison and co-workers. 8 The other 8 states had less than 60% of their hospitals with palliative care access, and only 4 would be deemed a “C” by Morrison and colleagues: Georgia, Kentucky, Texas, and West Virginia (see Fig. 2). The grading distribution was significantly lower than the non-high-risk states (p = 0.009). We note that almost all of these states are in the South.
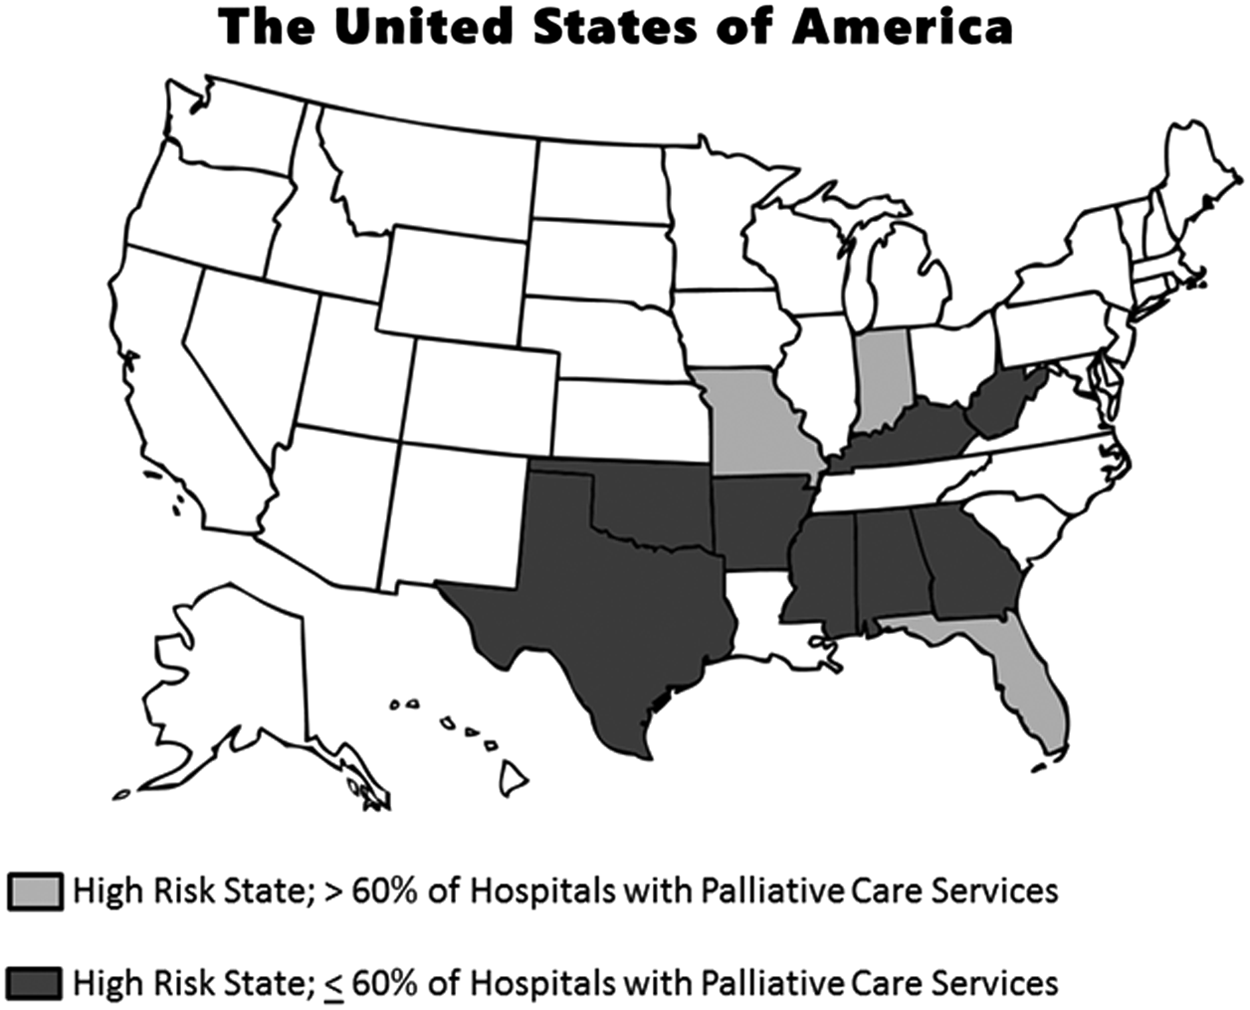
States at high risk in 2011for delivering inefficient health care and their percentage of hospitals with palliative care services. States defined as “high risk” were clustered in the South and tended to have fewer hospital-based palliative care programs.
Table 1 and Table 2 show how common life-sustaining procedures or diagnostic radiology procedures varied by palliative care access at the hospital level. Table 1 presents the median rate of discharges per 100,000 persons in 2011, whereas Table 2 presents the percent change in these rates from 2007 to 2011. Table 1 shows that states with 80% or more of their hospitals offering PCPs provided significantly less prolonged acute mechanical ventilation (PAMV), tracheostomies, and hemodialysis than states whose hospitals had fewer PCPs. Conversely, these states offered significantly more enteral nutritional (EN) and/or total parenteral nutritional (TPN) support. For example, the median observed rate of tracheostomies per 100,000 persons was 19.7 for states with 80% or more hospitals with palliative care services, but it was approximately 36 per 100,000 in the other two categories; p = 0.025. Table 2 shows that whereas tracheostomy use decreased in each group over time (–3.5%, −5.8%, and −11.7%, respectively; p = 0.022) significant differences were observed when stratified by palliative care access (see Fig. 3). A secondary analysis compared the procedures in Table 1 by high-risk versus non-high-risk states. The high-risk states had significantly higher median rates of discharge in all the procedures except enteral or parenteral nutrition, CPR, and diagnostic radiology procedures.

Trends in tracheostomies stratified by palliative care programs at the state level. There were fewer tracheostomies performed over time in states that had the most hospital-based palliative care programs.
The data come from all states except Alabama, Alaska, Connecticut, Delaware, District of Columbia, Georgie, Idaho, Louisiana, Mississippi, Montana, New Hampshire, North Dakota, Ohio, Pennsylvania, South Dakota, and Virginia. P values in boldface are <0.05.
These results include all states except Alabama, Alaska, Connecticut, Delaware, District of Columbia, Georgia, Idaho, Illinois, Indiana, Louisiana, Mississippi, Montana, New Hampshire, New Mexico, North Dakota, Ohio, Pennsylvania, South Dakota, and Virginia. P values in boldface are <0.05.
The correlation analysis examined palliative care access as a continuous variable rather than a categorical one. In this analysis, we observed significantly greater use of enteral and/or parental nutrition support with PCP prevalence in 2011 (r = 0.46, p = 0.006). Examining the 5-year change from 2007 to 2011, we found there was a negative correlation with PCP prevalence and tracheostomy procedures (–0.46, p = 0.008). Otherwise, we observed no significant correlation with palliative care levels and the other treatment variables' change over time.
Discussion
In a national analysis at the state level, we found a significant correlation between higher poverty levels and fewer PCPs at the hospital level. Similar correlations were observed in the states when examining Low Health Status and Preventable Hospitalizations. Moreover, we identified states at high risk for delivering inefficient health care to their citizens, and these states tended to have fewer hospitals with PCPs. These “high-risk” states clustered in the South and tended to use more life-sustaining therapies in their hospitalized patients.
We observed that states with more PCPs at the hospital level used life-sustaining therapies associated with the ICU differently. In the states with the most PCPs at the hospital level, we observed less PAMV, fewer tracheostomies, and less dialysis, but more nutritional support. Because correlation does not prove causation, we cannot say that the PCPs caused a change in treatment practice. Instead, our results only show that these trends were present. Likewise, when a non-significant result was observed, we cannot conclude PCPs at the state level had no effect on the use of these treatments, only that the effect (if present) was too small to detect given our sample size or confounded by other variables. However, we do feel that our results have face validity.
Palliative care in the ICU is an ongoing challenge. Some hospitals use a “trigger” approach for palliative care consults in the ICU where certain clinical criteria prompt a consultation. Typical triggers include having an ICU patient over age 80, prolonged organ supportive therapy, a referral for tracheotomy or gastrostomy, or a decision to forgo life-sustaining therapy such as hemodialysis in the presence of chronic renal failure.16–18 Hua and associates estimated that approximately one in seven ICU admissions in the United States would have at least one of a limited set of palliative care triggers. 19
Our results on tracheostomies and PAMV are noteworthy. We observed fewer tracheostomies and less PAMV in states with the most hospital-based palliative care services. Palliative care consults for critically ill patients often deal with decisions on when to stop mechanical ventilation. How we manage patients who require mechanical ventilation is an important public health issue because the number of patients with PAMV is expected to double by 2020, and these patients are disproportionately resource intensive and have poor long-term outcomes.20,21 Tracheostomy usage also declined significantly over time when stratified by the percent of hospitals with hospital-based palliative care.
Nutritional support as a palliative care tool is both complex and controversial.22,23 We observed more EN and/or TPN in the states with the most hospital-based PCPs. Intuitively, we would have guessed a priori that patients receiving palliative care would more likely forego TPN but possibly be more likely to receive EN. Our analysis groups both nutritional support methods together by definition and so we cannot distinguish the two, and our results may also be affected by differences in coding for nutritional support at the state level. Nevertheless, it is intriguing to see that nutritional support did vary among the states grouped by palliative care access and the correlation between nutritional support and palliative care access was significant: r = 0.46, p = 0.006. This raises the question of whether the nutritional needs of seriously ill hospitalized patients are being met consistently across the country.
We note that because our study focuses on state-level rather than patient-level data, we cannot tell who received nutritional support with or without a palliative care consult. It is possible that a patient-level analysis would show a different relationship between nutritional support (and the other procedures) and palliative care. We also acknowledge that our results are unadjusted. A wide variety of confounding variables influence how patients are treated in the ICU, beyond the influence of palliative care consultations, and patient acuity in the ICU varies as well. Only a detailed multi-variable analysis at the patient level can definitively quantify how palliative care affects care given in the ICU.
We further note that PCPs at the hospital level may not affect critical care delivery in a uniform manner, which may be influencing which procedures were significantly different in Table 1. For example, palliative care consults may affect the use of dialysis more than intubation or CPR. Because CPR and mechanical ventilation are given to patients who require immediate action, doctors always perform these procedures unless there is specific documentation that they should not be done. In contrast, dialysis usually does not require immediate initiation and so it is common to wait until informed consent is obtained, which allows time for a family discussion and a possible palliative care consult.
Finally, we note that our identification of “high-risk” states tended to overlap the region of the country known as the “stroke belt.” It has been shown that age, race, socio-economic status, and disease burden are significant factors for increasing the risk for strokes (and other conditions such as chronic kidney disease and heart failure), which in turn explains why these conditions are higher in the South.24–26 Although this gives face validity to our methodology, it also raises a subtle but important concept of risk-adjustment. Namely, even if all states had a similarly high percentage of hospitals with PCPs, geographic differences in the rates of critical care procedures will likely remain as the risk for requiring life-sustaining therapies varies by region.
We appear to be one of the first studies to systematically relate poverty, public health measures, and intensity of treatment to the prevalence of hospital-based palliative care services at the state level. 27 This macroscopic analysis gives the medical community a “big picture” snap-shot of how critical care delivery varies by the state-level prevalence of palliative care. Future studies could expand upon our methodology to examine the inter-hospital variation in the delivery of palliative care in hospitals within the same state.27–30 This will be important as more states mandate PCPs in all hospitals with 50 or more beds. It would also be very informative to examine how critical care delivery varies at the patient level in hospitals with and without PCPs.
Conclusions
We observed that states with higher poverty rates were less likely to have hospitals with palliative care services. We also observed that states at a high risk for delivering inefficient health care were less likely to have hospitals with palliative care services. Hospital-based palliative care services were correlated with differences in life-sustaining care. The states with the most hospitals with palliative care services had fewer patients on prolonged mechanical ventilation, fewer tracheostomies, less hemodialysis, and more nutritional support. Our study is not designed to show a causal relationship between the presence of palliative care services at the hospital level and differences in treatment patterns among critically ill patients. However, our results suggest that palliative care at the hospital level may influence how critical care is delivered in the United States.
Footnotes
Acknowledgments
We would like to thank Omer Usanmuz and Tyler Loggins for their assistance with data collection for this manuscript.
Author Disclosure Statement
No competing financial interests exist.