
Abstract
Abstract
Background:
Web-based applications are available for prognostication of individual patients. These prognostic models were developed for groups of patients. No one is the average patient, and using these calculators to inform individual patients could provide misleading results.
Objective:
This article gives an example of paradoxical results that may emerge when indices used for prognosis of the average person are used for care of an individual patient.
Methods:
We calculated the expected mortality risks of stomach cancer and its associated comorbidities. Mortality risks were calculated using data from 140,699 Veterans Administration nursing home residents.
Results:
On average, a patient with hypertension has a higher risk of mortality than one without hypertension. Surprisingly, among patients with lung cancer, hypertension is protective and reduces risk of mortality. This paradoxical result is explained by how group-level, average prognosis could mislead individual patients. In particular, average prognosis of lung cancer patients reflects the impact of various comorbidities that co-occur in lung cancer patients. The presence of hypertension, a relatively mild comorbidity of lung cancer, indicates that more serious comorbidities have not occurred. It is not that hypertension is protective; it is the absence of more serious comorbidities that is protective. The article shows how the presence of these anomalies can be checked through the mathematical concept of preferential risk independence.
Conclusion:
Instead of reporting average risk scores, web-based calculators may improve accuracy of predictions by reporting the unconfounded risks.
Introduction
W
Web calculators also report survival risks in different settings of care including community-based and intuitional settings.5–8 Indices developed by Mazzaglia, 9 Gagne, 10 Carey,11,12 Lee, 8 Schonberg, 13 Porock,14,15 Mitchell, 16 Flacker,17,18 Levine, 19 Walter,20,21 Di Bari, 22 Inouye, 23 Pilotto,24,25 Teno, 26 Dramé, 27 and Fischer 28 provide survival estimates for a variety of diagnoses and specific patient populations using clinical data. In addition to the clinical scales, a number of investigators have developed prognostic indices from patients' medical history within electronic health records. These include efforts led by Charlson, 29 Deyo, 30 Romano, 31 Manitoba, 32 D'Hoores, 33 Elixhauser, 34 and van Walraven. 35 Because of the importance of prognosis in management of patient care and in research, repeated efforts have been made to refine these methods and estimates.
Despite widespread efforts to create web-based calculators, a fundamental limitation exists in these efforts. Most prognostic indices were developed to describe survival of the average person but are being used to report survival of an individual. Since everyone differs from the average person by some feature, these statistical models may be misleading, when applied to care of individuals. The best decision for an average patient is likely to be different from the best advice to an individual patient.36,37 Statisticians often describe this phenomenon in terms of pooled estimation across different subgroups and subgroup (stratified) analysis. One way to personalize data is to divide the data into strata; then if the patient matches a specific stratum, the estimate for that stratum is the most appropriate for the patient. The cross-strata average is not a good estimate. Still another way to personalize data is to create models with numerous interacting variables and to evaluate the models at the patient's profile. None of the web calculators reviewed earlier examined interactions among their variables or conducted subgroup (stratified) analysis, and, therefore, the use of these models to guide care of an individual patient may be suspect. Statisticians warn against the use of these models to guide individuals, but such use continues.38–48
Many examples can be provided where patient characteristics interact. For example, in diabetes, 49 arthritis, 50 cardiovascular illness, 51 mental health, 52 and cancer, 53 comorbidities interact to change a patient's prognosis. Age and comorbidities also interact. 54 These interactions are well known in the literature but absent in prognostic calculators. At the group level, it may not matter, as the averages reflect the influence of interacting comorbidities; for some patients in the group, we may under-estimate the prognosis; for others, we may over-estimate; and for the remaining, we may still be accurate.55–66 For one person, however, prognosis can vary several fold based on their comorbidities, and ignoring interactions could mislead the patient. The purpose of this brief article is to highlight, by way of an example, how the result of these websites could be misleading.
Paradoxical results: Diseases that are good for you?
The failure to adequately examine combinations of features could lead to paradoxical advice from web-based calculators: The calculator may report that having an illness could improve prognosis. Sometimes this is possible; for example, having chicken pox in childhood may create immunity to this illness later. In general, however, one expects that the majority of illnesses make prognosis at least tangibly worse, rarely better. The fact that many illnesses can be found that would increase longevity seems prima facie wrong. Furthermore, if an illness sometimes increases risk and at other times decreases risk, we have a paradox. In mathematics, this situation is referred to as the violation of preferential risk independence.67,68
To understand preferential independence, imagine two people, one well and another with an illness, let us say hypertension. The hypertensive patient has a higher risk of mortality than the well patient. So far, the comparison makes sense. The preferential independence is violated when adding an identical diagnosis, for example, stomach cancer, to both the normal and hypertensive patients reverses the risk preference (see Fig. 1). Hypertension increases the risk when it occurs by itself, and it decreases the risk when it occurs among patients with stomach cancer. This contradicts our expectation that diseases adversely affect prognosis. Keeney and Raifa 67 have also shown that if the principle of preferential risk independence does not hold, no statistical model can preserve the reversal of risk preference. In other words, there is no mathematical function that can score hypertension and stomach cancer so that adding the same diagnosis (stomach cancer) changes hypertension from a risk to a protective factor.
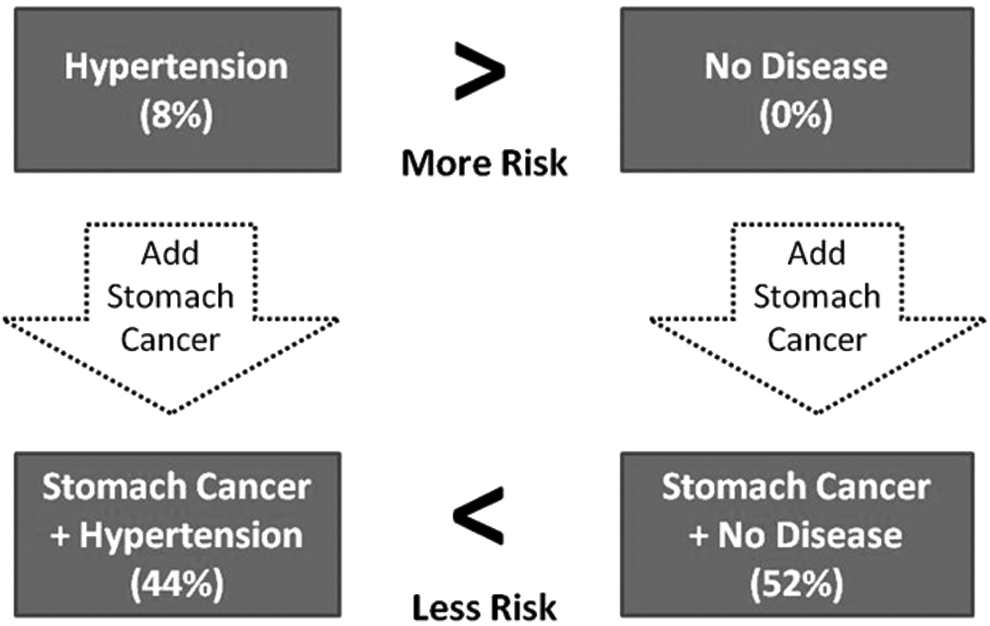
Violation of Preferential Independence. Values in parentheses are average risk of mortality in six months for veterans residing in nursing homes.
The concept of preferential risk independence is closely related to Simpson's paradox, which has been shown in numerous settings.69–77 In Simpson's paradox, the impact of a variable is reversed when it is examined in the subgroup as opposed to overall patients. Similar to Simpson's paradox, preferential risk independence reports reversal of impact of a variable, but now in two different subgroups.
In this article, we provide data that confirm violation of preferential independence and the counter-intuitive results produced when average risk is used to guide prognostic calculators. At the end of this article, we provide alternative ways of resolving these contradictions.
Source of data
Data were obtained for 140,699 nursing home residents from electronic health records of veterans across 126 medical centers through the Veterans Administration Informatics and Computing Infrastructure (VINCI). These data included all hospital diagnosis from 2003 to 2012. All-cause probability of mortality was calculated as the percentage of residents who survived six months after date of the diagnosis. In a separate paper, we have reported the use of these data to predict prognosis of nursing home patients. 78 A naïve Bayes model was used to predict prognosis of patients. Similar to other indices in the literature, this model does not account for interactions among the diagnoses. It works for the average person, but later we show that its use for an individual patient can create confusing and contradictory results.
Violation of Preferential Risk Independence
We provide an example to illustrate the violation of preferential independence. Consider the probability of mortality among patients who have stomach cancer (i.e., Malignant Neoplasm of Stomach Cardia, code 151.0 in International Classification of Disease Version 9). On average, the probability of six-month mortality is 0.52 and is shown as a dashed line in Figure 2. This is the pooled estimate across various subgroups. Among veterans in nursing homes, stomach cancer occurs with several different comorbidities, each of which defines a new subgroup. The comorbidities that occurred more than 250 times in our sample of data are provided in Figure 2. These comorbidities are listed in order of average probability of mortality on the X-axis, starting with “hypertension” and ending with “palliative consult.” The dark solid line shows the probability of mortality of patients who have both stomach cancer and the comorbidity. The gray solid line shows the probability of mortality for patients who have only the comorbidities. In our cohort of nursing home residents, hypertension, by itself, increased risk of mortality by 8%. However, the probability of mortality for hypertensive patients who had stomach cancer was 0.44, which was fully 8% lower than the probability of mortality for patients who had stomach cancer: 0.52. Paradoxically, hypertension increased the risk of a normal patient but reduced the risk of a patient with stomach cancer. This is an example of violation of preferential independence. Clinicians and patients may find it counter-intuitive that adding “hypertension” to a patient who has “stomach cancer” would reduce the average mortality rate.

Average Mortality from Stomach Cancer and Frequent Comorbidities. Comorbidity Code and Description: Description of comorbidity codes: 1, hypertension NOS; 2, hyperlipidemia NEC/NOS; 3, diabetes mellitus without complication not stated as uncontrolled; 4, esophageal reflux; 5, depressive disorder NEC; 6, coronary atherosclerosis of native coronary artery; 7, coronary atherosclerosis of unspecified type of vessel; 8, chronic airway obstruction NEC; 9, benign hypertrophy of prostate without urinary obstruction; 10, history tobacco use; 11, iron deficiency anemia NOS; 12, congestive heart failure unspecified; 13, hypopotassemia; 14, atrial fibrillation; 15, anemia NOS; 16, esophageal stricture; 17, urinary tract infection NOS; 18, dehydration; 19, encounter for chemotherapy; 20, antineoplastic chemotherapy encounter; 21, pneumonia organism NOS; 22, acute renal failure NOS; 23, pleural effusion NOS; 24, dysphagia NOS; 25, dysphagia; 26, radiotherapy encounter; 27, malignant neoplasm of intra-abdominal lymph nodes; 28, protein-calorie malnutrition NOS; 29, secondary malignant neoplasm of lung; 30, secondary malignant neoplasm liver; and 31, palliative care encounter. NOS stands for not otherwise specified. NEC stands for not elsewhere classified.
Discussion
The data reviewed in this article show the paradoxical results where hypertension increases the risk of mortality for normal patients but decreases the risk of mortality for patients with stomach cancer. The pooled estimate across different comorbidities reflects the influence of serious (#30 liver cancer) and less serious (#1 Hypertension NOS) diseases. These estimates are an average. If the patient has less serious disease, the average is too high. If the patient has more serious disease, the average is too low. Since on discharge from hospitals, the 5 most serious diseases are listed, the inclusion of hypertension, a relatively benign comorbidity, signals the absence of more serious diseases. It is not surprising that hypertension appears to reduce the average probability of dying from stomach cancer.
To avoid these types of counter-intuitive situations where comorbidities reduce risk of mortality, we could rely on measurement of the probability (or risk) of stomach cancer and mortality, without any other comorbidities. Note that this is not the same as the average probability of stomach cancer, which reflects the influence of various comorbidities of stomach cancer. In Figure 2, the unconfounded impact of “stomach cancer” can be obtained by averaging the additional contribution of “stomach cancer” beyond the contribution of each of its comorbidities: the difference between the dark and gray solid lines. For example, for hypertensive patients, stomach cancer adds 36% more to the mortality rate. For patients with Secondary Malignancy of Neoplasm of the Liver, stomach cancer contributes far less. In our data, the direct impact of stomach cancer ranges from 4% to 43% and on average, it is 19%. A patient with stomach cancer and no other illness has a 19% chance of mortality and not the earlier reported average risk of mortality of 52%. In this scenario, all comorbidities, including “hypertension,” add to this estimate.
If a patient or clinician asks for the prognosis of “stomach cancer” assuming no influence from any other comorbidity, the correct probability to report in our example is 19%. Web-based calculators that report the average risk should clarify that these risks include the contribution of a constellation of comorbidities, which may or may not be present in the patient at hand. To report the probability of six-month mortality from stomach cancer as 52% could be misleading for a patient who has no other comorbid conditions.
There are many ways this problem can be corrected in web-based calculators. Some investigators, for example, Elixhauser 35 have avoided this problem by scoring only severe diagnosis that increases odds of mortality. One could, for example, report the maximum risk associated with patients' various diagnoses. This approach, though simpler, still distorts the data. It may report the prognosis of patients with serious diseases correctly but would inaccurately report the prognosis of patients with a combination of serious and relatively benign comorbidities.
A second approach to addressing the confusion with a combination of serious and relatively benign diseases is to report the probability of mortality associated with the combination of the patient features. To accomplish this, web-based calculators derived from logistic regression equations would need to include all interaction terms; web-based calculators that are derived from Bayesian likelihood ratios must calculate the likelihood ratio associated with combinations of events. Given the increasing size of databases and available data, it is often feasible to calculate the probability of joint diagnoses.
Finally, we also recommend the use of propensity or other forms of matching and data balancing to remove confounding, thereby estimating the unconfounded mortality rate. Models derived in this fashion would be far more complicated, perhaps not as accurate across large groups, but certainly more valid for the patient at hand. The information provided to patients and their clinicians is personalized and different from the information provided to the average person. For web calculators to be accurate, they need to fit their data to the patient's comorbidities and reduce reliance on use of population averages. Web calculators purport to provide personalized data; however, they do not do so. They provide population averages, and, by implication, assume that these averages are the best prediction for the patient at hand.
Footnotes
Acknowledgment
This project was funded by appropriation #3620160 from VA Office of Geriatrics and Extended Care.
Author Disclosure Statement
No competing financial interests exist.
The contents of this article do not represent the views of the Department of Veterans Affairs or the United States Government.