
Abstract
Abstract
Background:
Between 69% and 82% of patients with advanced chronic illness require palliative care (PC). The NECPAL CCOMS-ICO© tool can identify these individuals. Tools to estimate survival are available, but have limited predictive ability, and therefore we sought to assess if NECPAL could improve survival prediction.
Objective:
To describe hospital mortality, survival rates, and related variables in a sample of inpatients identified with the NECPAL tool.
Design:
Cross-sectional study with longitudinal cohort follow-up. Sociodemographic and clinical data were analyzed. A predictive model (Cox regression analysis) was performed to assess survival.
Setting/Subjects:
Patients admitted to a tertiary hospital. Included patients were considered to be especially affected by their chronic condition and NECPAL+ patients (surprise question [SQ]+ plus ≥1 of the tool's other three criteria). Patients were classified into three subgroups: non-NECPAL (either SQ- or not meeting any additional NECPAL criteria); NECPAL I–II (SQ+ with one to two additional criteria); and NECPAL III (SQ+ with all three additional criteria).
Results:
Of the 602 inpatients, 236 (39.2%) were included. Of these, 49 (20.3%) died during hospitalization: 14 (13.3%) were NECPAL I–II; 34 (35.1%) were NECPAL III; and none were non-NECPAL (p < 0.001). At two years, 146 deaths (61.9%) were observed: 9 (26.5%) non-NECPAL; 57 (54.3%) NECPAL I–II; and 80 (82.5%) NECPAL III (p < 0.001). Median survival was 9.1 months. Variables associated with higher mortality were NECPAL III classification (hazard ratio [HR]: 1.75 [1.19–2.57]); in need of PC (HR: 2 [1.27–3.13]); dysphagia (HR: 1.7 [1.12–2.58] 6); cancer (HR: 3.21 [2.19–4.71]); and age >85 years (HR: 2.52 [1.46–4.35]). At six months, the NECPAL had an area under the curve (AUC) of 0.7 (95% confidence interval [CI]: 0.632–0.765), and at 24 months, the NECPAL AUC was 0.717 (95% CI: 0.650–0.785).
Conclusions:
The NECPAL CCOMS-ICO© tool can improve the prediction of mortality. The presence of all three NECPAL criteria (NECPAL III) increases the tool's predictive ability.
Introduction
A
In Great Britain, a tool called Prognostic Indicator Guidance (GSF-PIG) 3 was developed to identify individuals with PC needs. The aim of GSF-PIG is to clarify the triggers that help to identify patients who might be eligible for inclusion on a register as patients with PC needs. The GSF-PIG, together with the Supportive and Palliative Care Indicators Tool (SPICT), was used as a model for the subsequent development of the NECPAL CCOMS-ICO© tool (hereafter NECPAL). The NECPAL instrument was developed as a joint initiative of the Qualy Observatory and the World Health Organization (WHO) Collaborating Centre for Palliative Care Public Health Programs (QUALY/CCOMS-ICO) based on the experience of PIG-GSF and the SPICT, 4 which was adapted and content-validated in clinical and cultural contexts of Spain and Catalonia where the tool was developed. In addition, the contents of preexisting tools were reviewed and expanded (Fig. 1).
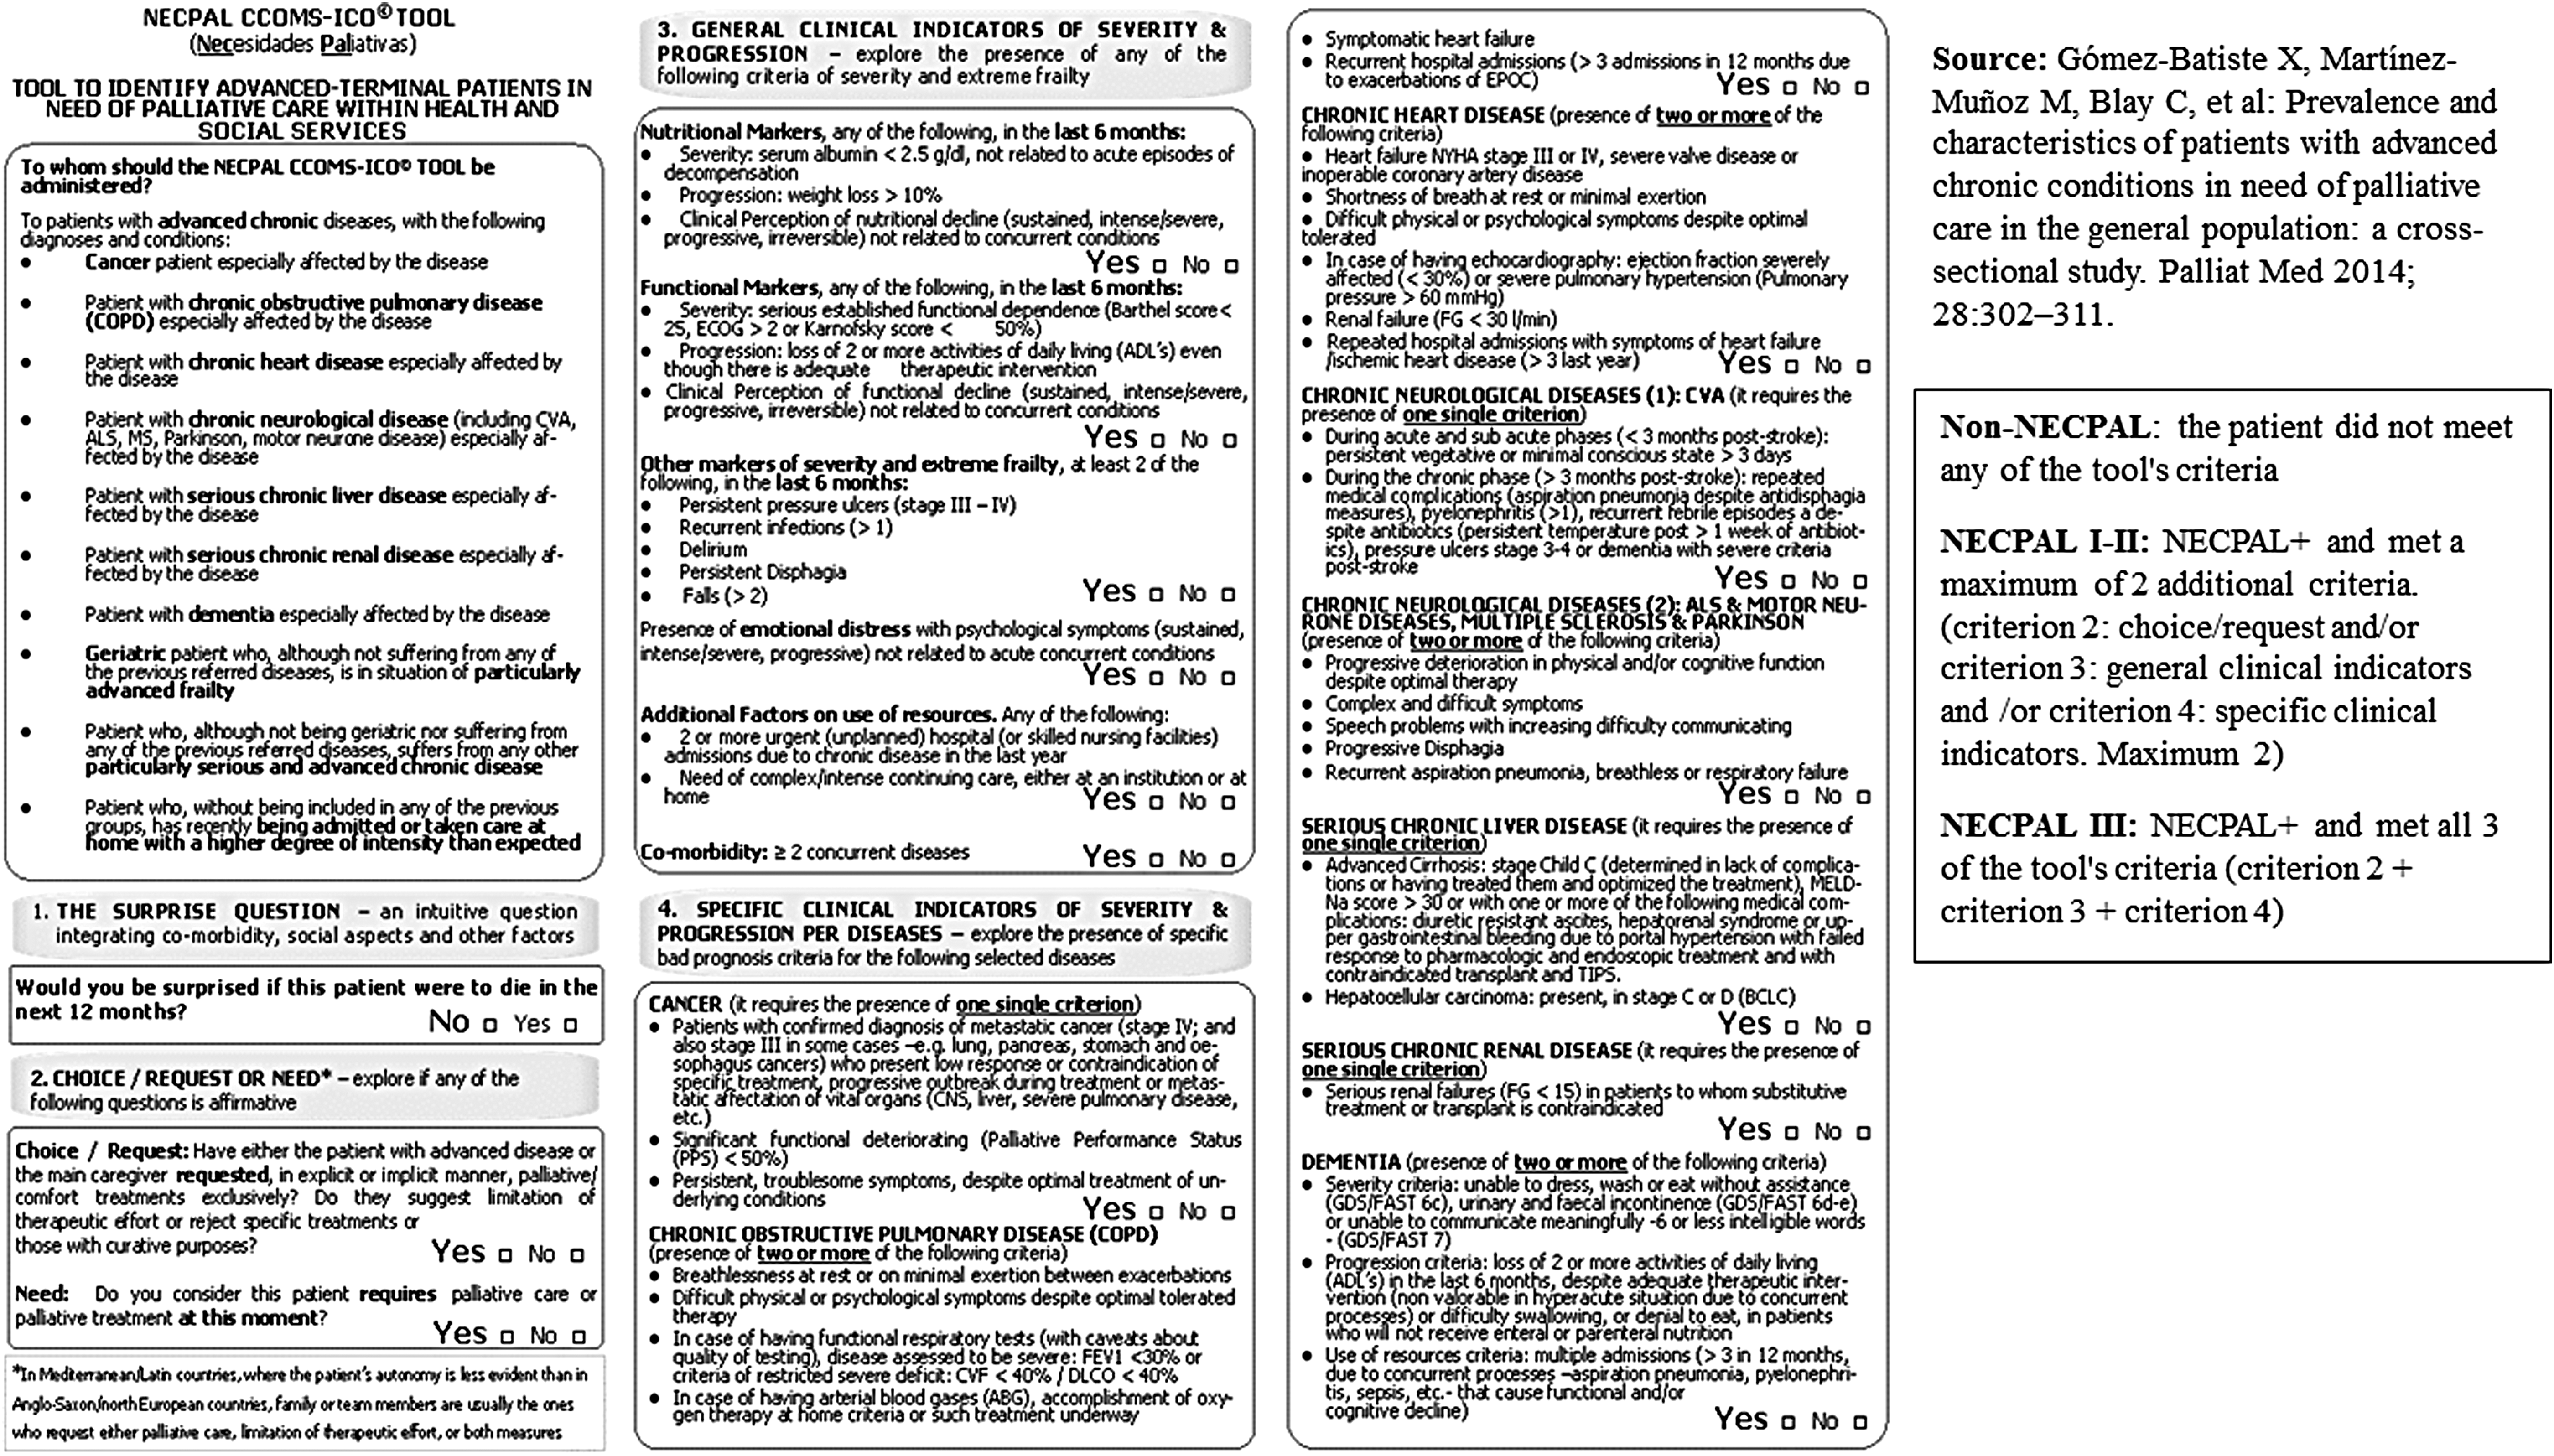
NECPAL CCOMS-ICO© tool.
The NECPAL CCOMS-ICO© is a flexible tool that provides both quantitative and qualitative evaluations. It offers a multifactorial, nondichotomous assessment process that combines subjective perception (the surprise question [SQ]: Would you be surprised if this patient dies in the next year?) with other parameters, including the request (and need) for PC, assessment of disease severity and progression, geriatric syndromes, psychosocial factors, comorbidities, and use of resources. The NECPAL CCOMS-ICO© tool also includes specific indicators for select illnesses. 5 Patients considered NECPAL positive (+) are SQ+ patients who also fulfill at least one of the tool's other three parameters. The NECPAL tool can be used in all areas of the healthcare system. 6
As far as place of death is concerned, most deaths in developed countries occur in the hospital setting. 7 The hospital mortality rate in Spain in patients with chronic illness ranges from 37% 8 to 57.3%, 9 with the number of times that people are admitted increasing as they become more unwell. 10 In addition, 52% of patients in Spain who die from nonsudden causes are admitted at least once in the last three months of life. 8
In terms of prognosis, although uncertainty is an inherent component of prognosis, 11 failure to consider the patient's prognosis in the decision-making process could lead to inappropriate clinical decision making. 12 Prognosis is therefore an additional element that must be accounted for in the care of our patients. By combining prognostic indices with clinical judgment, it is possible to improve the prognostic accuracy versus using only one of these elements alone. 13 Studies have shown that physicians' prognostic estimates are imprecise,14,15 tending to overestimate survival. 16 Although the NECPAL tool was not originally designed as a prognostic instrument, preliminary results suggest that it can be used for prognosis with a reasonable degree of precision. 17 The combination of this prognostic approach associated with the palliative approach can help in the decision-making process for caring of people with advanced chronic conditions.
With this background, our study aimed to assess and report the hospital mortality rate and post-discharge survival of patients severely affected by one of the 10 chronic illnesses contemplated in the NECPAL tool. A secondary aim was to identify variables associated with mortality during the hospitalization period and with overall survival. We also compared the NECPAL tool with the Charlson index—which assesses the presence of comorbidity 18 —to determine their relative value as predictors of mortality.
The key aspects of this article are shown in Table 1.
Methods
Study design and setting
A cross-sectional study with longitudinal cohort follow-up was carried out in the inpatient wards of Bellvitge University Hospital (HUB) and Duran i Reynals (DIR) Hospital. The HUB is a public tertiary hospital with 759 beds serving a catchment area of more than 2 million inhabitants, being a generalist center. The DIR hospital is a 97-bed public hospital specializing in cancer care and associated with the HUB. Both hospitals are located in l'Hospitalet de Llobregat, Barcelona, Spain.
Eligibility criteria and participant selection
The target population included all inpatients at the two hospitals. The patient sample consisted of all patients who met the study inclusion criteria described below.
A cross-sectional cut was performed at each of the departments, with a different cutoff date for each department. Each department decided a date for the recruitment of patients in their department and investigators collected the data on that day. Patient cohorts were followed for up to two years from the inclusion of the last patient.
Inclusion criteria were patients aged ≥18 years and those who (in the opinion of the physician or nurse responsible for his/her care) were considered to be especially affected by their chronic illness. Previous studies analyzed not only NECPAL patients but also those especially affected by their chronic illness according to the criteria of the Department of Health, even if they were not finally NECPAL patients. 6 In an attempt to follow similar inclusion criteria as in other published reports that used the NECPAL tool, especially affected patients was one of the inclusion criteria. Chronic illnesses were defined as any of the 10 chronic conditions described in the NECPAL tool (Fig. 1). We defined especially affected as any patient whose clinical and functional status—in the clinical judgment of the treating physician or nurse—was severely impacted by the primary chronic illness before admission. Agreement between doctors and nurses was not required for inclusion in an attempt to be inclusive and sensitive. All patients were assessed by both doctor and nurse. Acute illnesses in patients not previously affected by chronic illnesses were excluded from these definitions.
Patients were classified into three categories:
Non-NECPAL: the patient did not meet any of the tool's criteria. NECPAL I–II: NECPAL+ and met a maximum of two additional criteria. NECPAL III: NECPAL+ and met all three of the tool's criteria.
Variables and data sources
All study variables of interest (including patient characteristics and NECPAL-related variables) were obtained by an interview with the healthcare staff (doctor and nurse) and by reviewing the clinical records. In all cases, the same evaluator conducted all staff interviews.
Patient recruitment started in April 2012 and continued through March 2013. Patients were followed for two years from the inclusion date of the last patient.
Statistical analysis
A descriptive analysis of patient characteristics was performed. A binary logistic regression analysis was conducted to identify factors significantly associated with mortality during hospitalization and at six months. Model calibration was performed by the Hosmer-Lemeshow test, and area under the curve (AUC) analysis was used to assess discrimination.
Survival time was assessed, and the number of days elapsed from admission until death was recorded in the subset of patients who died. Mortality was thus assessed both as a dichotomous and as a time-dependent outcome. For the continuous outcome, survival time was defined as the number of months elapsed between study inclusion and the date of death (up to study closure).
Survival functions were estimated using the Kaplan–Meier method. The log-rank test was used to compare survival curves.
The multivariate model was adjusted to determine the associated risk factors by means of a Cox regression analysis for mortality. The modeling strategy consisted of a backward stepwise progression.
Analysis of sensitivity and specificity of the NECPAL III group was performed at 12 and 24 months.
The AUC, calculated with logistic regression analysis, was used to determine the predictive value of the NECPAL and Charlson variables at months 6 and 24.
Ethical oversight
This study was formally approved by the hospital ethics committee.
Results
Patient characteristics at baseline
Between the two hospitals, there are 28 departments. The emergency room department was not included in the study as patients might not be finally admitted in the hospital, and emergency services are not recommended settings for identification in our context. Thus, 27 departments were included in the study. Taking into account those 27 departments, there were 602 patients admitted in the 2 hospitals (HUB and DIR). From those 602 patients, 236 were included (39.2%). Wards more affected were PC, with 100% of patients included; gastroenterology, with 83.3% of patients included; and nephrology, with 75% of patients included.
The sample consisted of 144 men (61%) and 92 women (39%). Of these, 31.3% were cancer patients. The mean age was 68.2 years (standard deviation, 14.72).
Figure 2 shows the study flow chart for patients and the NECPAL classification (non-NECPAL, NECPAL I–II, and NECPAL III) of the study sample.

Details of patient recruitment at the two participating hospitals.
Intrahospital mortality and survival
Forty-nine patients (20.3%) died during hospitalization: 14 (13.3%) were NECPAL I–II; 34 (35.1%) were NECPAL III; and none were non-NECPAL (p < 0.001). Table 2 shows the hospital mortality and rates at 6, 12, 18, and 24 months. Table 3 shows the factors associated with risk of death during the admission period and at six months.
n, Number of patients.
Request: the patient or family requested a palliative approach during hospitalization. Functional decline: when nursing staff respond that the patient presented a clinical impression of sustained functional decline, intense/severe, progressive, irreversible, and unrelated to the intercurrent process. Ulcers: presence of pressure ulcers. Hosmer-Lemeshow test: during hospitalization: p-value = 0.864; at six months: p-value = 0.814. Area under the curve: during hospitalization: 0.84 (95% CI: 0.78–0.9); at six months 0.8 (95% CI: 0.74–0.86).
β, Coefficients of the logistic regression model; CI, confidence interval; n, number of patients; SE, standard error.
Overall, median survival was 9.15 months (95% confidence intervals [CIs]: 4.56–13.73). At the final follow-up, more than half of the non-NECPAL patients remained alive (73.5% alive). Median survival in the NECPAL I–II and NECPAL III groups was, respectively, 16.49 and 2.10 months (95% CI: 4.56–13.73). Half of the non-NECPAL patients did not die before two years.
Table 4 shows the variables found to be independently associated with mortality according to the Cox regression model.
Need: if the medical or nursing staff indicated that the patient requires palliative care measures. Dysphagia: presence of dysphagia. Cancer diagnosis: principal chronic illness (study inclusion criteria: one of the 10 conditions described in the NECPAL CCOMS-ICO©).
At 12 months, the sensitivity and specificity for NECPAL III classification were 56.9% and 76.1%, respectively; with an AUC of 0.665. At 24 months, the sensitivity was 55.2% and specificity was 81.3% (AUC, 0.682).
Discriminatory power for mortality
At six months, the NECPAL had an AUC of 0.7 (95% CI: 0.632–0.765) and an age-adjusted AUC of 0.72 (95% CI: 0.661–0.788). The corresponding results for the Charlson index were an AUC of 0.52 (95% CI: 0.45–0.59) and age-adjusted AUC of 0.57 (95% CI: 0.502–0.649).
At 24 months, the NECPAL AUC was 0.717 (95% CI: 0.650–0.785), with an age-adjusted AUC of 0.759 (95% CI: 0.696–0.822). For the Charlson index, the corresponding values were 0.563 (95% CI: 0.487–0.640) and 0.612 (95% CI: 0.539–0.685).
Discussion
The most relevant contribution of this study to the body of knowledge of PC is the fact that this study is the first to show that the NECPAL tool can improve prediction of intrahospital mortality and mortality at different follow-up time points. Moreover, the tool's predictive ability is considerably more accurate for patients who fulfill all the NECPAL criteria.
As far as intrahospital mortality is concerned, data were reported by other authors and ranged from 1.9% 19 among all hospitalized patients to 9.9% in patients identified with PIG-GSF 20 and 34% in patients referred to specialized PC teams. 21
The survival data in the present study are consistent with other published reports, which described survival rates ranging from 61% at six months 22 to 48% 23 or 50% 20 at one year. Based on the multivariate analysis, several variables had a significant impact on survival. The clinical variable with the greatest negative impact (odds ratio) on survival during hospitalization was the presence of a pressure sore, a risk that has been reported in other studies. 24 However, several other variables were also significant, including age ≥85 years, cancer diagnosis, request for PC, functional deterioration, and NECPAL III classification. Previous studies reported that parameters related to functional decline play an important role in predictive mortality models. 25 Similarly, a diagnosis of cancer was also significant in the multivariate model—a finding that is consistent with other reports, in which this same variable was associated with a greater risk of death.13,15,23,26 It has to be mentioned that in the model, apart from cancer diagnoses, all the chronic conditions from the NECPAL CCOMS-ICO© tool were included. As previously mentioned, DIR is a cancer hospital, with PC service, an oncology department, and a hematology department. The rest of the departments are in HUB.
All the variables that appeared in the intrahospital mortality model (with the exception of request for PC measures) also appeared in the six-month model. The variable, request for palliative care measures, means that patients and/or families were requesting PC input. In the NECPAL CCOMS-ICO© tool, not only patients but also families can request for a PC approach as in our country, families play an important role in decision-making processes and patients by themselves may not ask for a palliative approach very often. Interestingly, the fact that the variable, request for palliative care measures, appeared in the intrahospital mortality model (i.e., the most affected patients), but not in the six-month model, may partially reflect the paternalistic culture present in our geographic area. In our area, only one-fourth of patients with PC needs request PC measures (which are primarily requested by the family and only infrequently by the patient).6,27 For this reason, and in the context of relatively low overall request for PC measures, this request among hospitalized patients is likely made primarily by the most severely ill patients and this explains why patients who request PC measures are more likely to die during hospitalization and also explains why this variable appears in the intrahospital mortality model, but not at six months. The variables that were negatively associated with survival at six months were age >85 years, diagnosis of cancer, functional decline, pressure ulcers, and NECPAL III classification.
We calculated the sensitivity and specificity at 12 and 24 months for NECPAL III, finding that specificity was close to 80%. This indicates that the number of false positives is relatively low. As a result, NECPAL III classification provides clinicians with useful data to help in the decision-making process based on the patient's clinical prognosis.
Comparing with Charlson index, studies conducted in elderly populations to assess the value of the Charlson index to predict 6- and 12-month mortality have reported a hazard ratio of 1.31 and 1.19, respectively.28,29 The Charlson index has also been compared with other prognostic tools, such as the PALIAR score, 30 with findings indicating that the discrimination power of the Charlson index was inferior to that of the PALIAR score. For this reason, we decided to compare NECPAL+ with the Charlson index, finding that a designation of NECPAL+ is a better predictor of mortality at both 6 and 24 months.
In terms of prognostic factors, although several different prognostic indices have been developed for inpatient populations,13,15,25,26,30–37 systematic reviews conclude that the methodological limitations of these studies preclude the generalized use of these indices. 12 Moreover, inclusion criteria vary from study to study, with some including patients during hospitalization and others only after discharge, thus making it difficult to perform comparisons. The AUC of these studies ranges from 0.6433 to 0.86. 26 The one-year mortality rate ranges from 18% 32 to 40%. 36
Due to this poor knowledge in prognosis, we divided the NECPAL tool into different categories to see whether there was an impact in prognosis or not, being the first study to propose the idea of stratifying patients into distinct categories according to the number of NECPAL criteria they meet (NECPAL I–II and NECPAL III). This approach opens up new perspectives for clinicians to use the NECPAL classification to estimate the relative severity of the patient's chronic condition and the impact on expected survival.
Differences among the three patient categories (non-NECPAL, NECPAL I–II, and NECPAL III) in terms of intra- and extrahospital mortality rates are remarkable, particularly because these differences were evident at all time points. Patients classified as NECPAL III present a much higher risk of death. One study assessed survival among inpatients referred for interdepartmental consultations to specialized PC teams, reporting a median survival rate of 83 days, which was similar to the 2.7 months observed in our NECPAL III group, suggesting that such patients may share similar characteristics. 21
O'Callaghan performed a study to determine the validity of the GSF-PIG as a predictor of mortality among hospitalized patients, 38 finding mortality rates of 56.6% and 67.7%, respectively, at 6 and 12 months with a median survival of 114 days (3.8 months) for the patients identified as needing PC. By contrast, median survival in NECPAL III patients was substantially lower (2.1 months). It is worth noting that survival outcomes reported in the study by O'Callaghan et al. were not evaluated according to the number of PIG-GSF criteria present, whereas we distinguished between NECPAL I–II and NECPAL III as a function of the number of criteria met. Our findings indicate that categorization of patients according to the criteria met can increase the predictive ability of the NECPAL tool.
One of the main strengths of this study is that data collection was performed by a single researcher. Moreover, this same researcher was also responsible for all in-person interviews of healthcare professionals. This consistent approach assured homogeneous data collection techniques. It is also important to note that during the months required to complete the study, the hospital staff received no extra training in the use of the NECPAL tool; as a result, although evaluations were performed at different time points in various departments, all healthcare staff received the same basic training in the NECPAL tool. In short, staff members in departments that were evaluated later in the study were not better able to discriminate patients due to an improved understanding of the tool.
Administration of the NECPAL tool requires first-hand knowledge of the case. For this reason, we asked the physicians or nurses directly involved in the care of patients to administer the NECPAL tool. This approach contrasts with that used in many studies, in which outside experts are asked to identify patients by reviewing the clinical records. 38 Although other studies have reported that the predictive accuracy of survival decreases inversely to the clinician's personal relationship, 19 we believe that our approach provides a more pragmatic manner of identifying such patients. Thus, the performance of the survival model is likely to be more consistent with real-world outcomes. However, on the other hand, we have not analyzed the experience and criteria on which professionals based their assessments, which limit the generalization of results.
One of the study limitations is that we did not analyze the survival of inpatients who were not included in this study. As a result, we were unable to perform a comparative survival analysis between included and excluded patients, in contrast to some other studies that did assess survival in patients who did not need PC. 38
In summary, using the parameters of the NECPAL CCOMS-ICO© tool can improve prediction of mortality and provide data that can facilitate decision making by providing clinicians with more precise information about prognosis. The presence of all three NECPAL criteria (NECPAL III) increases the tool's predictive ability, and further research is needed to increase the accuracy of the NECPAL tool by identifying parameters that add more specificity and permit building of a prognostic scale.
Although the results of this study are significant, our findings need to be confirmed by similar studies in different hospitals, as well as in patients in intermediate care facilities, where the prevalence of NECPAL+ patients is likely to be high. It is a single-site study with findings that need to be tested more widely.
Despite some authors believing that the use of prognostic tools should not be generalized given the methodological limitations of some studies, 12 we believe that the results of the present study could add value to daily clinical practice as an additional component to be considered cautiously in individual clinical decision making. Nevertheless, multicentered studies are needed to validate the NECPAL tool in other hospitals and in other geographic regions.
Footnotes
Acknowledgments
The authors wish to thank Dr. Jordi Amblàs Novellas and Dr. Jesús González-Barboteo for critically reviewing the manuscript and for providing valuable comments. The authors also thank Ms. Judit Solà Roca for her help in analyzing the data and Ms. Sara Ela for her assistance throughout the entire study. Finally, the authors thank Mr. Bradley Londres for translating the document and making valuable suggestions for further improvement.
Author Disclosure Statement
No competing financial interests exist.