
Abstract
Abstract
Background:
Serial Palliative Performance Scale (PPS) assessments may predict functional decline and prognosis in cancer and noncancer patients and help with end-of-life decision making.
Objective:
To evaluate the functional status of using serial PPS assessments of patients being assisted in collaboration with the palliative care team (PCT).
Design:
Prospective cohort pilot study.
Measurements:
The sample consisted of 64 cancer and noncancer inpatients being assisted in collaboration with the PCT during the period from 2012 to 2016 (included 12 months). Patients' PPS scores were assessed in three sequential stages: prehospital, first PCT assessment, and outcome (discharge, transference to another unit or death). Functional performance was classified in categories as stable (PPS scores between 70% and 100%), transitional (PPS scores between 40% and 60%), and end of life (PPS scores between 10% and 30%).
Results:
The mean PPS score during the three assessment stages (respectively, 60.5%, 38.9%, and 25.9%) was significantly different (p < 0.001). Cancer patients had higher PPS scores than noncancer patients; however, both groups exhibited a functional decline along the hospital stay. In both groups there was a negative correlation between the time frame between the different assessment stages and PPS scores (respectively, Pearson −0.4 and −0.6; p < 0.01). The survival curve of the first palliative assessment stage demonstrated earlier death in patients in the end-of-life category.
Conclusion:
Serial PPS assessments are feasible and predicted functional decline in cancer and noncancer patients in this sample. Cancer patients exhibited higher initial functional scores but both cancer and noncancer patients declined in functionality along hospitalization. Earlier deaths occurred in the terminal PPS category than in the transitional PPS category.
Introduction
A
Weng et al. 6 demonstrated the association of PPS scores with survival rates of terminal cancer patients (≤30%, 6 days; 40%, 19 days; and ≥50%, 34 days). Virik and Glare 7 demonstrated that the admission PPS score reliably predicted survival. Some authors, however, argue that a more accurate survival prediction can be obtained with two or more serial scores.8–10
A prospective cohort pilot study was carried out at a General University Hospital (GUH) in southern Brazil with the objective of evaluating the functional status using longitudinal transitions obtained by the PPS scores of inpatients been assisted in collaboration with the palliative care team (PCT) as an aid to predict the hospital mortality rate and, therefore, help them with end-of-life decision making and care planning.
Methods
Design and sample
A prospective cohort pilot study included 64 adult patients (≥18 years old) admitted to the medical or surgical ward and who were referred to the PCT either by the attending physician or by PCT active search. Exclusion criteria were imminent death and refusal to participate. The Committee for Ethics in Human Research of the university approved the study.
Tools and procedures
The clinical and demographic data were collected at the inclusion. Three serial PPS 1 scores were obtained by the same researcher (palliative care medical resident): prehospital stage (stage 1a: 2–4 weeks before admission), admittance/inclusion stage (stage 2a: evaluation of PCT), and follow-up stage (stage 3a: at the time of discharge, transfer to another hospital, or in-hospital death = high, transfer, or death). The PPS scores in the three stages were obtained during hospitalization, including those of the first stage. Participants were categorized according to the scores as stable (PPS between 70% and 100%), transitional (40%–60%), end of life/terminal (10%–30%), and death (0%). 10
Statistical analyses
Descriptive statistics are presented as mean ± standard deviation. As a first step, the within-subjects effects comparison test was applied to detect the overall difference between means at the three different stages. The variance of the data was checked using Mauchly's test of sphericity, used to validate the one-way analysis of variance (ANOVA) for repeated measurements, performed to compare differences in the mean PPS scores at the three different stages. These were followed by a Bonferroni post hoc test, to identify individual differences between the three moments (stages). Results of pairwise comparisons are presented. The Pearson correlation coefficient measured the relationship between PPS scores and cancer and noncancer groups in the three different stages. The Kaplan–Meier method was employed to estimate survival, and statistical significance was set at p < 0.05. Analyses were conducted using SPSS version 18.0.
Results
Clinical and demographic variables
From 2012 to 2016 (included 12 months), 1536 patients were admitted to the medical and surgical wards of the GUH and 64 met the study inclusion criteria.
Primary diagnosis of the majority of the patients was active stage IV malignancy [56.3% (36/64)]. Among noncancer patients, the primary diagnoses were chronic obstructive pulmonary disease 3.1% (2/64), cerebrovascular disease and dementia 17.1% (11/64), fragility 3.1% (2/64), other terminal conditions 10.9% (7/64), congestive heart failure 6.3% (4/64), and chronic hepatic failure 3.1% (2/64). The majority of patients were ≥60 years old [70.3% (45/64)] and were female [54.7% (35/64)].
Serial PPS scores and survival outcomes
Results from the within-subjects effects comparisons, Table 1, showed an overall significant difference between the mean scores with a decreasing linearity throughout the three assessment stages (p < 0.001). In addition, the Bonferroni post hoc test, Table 2, allowed us to detect significant pairwise differences (p < 0.001) when comparing each one, of the three moments, with the others.
Stage 1a: prehospital; Stage 2a: first review palliative; Stage 3a: during high rating, death, or transfer; n = total number of patients in the study; p-value = significance test for within-subjects effect (ANOVA with repeated measures).
ANOVA, analysis of variance; PPS, Palliative Performance Scale; SD, standard deviation.
Bonferroni post hoc test for multiple comparisons.
CI, confidence interval; SE, standard error.
Cancer patients obtained higher PPS scores at the three assessment stages; however, both cancer and noncancer groups exhibited declining scores along the assessment stages. The ANOVA demonstrated significant linearity between the groups (p < 0.01). The Pearson correlation coefficient analysis demonstrated a negative correlation at the three stages in relation to the PPS scores obtained by the cancer and noncancer groups (−0.4 and −0.6, respectively; p < 0.01 in both groups) (Fig. 1).
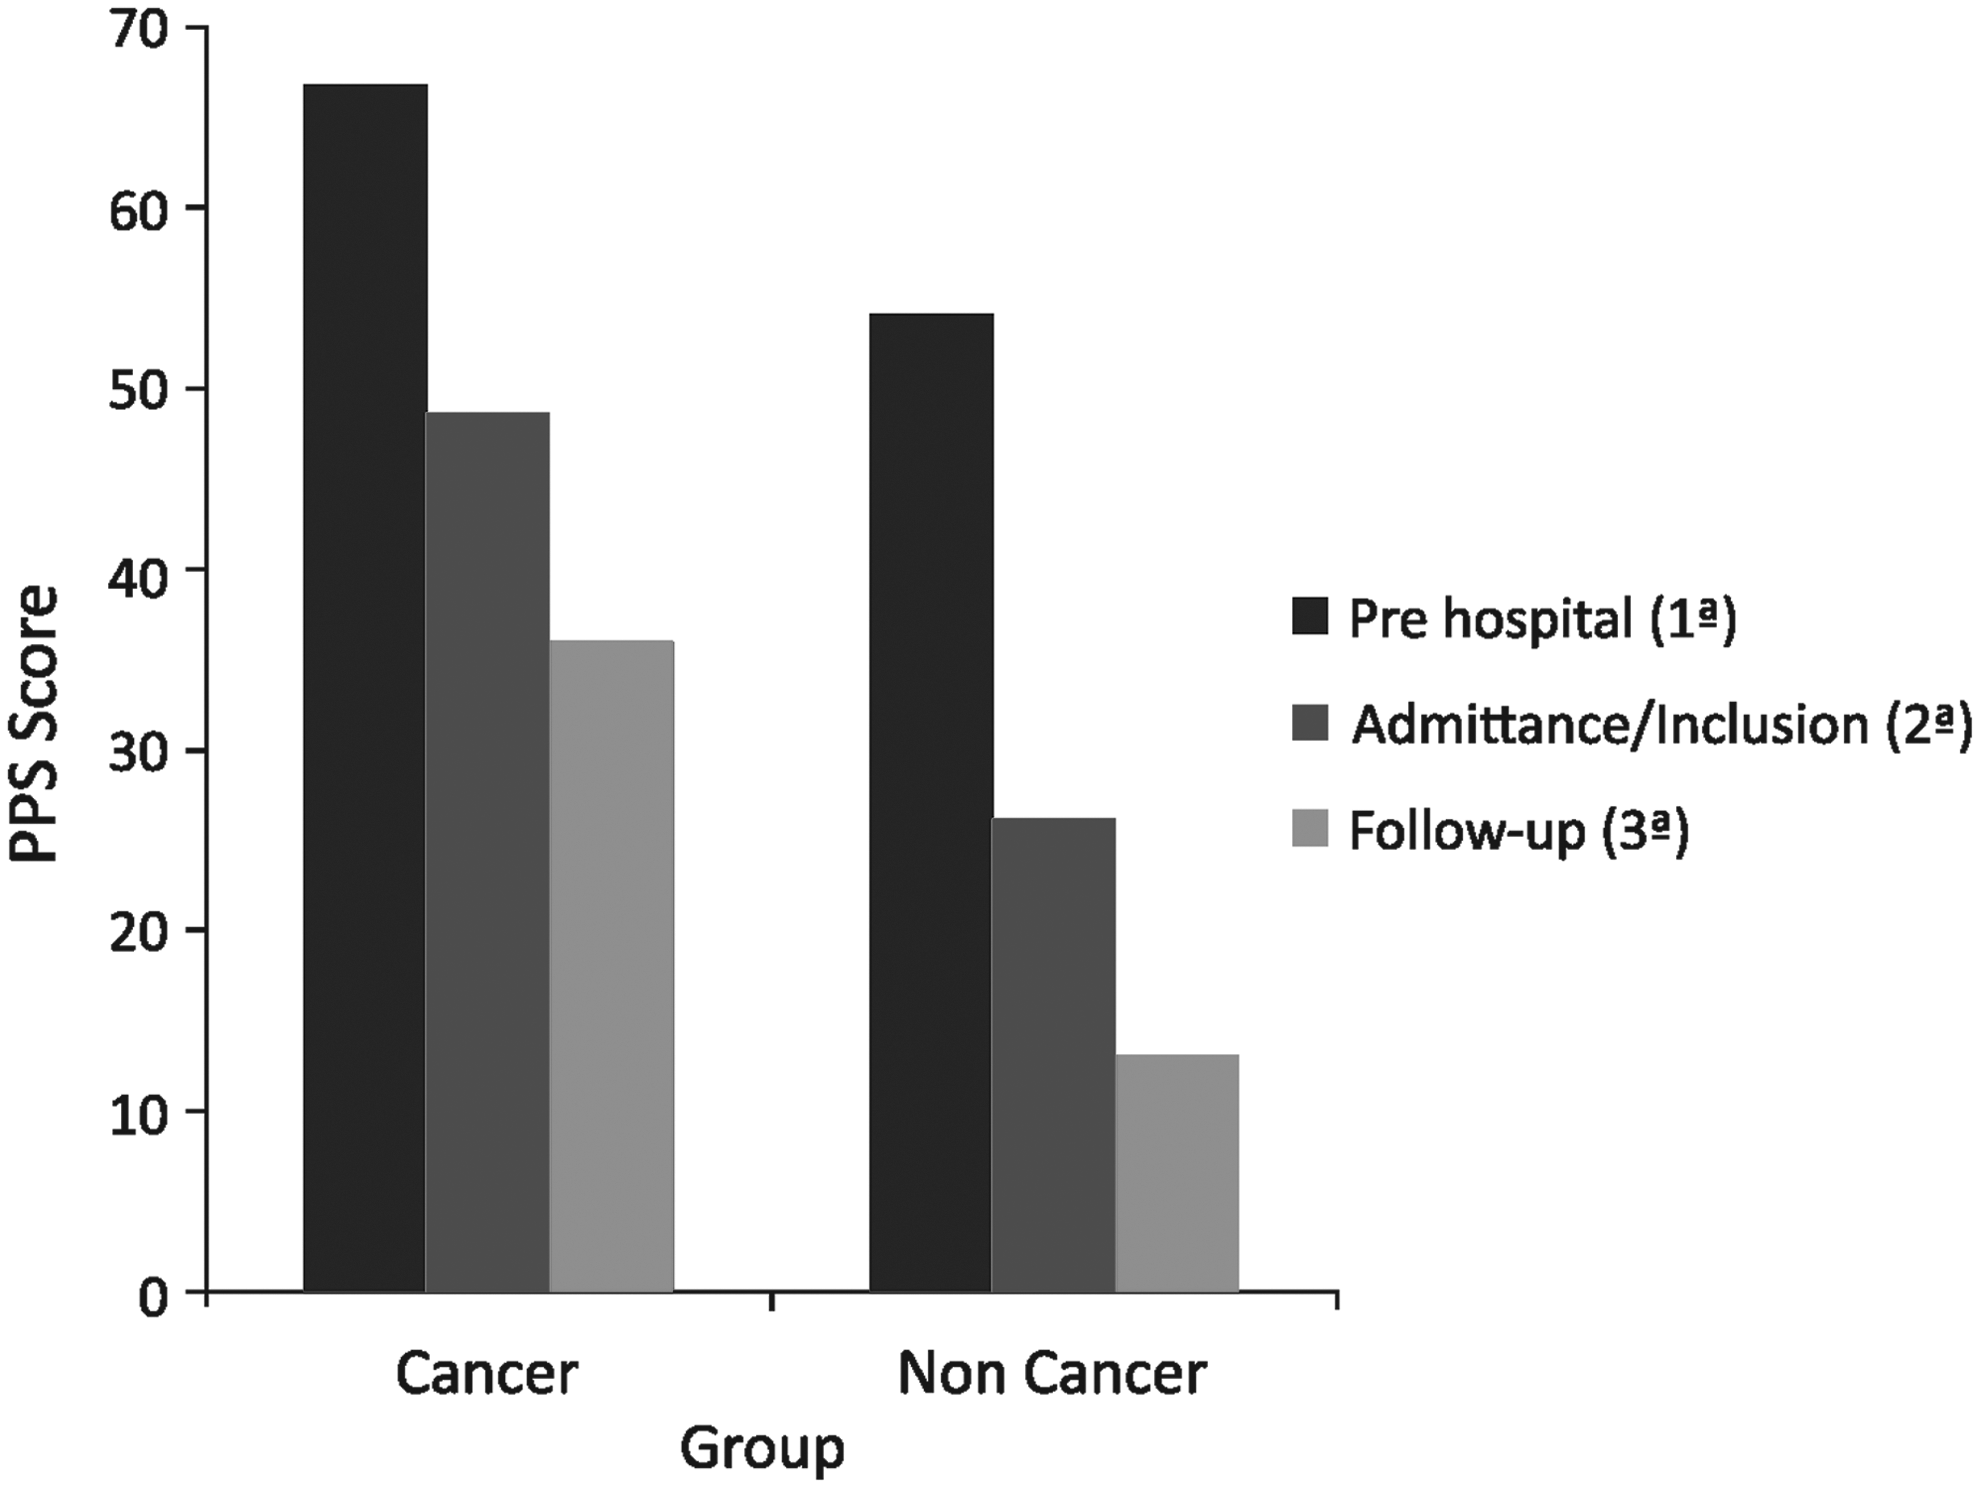
Average Palliative Performance Scale (PPS) between cancer and noncancer patients in three stages.
The distribution of the prehospital PPS score categories was stable in 39.1% of cases (25/64), transitional in 46.9% (30/64), and terminal in 14.1% (9/64). At the second assessment stage, they were, respectively, 18.8% (12/64), 23.4% (15/64), and 57.8% (37/64); at the third assessment stage, they were, respectively, 14.1% (9/64), 17.2% (11/64), and 25.0% (16/64).
The mortality rate was 43.8% (28/64) and slightly higher between cancer and noncancer patients [23.3% (15/64) and 20.3% (15/64, respectively]. The majority of the deceased were 60 years or older [82.1% (23/28)].
The serial PPS scores demonstrated a functional decline with an inversion of the proportion of patients in the stable and transitional categories toward the terminal category (Fig. 2).
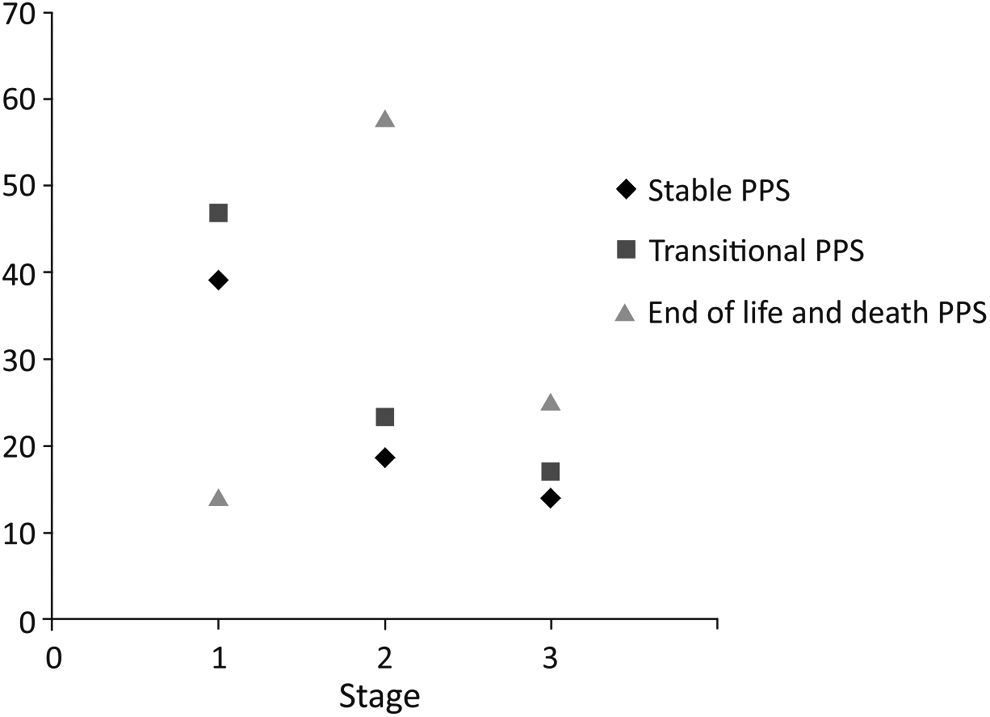
Distribution of patients in the three stages according to the phase of the PPS. Stage 1a: prehospital; Stage 2a: first review palliative; Stage 3a: during high rating, death, or transfer.
The median length of stay of patients was 24.5 ± 17.1 days. The Kaplan–Meier survival curve by second assessment stage demonstrated that patients in the terminal category died earlier than transition category patients. Patients in the stable category exhibited a stable curve (Fig. 3).
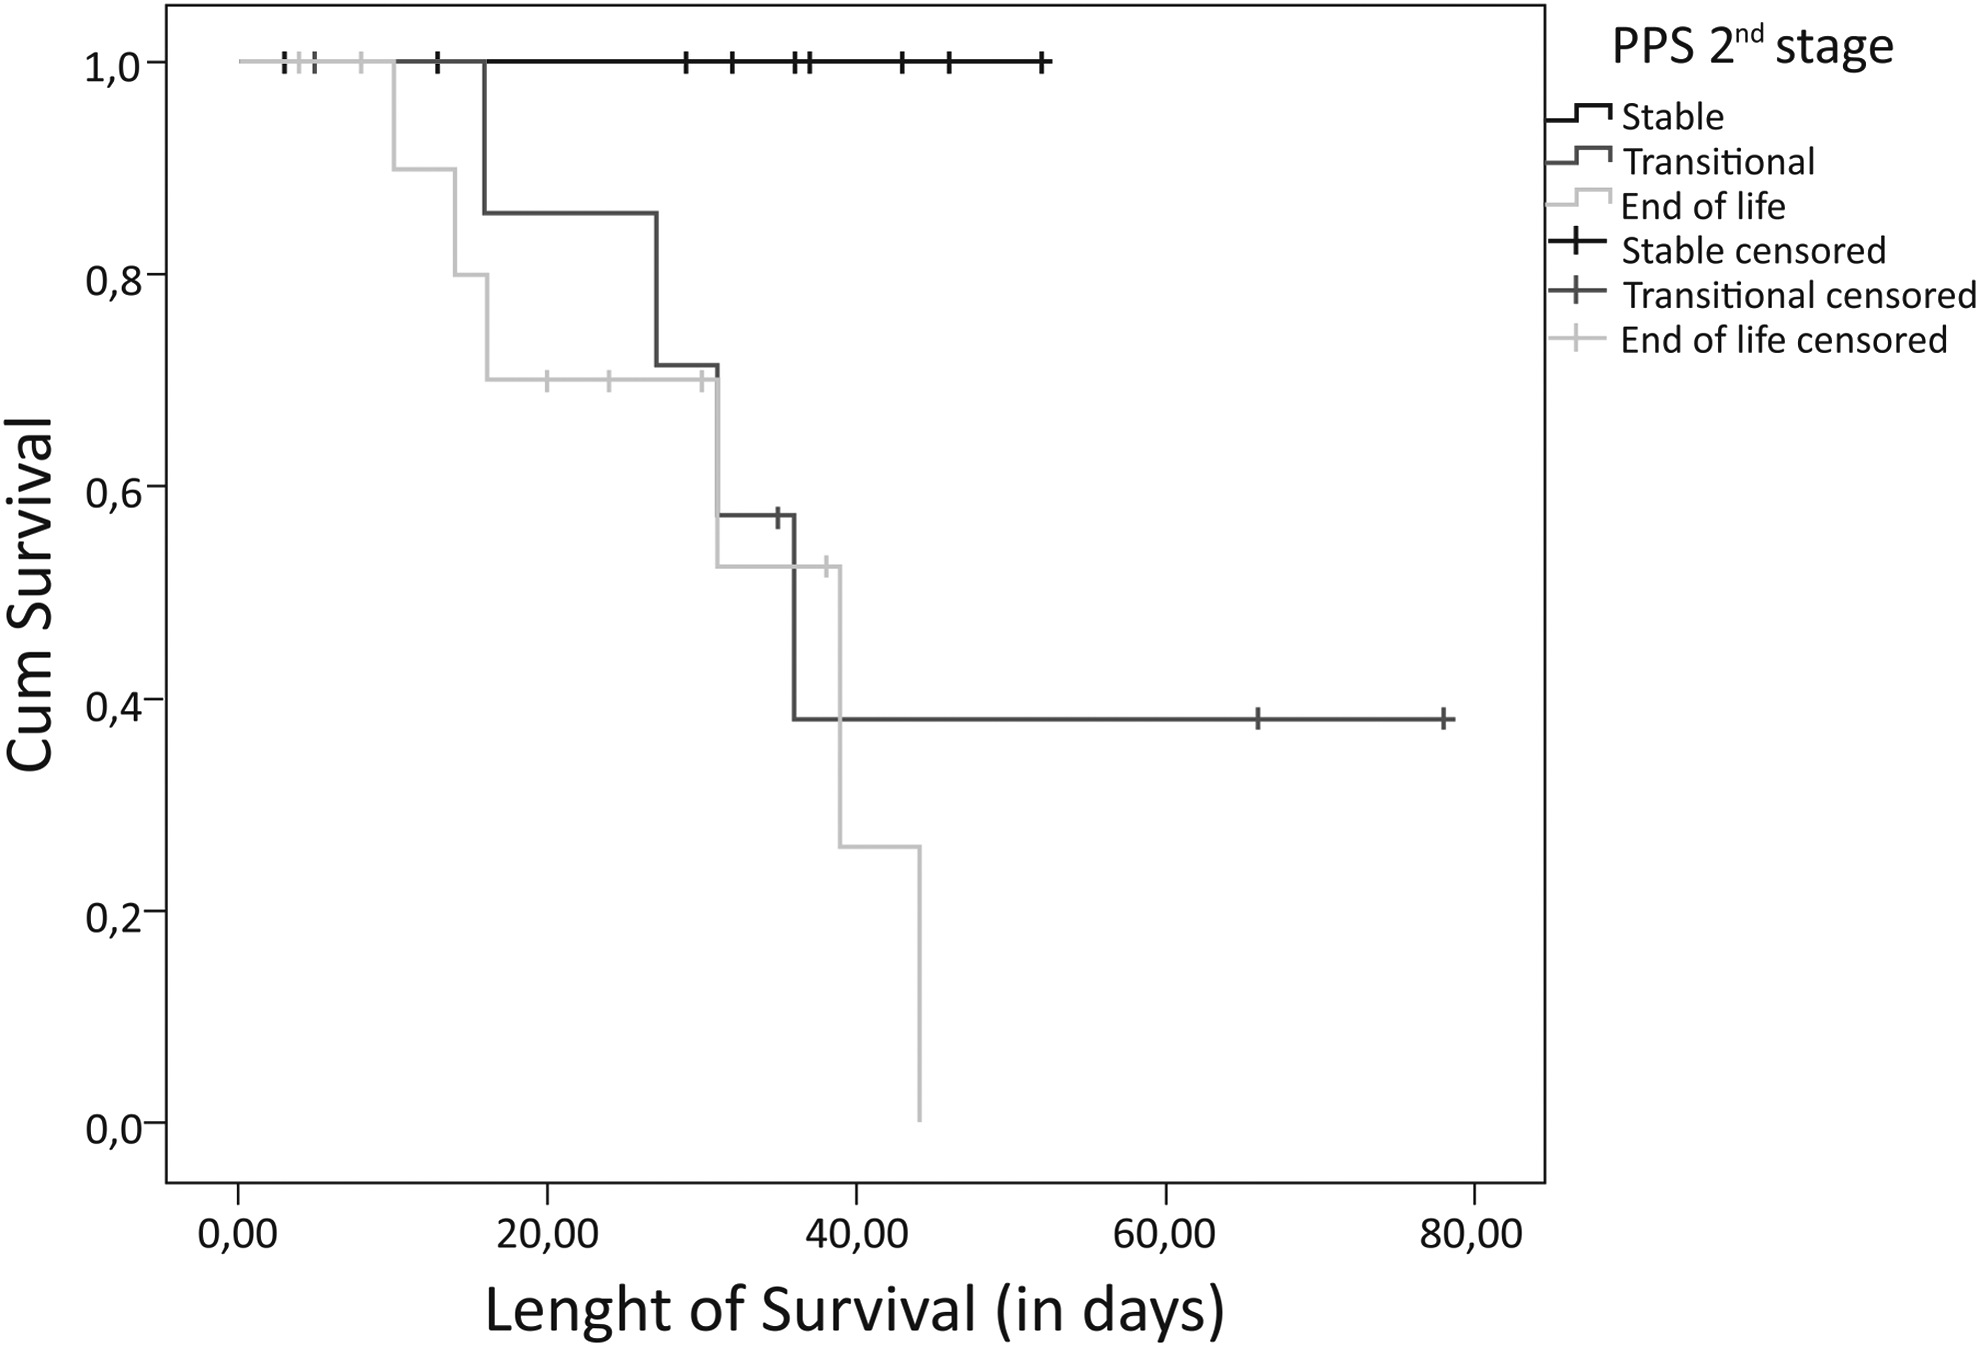
Kaplan–Meier curves by initial PPS (admittance/inclusion stage).
Discussion
Appropriate end-of-life care depends on timely identification of poor prognosis. Clinical tools designed to help with prognosis assessment such as the PPS are a welcome addition to routine patient care. The functional decline observed by serial PPS assessments contributes to a better understanding of the prognosis of both cancer and noncancer patients.3–6,9 In this pilot study, the serial PPS score assessment demonstrated the decline in the median PPS score in both cancer and noncancer patients.
The majority of patients (56.3%) had cancer as the primary admission diagnosis, which is in line with the literature. Chan et al. 3 assessed the survival rates of 400 terminally ill patients admitted to a general hospital in Singapore and found that 85% of patients had cancer as a primary diagnosis. A similar finding is exhibited by a Canadian study in which 67% of 513 patients admitted into a local palliative care facility had cancer. 5 The fact that the majority of the patients in our study were elderly (70.3%) may have contributed to the higher proportion of cancer patients, a hypothesis that is also considered in the aforementioned studies.
This study also demonstrated, in accordance with the literature findings, that cancer patients are admitted with higher scores than noncancer patients, who also exhibit lower prehospital scores. Both groups, however, exhibit a linear decline along the duration of hospitalization.11,12 The serial PPS assessment allowed the identification of the proportion of patients whose prognoses were categorized as stable and transitional according to the first and second assessments and who moved to the terminal category by the time of the third assessment.
In a prospective cohort study of 11,374 adult cancer outpatients, Sutradhar et al. 10 analyzed the probability of improvement or decline according to PPS scores. Lung cancer and breast cancer patients in the transitional PPS category had, respectively, a 27.7% and 17.5% probability of dying in 30 days. The average time that breast and gastrointestinal cancer patients remained in the same category was, respectively, 8.8 and 6.6 weeks, which pointed to a timely referral to palliative care. 10
Another prospective cohort study of 400 patients assessed the PPS scores at admission, at 2 weeks before admission, and at the end of the first and second weeks of hospitalization. A decline in functionality was observed during hospitalization and the magnitude of the decline was correlated with survival, which demonstrated the utility of this tool in prognostication. 3
Despite the differences in PPS scores between the cancer and noncancer patients, deaths occurred in a similar proportion in both groups. But, the proportion of noncancer patients who were categorized as terminal at the second PPS assessment was 82.1%, whereas in the cancer group, 30.6% of the patients were categorized as transitional and 30.6% as stable, reflecting the different patterns of disease progression in cancer and noncancer populations. 9
The average time to death, after the second PPS assessment, was 10 and 12.5 days, in the noncancer and cancer population, respectively, which may corroborate the findings by Lau et al. 5 that noncancer patients have a worst prognosis because they are referred to palliative care in later stages of disease progression.
The PPS is an important survival predictor in cancer and noncancer life-limiting diseases, and for this reason, it is essential to include this assessment at the first consultation, whether at home or in hospital. 5
The Kaplan–Meier curve based on the first consultation of the PCT (second PPS assessment) revealed an early death outcome in the terminal PPS category group when compared with the transitional PPS group, but remained stable in the stable PPS category.
The small sample and the potential bias from the assessment of the prehospital PPS are limitations of this study.
Conclusion
Serial PPS assessments revealed a decline in functionality in the sample population, with an inversion of the proportion of patients categorized as stable toward the terminal category between assessments. Cancer patients exhibited a higher functional score, but both cancer and noncancer patients declined in functionality along hospitalization. Earlier deaths occurred in the terminal PPS category than in the transitional PPS category group.
Footnotes
Acknowledgments
We thank University Hospital Polydoro Ernani de São Thiago in Florianópolis for supporting our study.
Author Disclosure Statement
No competing financial interests exist.