
Abstract
Abstract
Background:
Use of the Medicare hospice benefit has been associated with high-quality care at the end of life, and hospice length of use in particular has been used as a proxy for appropriate timing of hospice enrollment. Quantile regression has been underutilized as an alternative tool to model distributional changes in hospice length of use and hospice payments outside of the mean.
Objective:
To test for heterogeneity in the relationship between patient characteristics and hospice outcomes across the distribution of hospice days.
Setting:
Medicare Beneficiary Summary File and survey data (2014) for hospice beneficiaries in North and South Carolina with common terminal diagnoses.
Measurements:
Distributional shifts associated with patient characteristics were evaluated at the 25th and 75th percentiles of hospice days and hospice payments using quantile regressions and compared to the mean shift estimated by ordinary least squares (OLS) regression.
Principal Findings:
Significant (p < 0.001) heterogeneity in the marginal effects on hospice days and costs was observed, with patient characteristics associated with generally larger shifts in the 75th percentile than the 25th percentile. Mean effects estimated by OLS regression overestimate the magnitude of the median marginal effects for all patient characteristics except for race. Results for hospice payments in 2014 were similar.
Conclusions:
Methodological decisions can have a meaningful impact in the evaluation of factors influencing hospice length of use or cost.
Introduction
U
Standard regression estimates the mean of the conditional distribution of an outcome as a function of the explanatory variables. OLS regression may fail to capture shape shifts caused by covariates at other percentiles of the distribution because OLS assumes only a mean shift in the distributions. In contrast, quantile regression estimates a percentile of the conditional distribution of an outcome as a linear function of explanatory variables. As a result, quantile regression is able to model shifts in the center of the distribution or any other quantile desired while controlling for relevant covariates; furthermore, multiple quantile regressions at different percentiles can be used to compare the shifts associated with covariates across the distribution of hospice days. This method is well established in economics 14 and has been applied to analyses of health-related outcomes, including emergency department wait times, 15 healthcare expenditures, 16 lead exposure, 17 and body mass index. 18
Previous studies of hospice length of use have used binary thresholds,19–21 log transformations, 22 proportional hazards,23,24 count distributions,25,26 or other methods 27 to model the outcome. Each of these techniques returns relative measures of effect (e.g., odds ratios or rate ratios) which can be difficult to interpret. 28 In contrast, quantile regression allows absolute differences to be calculated. Binomial logistic models predicting the probability of a short or long stay are frequently used because these binary thresholds have policy relevance. Cox proportional hazards models improve on the OLS assumption of a mean shift by allowing a median effect estimate, but they impose additional parametric assumptions that may not hold for all independent variables. 29
Utilizing statistical models that do not appropriately fit the distribution of the outcome may result in statistically unreliable predicted values 15 and undermine decisions that rely on these predictions. Quantile regression has been largely overlooked as a potential approach to understand the determinants of hospice length of use and evaluate policies and programs intended to improve appropriate lengths of use in hospice. The objective of this study is to describe the heterogeneity in the relationship between patient characteristics and hospice outcomes across the range of hospice days using quantile regression. In addition, the characteristics and patterns of care are described for the patients in the upper and lower tails of the distribution to better understand the implications of this variation for policy and practice.
Methods
Study cohort
The patient population includes Medicare beneficiaries in North Carolina and South Carolina older than the age of 65 with at least one day of hospice usage with terminal diagnoses of cancer, pulmonary, respiratory, or cognitive disorder. Terminal or hospice qualifying diagnosis was defined as the principal diagnosis listed on the hospice claim. Medicare beneficiary characteristics (e.g., gender, age, race, state, and hospice qualifying diagnosis), County socioeconomic factors (e.g., poverty), and hospice supply (e.g., number of providers) were provided by the 2014 American Community Survey (ACS) and Medicare public use file respectively.
Measures
Outcomes included number of days of hospice utilized and total Medicare hospice payments. Utilization and cost data were aggregated at the beneficiary level for the calendar year 2014, using the Medicare Beneficiary Summary file. Stays longer than the calendar year are censored at 365 days. Utilization of skilled nursing facility (SNF), home health, and inpatient services across quantiles of hospice days are described to assess potential implications of quantile-specific estimates. Independent variables included beneficiary age, race, gender, hospice-qualifying diagnosis, county poverty rates as a measure of socioeconomic status, and number of hospices in the county as a measure of access to hospice services. Additional area demographic measures were excluded from the model due to high levels of uncertainty in the ACS estimates or due to high correlation with poverty levels. To assess the potential impact of measurement error in the ACS survey, 100 different poverty levels by county datasets were simulated from a normal distribution with mean equal to the ACS estimate and variance based on the standard error of the ACS estimate. Results of regressions with simulated data returned similar results to those presented in this report. Descriptive statistics for county characteristics are weighted by the number of patients in the quartile in each county.
Statistical analysis
Coefficients representing the shift in the distribution associated with the covariates were estimated at multiple percentiles using quantile regressions.14,30 Quantile functions for each independent variable were evaluated using a grid of quantiles from 0.01 to 0.99 and quantile regression slope functions with 90% pointwise confidence interval (CI) for the function are available in the Supplementary Figure S1 (Supplementary Data are available online at www.liebertpub.com/jpm). Differences between the slopes at the 25th and 75th percentiles were tested for equality. All statistical analyses were conducted using R, version 3.3.1; quantile regressions were implemented using the quantreg package, version 5.33.
Results
Of 2,754,136 Medicare beneficiaries in North and South Carolina with claims in 2014, 43,737 patients aged 65 and older with at least one day of hospice usage with terminal diagnoses of cancer, pulmonary, respiratory, or cognitive disorder are included. The distribution of hospice days for patients with at least one day of hospice usage in 2014 has a right skew with a mean of 70 days and median of 26 days (Fig. 1). The mean hospice days for patients in the first quartile (6 days or fewer) is 3.4 days; the mean hospice days for patients in the last quartile (92 days or more) is 210 days (Table 1).

Distribution of days of hospice use in 2014 among hospice beneficiaries in North and South Carolina (censored at 365 days).
Relative to patients with a short hospice stay (first quartile for hospice days), patients with a long hospice stay (last quartile for hospice days) are more likely to be female, live in South Carolina, and have a qualifying diagnosis other than cancer. Patients with a short hospice stay generated over $13,000 in annual inpatient claims on average compared to less than $5000 for those with a long stay. Compared to patients with a short hospice stay, patients with a long hospice stay also incur lower payments for skilled nursing, although the difference is not as large as for inpatient payments.
In Figure 2, OLS coefficient estimates are compared with quantile regression estimates representing the marginal effects of patient characteristics on hospice days for the 25th, 50th, and 75th quantiles of hospice days. In the OLS model, female patients are estimated to spend 10.2 more days in hospice (CI 8.4–12.0) compared with male patients conditional on the other covariates; however, the quantile regression estimates demonstrate that this difference in the means is driven by the pronounced effect among patients with longer hospice stays. Holding all else constant, the 75th percentile of days for women is 16.5 days(CI 13.4–19.7 days) longer than the 75th percentile for men, and the 25th percentile for women is only 1.5 days(CI 1.2–1.8 days) longer than the 25th percentile for men. In addition, the quantile regression coefficients associated with age, gender, state, diagnoses category, and poverty are significantly different between the 75th percentile and the 25th percentile regressions (p < 0.001).
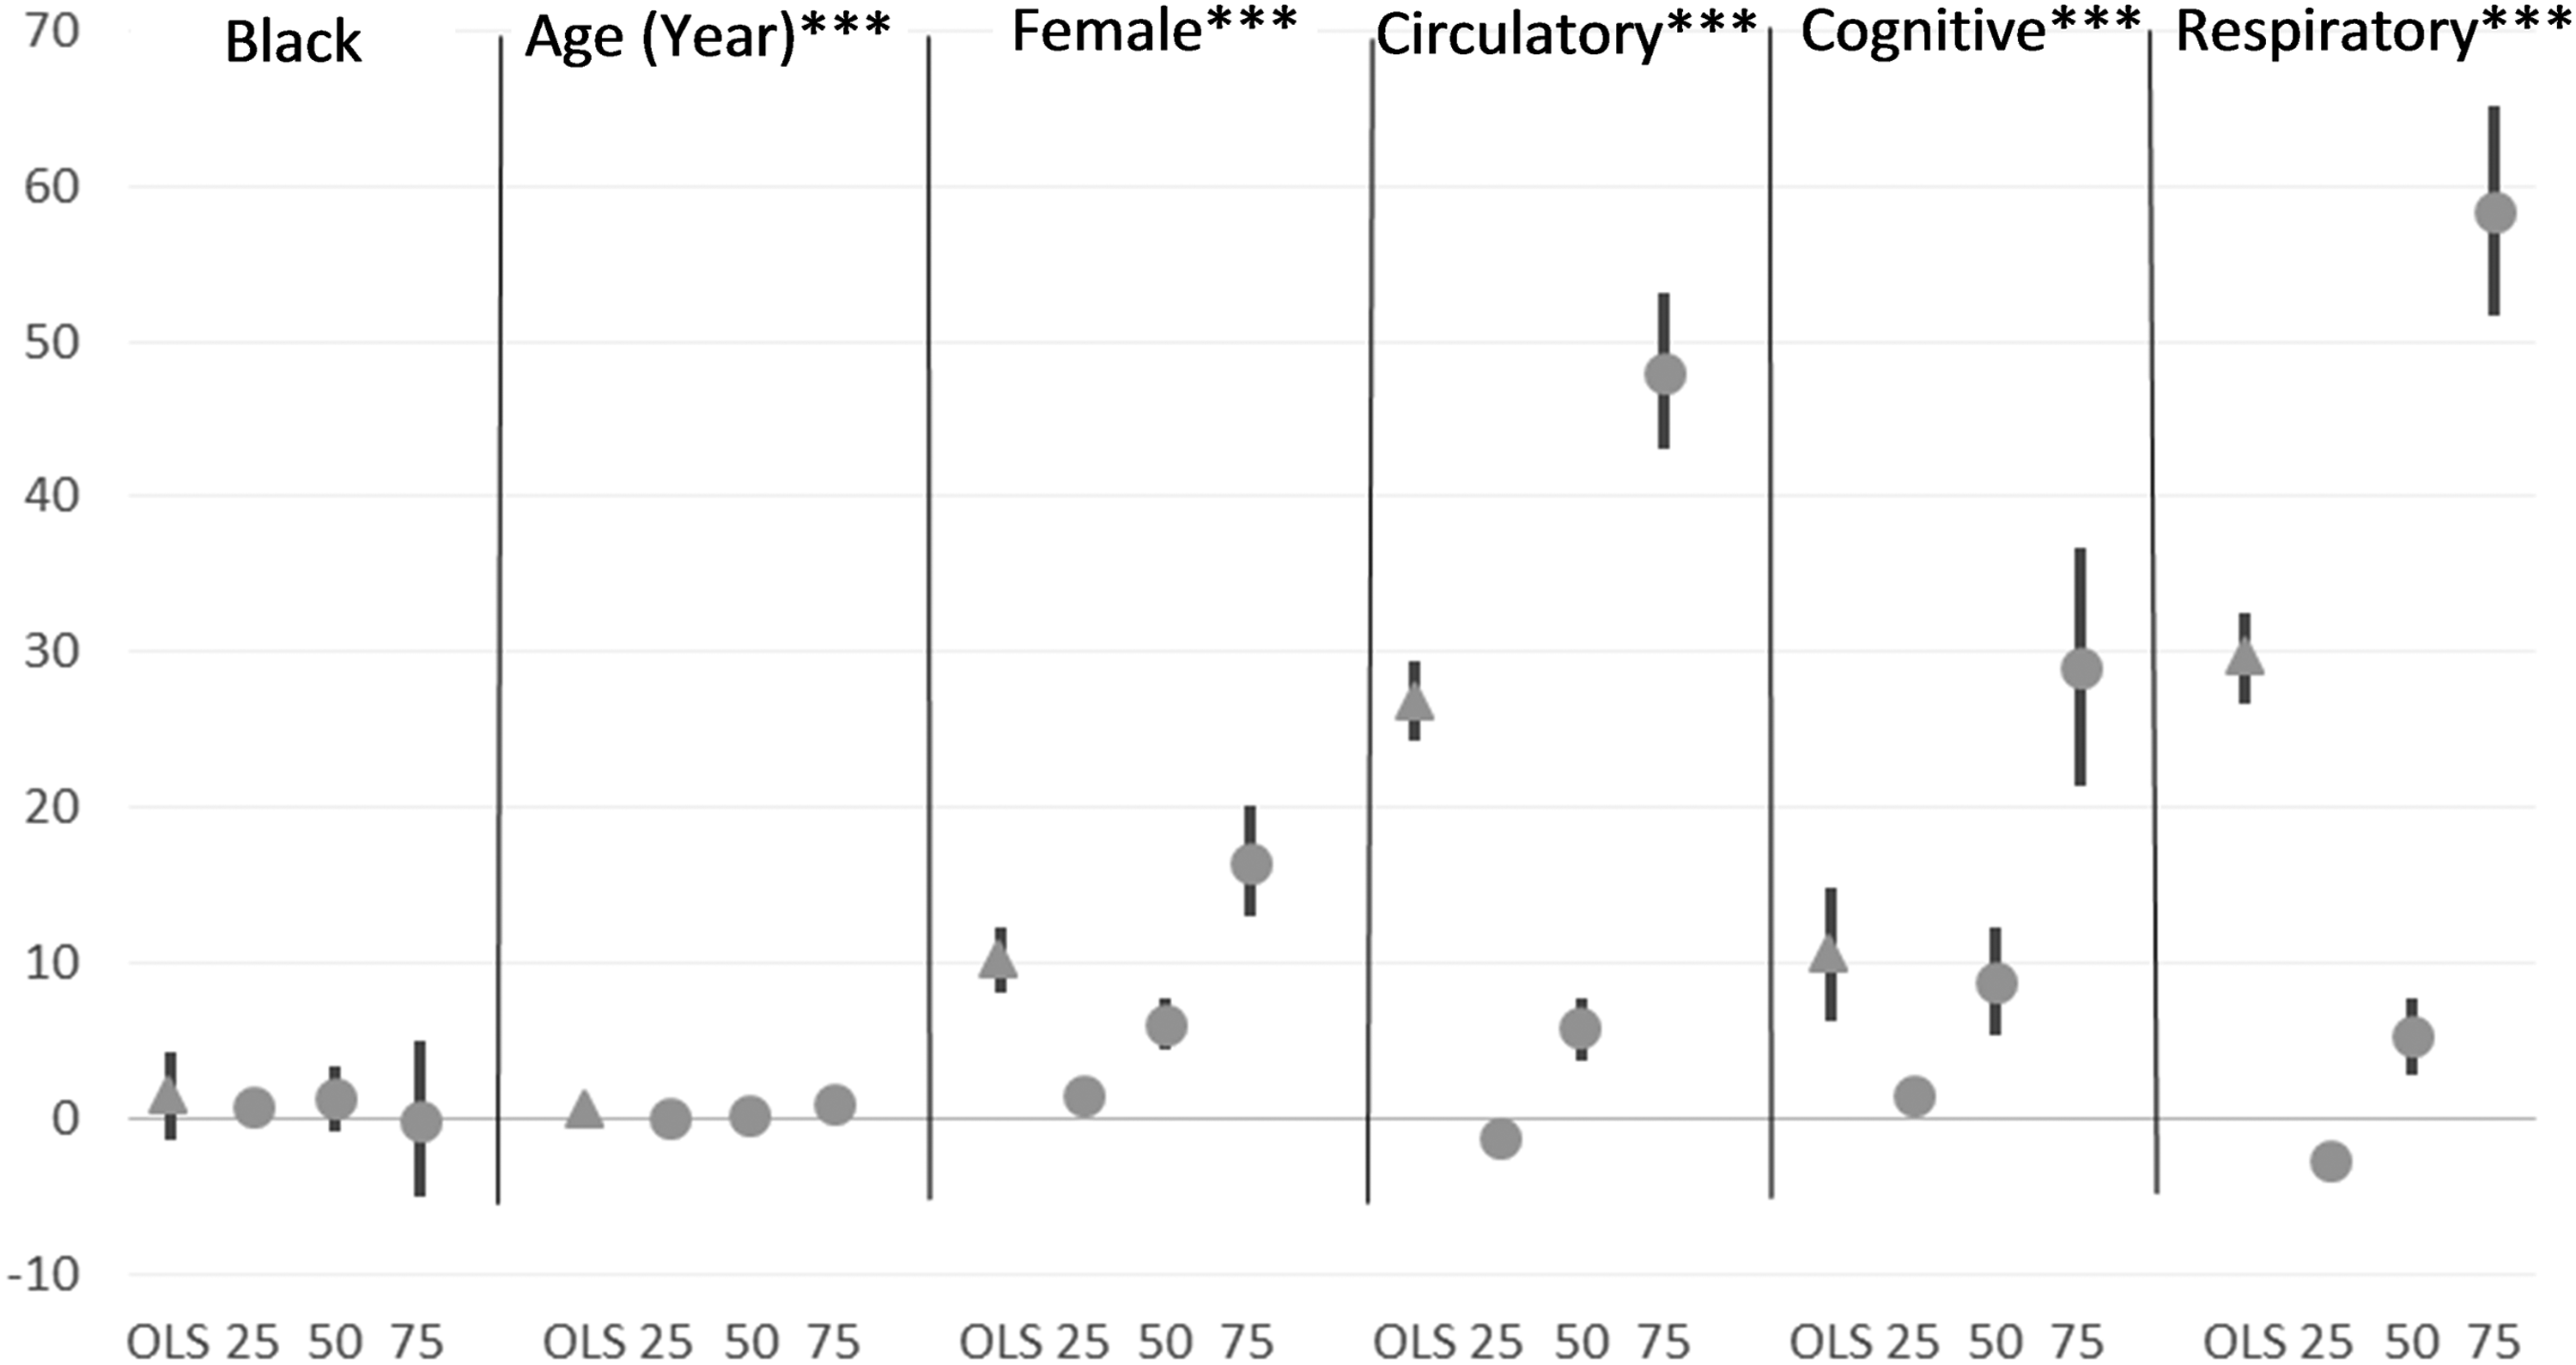
Marginal effects estimated by OLS and Quantile regressions at the 25th, 50th, and 75th percentiles predicting hospice days per beneficiary in 2014. Authors' analysis of 2014 Medicare Beneficiary Summary file linked with the ACS. Among hospice beneficiaries in North and South Carolina with cancer, pulmonary, respiratory, or cognitive disorders, utilization and cost data were aggregated at the beneficiary level for calendar year 2014. The referent group is a 65-year-old Caucasian male with a cancer diagnosis. Each symbol presents the expected change in number of days for the category (or one unit increase) compared to the reference estimated by either OLS or quantile regression. All equations adjust for Medicare beneficiary gender, age, race, state, and hospice qualifying diagnoses and county poverty rate and number of hospice providers. The lines represent the 95% confidence interval for the estimate. Equality of coefficients between the 25th and 75th percentiles was tested, and a significant F-statistic indicates that we reject the null hypothesis of equality. ***p < 0.001. OLS, ordinary least squares.
The most extreme variation between estimates at the 25th and 75th percentiles is observed in the effects of diagnoses. Comparing the marginal effects associated with a respiratory diagnosis relative to a cancer diagnosis at the 25th percentile versus the 75th percentile for hospice days (−2.7 and 58.3 days, respectively), the difference in the marginal effect estimates is greater than 60 days. Similarly, relative to cancer diagnoses, a circulatory diagnosis is associated with a 1.3 day increase at the 25th percentile compared to a 48.1 day increase at the 75th percentile for days in hospice. Comparing OLS to median quantile regression estimates, for both respiratory and circulatory diagnoses, the average marginal effects estimated by OLS (29.7 and 26.8 days, respectively) are about five times the effect at the median estimated by quantile regression (5.4 and 5.7 days, respectively). Results for hospice payments per beneficiary are similar (Supplementary Fig. S1) due to the high correlation between these two outcomes.
Discussion
Distributions of demographics and clinical characteristics are different for hospice patients with the fewest hospice days compared to those with the most days. In this application, the quantile regressions reveal heterogeneity in the associations of patient characteristics with hospice length of use and cost, with greater shifts among patients with more days in hospice (75th percentile) than among patients with fewer days in hospice (25th percentile). The quantile regressions also describe meaningful changes that occur in the tails of the distribution even when the mean effect, estimated through OLS regression, is not significant. OLS overestimates the magnitude of the median marginal effects for all patient characteristics except for race and overestimates the median effects of circulatory and respiratory diagnoses relative to cancer by a factor of five. For the 50% of hospice patients with length of use less than the median, the differential effect of a circulatory or respiratory diagnosis would be less than one fifth of the effect estimated by a population average model.
The significant differences in the coefficient estimates between the regressions at the 25th and 75th percentile indicates that assuming a constant mean shift, as in OLS, is not appropriate for these data. Despite this, studies of hospice length of use often present a population average effect or the mean adjusted difference between groups.31–33 The large differences (up to 60 days) between the estimated effects on patients with a short stay and patients with a long stay in hospice illustrate how a population average regression model could produce unreliable expectations for patients in the tails of the distribution. Given the observed differences in patient characteristics, capturing effect estimates specific to patients in the first and last quartile for hospice length of use may also be clinically relevant and support recommendations for practice. The differences in care utilization between patients with short and long hospice stays could be due to different disease trajectories (e.g., acute events vs. gradual decline), unnecessary care at the end of life (e.g., chemo in last month of life) among those with short stays, as well as reduction of inpatient use among patients with long hospice stays.
While over- or underestimation of the effect magnitude is a concern, the critical issue is that mean changes in length of use are not indicative of changes in appropriate hospice use. The optimum hospice length of use is unknown and appropriate timing of enrollment varies with the goals and needs of each patient. However, the perception that hospice enrollment occurred “too late,” suggesting a shorter than optimal use, is associated with more unmet needs and lower satisfaction with care.10,12 On the other end of the distribution, long length of use is correlated with live discharge from hospice care, which may indicate a longer than optimal use in some cases. 34 Quantile regression provides researchers with more information to examine the impact of potential policies and programs on appropriate hospice use by evaluating change associated with the program across the distribution of hospice days.
As policy makers seek to improve patient centered outcomes, quantile regression can help frame outcomes in the context of the patients' experience. Alternative methods frame effect estimates in relative terms using proportions, rates and odds ratios, which are not easily translated into an absolute number of hospice days for communication with policy makers and patients. Furthermore, the perceived value of a given difference in number of days varies over the distribution of hospice length of use. For a patient with an acute event that makes a short stay inevitable, an additional day in hospice may improve patient and care giver outcomes, particularly if that day is essential to move to their preferred site of death or to avoid an unnecessary transition in care.35,36 In binary representations, that day only counts if it is day seven. On the contrary, large increases may be less meaningful to a patient who has already benefitted from months in hospice. Although the hospice days for a given quantile vary, predicting a short or long stay is conceptually analogous to estimating distributional shifts in the first or last quartile for hospice days, which would facilitate the integration of quantile regression estimates in the context of existing policy discussions using binary thresholds.
The effect estimates associated with patient characteristics are confounded by unobserved factors such as patient education and attitudes, caregiver characteristics, and provider characteristics. For example, for profit hospice facilities have been associated with longer length of use. Thus, these estimates should not be interpreted as causal effects. Stays extending outside the calendar year are censored, reducing the range and underestimating the difference between the median and mean relative to an uncensored sample. Left censoring may underestimate the length of use for enrollments beginning in the previous year; however, this censoring would only impact the estimates if it were correlated with patient characteristics. Right censoring also impacts the slope functions at the 99th percentile because the potential for variation is restricted to 0 at day 365. Application in an uncensored sample would magnify the results demonstrated in this report.
The observed differences between quantile regression coefficients estimated at various percentiles compared with mean regression coefficients illustrate the influence methodological choices might have in the evaluation of factors influencing hospice length of use or cost. Models estimating mean marginal effects may disguise significant changes that occurred in the tails of the distribution or overstate the impact of a policy or program for a substantial constituency of hospice users. Estimating effects across the range of the hospice days provides a richer, more thorough description of these relationships that may be useful in predicting cost of care or evaluating interventions to increase appropriate hospice use.
Acknowledgments
Funding for this article was made possible, in part, by the Centers for Medicare & Medicaid Innovation (CMMI) through grant 1C1CM331331. Views expressed in written materials or publications and by speakers and moderators do not necessarily reflect the official policies of the Department of Health and Human Services, nor does any mention of trade names, commercial practices, or organizations imply endorsement by the US Government.
Footnotes
Authors Disclosure Statement
No competing financial interests exist.
References
Supplementary Material
Please find the following supplemental material available below.
For Open Access articles published under a Creative Commons License, all supplemental material carries the same license as the article it is associated with.
For non-Open Access articles published, all supplemental material carries a non-exclusive license, and permission requests for re-use of supplemental material or any part of supplemental material shall be sent directly to the copyright owner as specified in the copyright notice associated with the article.