
Abstract
Background:
Diabetes is increasingly prevalent globally, including in palliative care. Guidelines vary as to the ideal glycemic goals for patients near the end of life. The relationship between hyperglycemia and attributable symptoms late in life remains ill defined.
Objective:
To pilot the association between blood glucose level (BGL) and symptoms (nausea, fatigue, pain, and appetite) and mortality in palliative care patients with diabetes.
Design:
This prospective observational consecutive cohort study consisted of 17 patients with diabetes admitted to an inpatient palliative care unit. Repeat measures of BGL and symptom distress scores using the patient-reported Symptom Assessment Scale (SAS) were recorded during a five-month period as was patient mortality. The association between BGL and SAS domains was assessed using negative binomial regression and the association between mortality and high versus low BGL was determined using log-rank statistics and Kaplan–Meier curves.
Results:
All patients had malignancy: 15 had type 2 diabetes and 2 had steroid-induced diabetes. A total of 121 patient observation days were included in the analysis. BGL was inversely associated with patient-reported SAS for nausea (incidence rate ratio [IRR] = 0.83, 95% confidence interval [CI] = 0.70–0.99, p = 0.04), but not other symptoms. Insulin usage was also associated with decreased nausea (IRR = 0.24, 95% CI = 0.09–0.60, p = 0.002). Survival did not differ between low- and high-BGL groups.
Conclusion:
These findings warrant a larger multisite consecutive cohort study and a re-exploration of current clinical practice. Ultimately, interventional trials comparing strict versus more liberal glycemic control on symptom management and survival are the ideal design to better understand differing levels of glycemic control at the end of life.
Introduction
The treatment goals of diabetes in the whole population include avoiding long-term micro- and macro-vascular complications, metabolic crises, and symptoms of dysglycemia while avoiding sudden death and symptoms from hypoglycemia. Since patients with limited prognosis will not develop long-term vascular complications, goals of care change, especially for hyperglycemia.1,2
Expert guidelines for managing diabetes in hospice/palliative care recommend achieving blood glucose levels (BGLs) that result in the least burdensome care, and best symptom control. This involves more liberal glycemic goals and diet, and less intensive monitoring as prognosis worsens, especially in type 2 diabetes. 2 In particular, avoiding hypoglycemia is a key goal given the distressing symptoms it causes, and its potential for sudden death. 1 The rationale for upper limits to BGL targets is not well established, and suggested targets vary,1–4 or specific targets are not mentioned. 5 The goals of care relating to hyperglycemia are to avoid symptomatic polydipsia, 6 polyuria, 7 worsened cognitive function,8,9 presyncope, vertigo, gastrointestinal symptoms (nausea and dysgeusia),10,11 and poor mood including anxiety.12–14 It is uncertain whether these symptoms occur in hyperglycemia at the end of life. The aim of our study was to assess whether there was any association between BGLs and relevant symptoms of appetite, nausea, fatigue, and pain for these patients. We also analyzed the association between BGLs and mortality.
Methods
Study design
We conducted a prospective observational consecutive cohort study of 17 people with type 2 diabetes (including steroid-induced diabetes) admitted to a single palliative care unit. Patients were included if their medical admission record, pharmacist's notes, discharge summaries, BGL readings, or medication lists were diagnostic of diabetes.
Patients were recruited between December 2015 and April 2016 and followed until May 2016. Basic demographic data were collected at study entry. BGLs were measured by nursing staff using finger-prick testing as part of usual care. Clinical data included frequency of BGL recording, maximum BGL for a particular day, mean BGL, and the occurrence of hypoglycemic episodes. Symptom Assessment Scale (SAS) scores 15 were also collected contemporaneously on 0–10 numerical rating scales (NRS) for nausea, fatigue, pain, and appetite, with a score of 0 denoting no symptom and 10 denoting highest possible score for that symptom. Australian-modified Karnofsky Performance Score (AKPS), 16 phase of illness, 17 glycosylated hemoglobin, estimated glomerular filtration rate using the CKD-EPI method, 18 nature of diabetic illness, primary life-limiting diagnosis, use of hypoglycemic medications, and survival data were also collected. There were no patient exclusion criteria, although data where a hypoglycemic episode (BGL <4 mmol/L) occurred were excluded from the analysis as it was felt that symptoms attributable acutely to hypoglycemia may be misattributed to hyperglycemia due to any rebound phenomenon. Days with incomplete recording of SAS data were also excluded and no data were imputed.
To detect a Pearson correlation of r = 0.5 between SAS nausea and mean BGL would require a sample size of 31 independent observations for 80% power at a type 1 error rate of alpha = 0.05. Given the repeated measures nature of the data, and an average of ∼8 observations per person together with an estimated intra-class correlation coefficient for maximum BGL of ∼0.5, the design effect (DE) of the study was DE = 1+((8.1) *0.5) = 4.5, this gave an effective sample size of n = 118/4.5 = 26.
Statistical analysis
Analysis was performed using Stata (version 14.2; StataCorp, Texas). Given the non-normal distribution of the SAS scores, the association between SAS and BGL was assessed in univariate and multivariate analyses using a negative binomial regression model (with robust standard errors and clustering by patient) with the SAS score as the dependent variable. The resulting incidence rate ratio (IRR) provides the relative change in the SAS for a unit (or category) increase in BGL. In multivariate analysis, SASs were used as the dependent variable, mean BGL as the exposure variable, and adjustment was performed for age, gender, AKPS, and illness phase (using four categories). BGL was modeled as both a categorical variable (with cutoff points at 5, 10, 15, 20, and 25 mmol/L) and a continuous variable. Differences in the SAS scores for nausea were compared between patients using insulin, oral hypoglycemic agents, and dexamethasone dose, using a negative binomial regression model. Survival analysis was performed using the log-rank test with mortality rates compared between patients with mean BGL of >10 mmol/L with those with mean BGL of <10 mmol/L, which was the median of means. Two-tailed tests of significance were performed for each outcome with results for BGL as a categorical variable considered significant if the global p-value was <0.05.
Ethics approval was gained for the project through the Southern Adelaide Clinical Human Research Ethics Committee (OFR no. 515.15). This article is reported using the Strengthening the Reporting of Observational Studies in Epidemiology guidelines. 19
Results
A total of 121 BGL observations for the 17 individual patients were used in the analysis. The number of BGL recordings per patient ranged between 1 and 27. Table 1 gives the baseline characteristics of the subjects who were predominantly patients with type 2 diabetes (88%). All patients had a primary diagnosis of locally advanced or metastatic malignancy [lung (five), gastrointestinal malignancy (five), lymphoma (three), mesothelioma (one), endometrial cancer (one), melanoma (one), and breast cancer (one)].
Baseline Characteristics (n = 17)
AKPS, Australian-modified Karnofsky Performance Score; BGL, blood glucose level; HbA1c; SAS, Symptom Assessment Scale; SD, standard deviation.
Over the study period, the mean (±SD) BGL was 11.9 mmol/L (±5.1). In multivariate regression with BGL treated as a categorical variable, there were a number of significant differences between several BGL categories for fatigue, pain, and nausea (Table 2). In particular, BGLs of 5.1–10, 15.1–20, and 20.1–25 mmol/L were associated with significantly lower SAS scores for nausea. Older age also predicted lower scores for nausea (IRR = 0.95, 95% confidence interval [CI] = 0.90–0.99, p = 0.04). Insulin use was associated with significantly lower SAS scores for nausea (IRR = 0.24, 95% CI = 0.09–0.60, p = 0.002), and the mean (SD) SAS score for nausea in patients taking insulin was 0.2 (0.7), and was 0.9 (1.8) in those not taking insulin. In multivariate analysis, when BGL was treated as a continuous variable, daily mean BGL was significantly and negatively associated with SAS for nausea (IRR = 0.83, 95% CI = 0.70–0.99, p = 0.04; Fig. 1). The Kaplan–Meier curve for survival is shown in Figure 2—there was a trend toward longer survival in the higher (≥10 mmol/L) BGL group than in the lower (<10 mmol/L) BGL group (median survival time = 21 days vs. 8 days, respectively, p = 0.10).
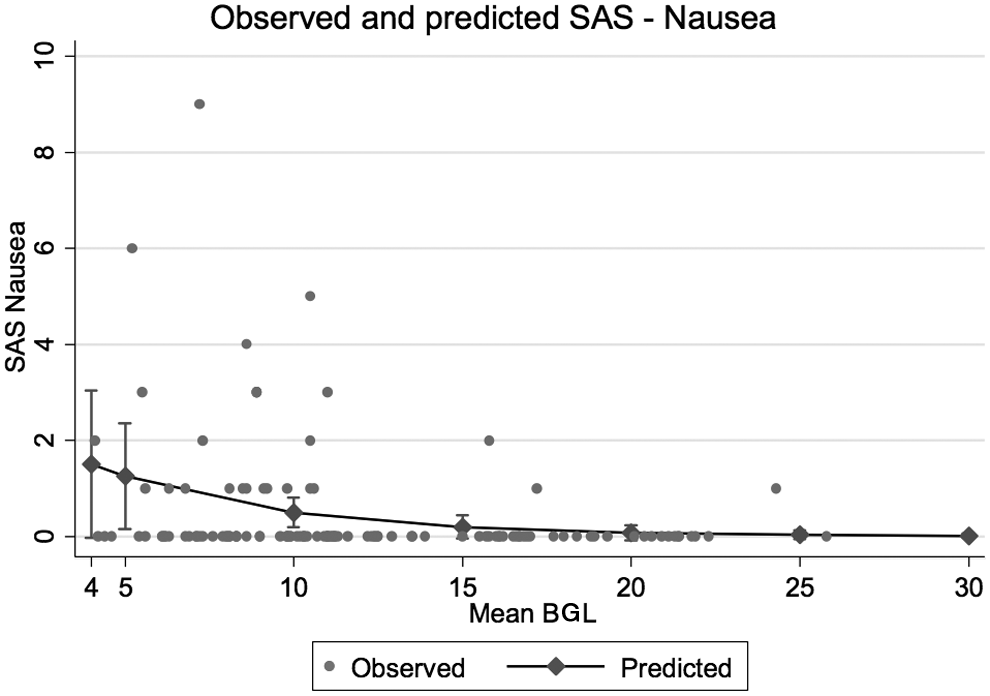
Observed and predicted SAS—nausea. BGL, blood glucose level; SAS, Symptom Assessment Scale.

Kaplan–Meier curve for survival comparing patients with lower (n = 9) versus higher (n = 8) BGL, blood glucose level.
Adjusted Incidence Rate Ratios (95% Confidence Interval) for Symptom Assessment Scale Scores Using Pre-Specified Mean BGL Strata
Using multivariate negative binomial regression with adjustment for age, gender, AKPS, and phase.
p < 0.01.
p < 0.05.
NA.
Discussion
This article describes associations between hyperglycemia and key symptoms in a group of palliative care patients near the end of life. This observational study cannot imply causality, but describes associations. This is an addition to the literature regarding diabetes in hospice/palliative care, as key guideline articles cite symptomatic rationales for glycemic goals,1,3,4,20 without necessarily having a clear understanding of what level of hyperglycemia is likely to relate to important symptoms for this group of patients.
The key finding from this article is that common problematic symptoms of nausea, fatigue, pain, and loss of appetite are not associated with hyperglycemia at levels seen in this study population. Hyperglycemia was found to be inversely associated with nausea scores. This association was independent of other potential confounders including age, gender, medication use, and AKPS. The reason for this is unclear, as research performed in a more general population suggests that poor glycemic control is associated with more symptoms of nausea. 10 One possibility is that diabetic neuropathy contributes to lower awareness of cancer and medication-driven symptoms such as nausea. Another possibility is that we observed a cohort whose lower BGLs were predictive of death, and that this was correlated with greater nausea scores. This seems unlikely however, given that nausea severity and prevalence are mostly stable toward the end of life. 21 It could be that hyperglycemia is associated with changes to satiety hormones in these patients at the end of life, making nausea less likely. Amylin, for example, which in normal situations is cosecreted with insulin, is thought to delay gastric emptying and induce nausea through its effects on the area postrema—the chemoreceptor trigger zone. 22 Amylin secretion is thought to be low in patients with type 2 diabetes, particularly those requiring exogenous insulin. 23 This hypothesis could fit with one of our other observations, that those patients who were treated with insulin also had lower nausea scores. It could be entertained that amylin insufficiency alone or in combination with a decrease in other satiety-related hormones leads to a total of less stimulation of the area postrema in patients with more advanced type 2 diabetes, and consequently less nausea. This may also apply to older patients in this cohort, and we observed an association between older age and lower nausea scores.
Although not adequately powered to assess the impact on mortality, our sample showed a trend toward increased mortality for patients with lower mean BGL. This observation deserves further enquiry, especially given that hyperglycemia has been associated with poorer outcomes for cancer patients.24–27 It may be that in the last weeks of life, hyperglycemia predicts longer survival, due to greater glycogen stores, or relatively intact hypothalamic–pituitary–adrenal axis function.
Strengths of this study are the diversity of clinical data collected that allowed adjustment for a number of important potential confounders, consecutive recruitment design minimizing the risk of selection bias, and the use of a well-validated tool to assess symptoms. Limitations include no assessment of thirst—a well-recognized problematic symptom potentially influenced by hyperglycemia 28 and observation of a low symptom burden compared with some other published studies. 29 This SAS is not validated for use in diabetes-related symptoms, but we were unable to find a suitable patient-reported outcome measure that would fit this purpose exactly. The SAS also does not measure distress due to cognitive dysfunction, or mood disturbance, which are also relevant symptoms. Despite having an adequate number of total observations for our power calculation, the number of patients studied was lower than expected, which is also a limitation.
Conclusion
This pilot study should inform the rational design of a larger prospective study into the correlations between hyperglycemia and symptom burden in patients with type 2 diabetes at the end of life, with the inclusion measures of thirst, cognition, and mood in the analysis—as well as interventional trials comparing stricter versus more lenient control of blood sugar levels in this patient group. It also questions whether patients toward the end of life experience significant symptomatic burden as a result of high BGLs, independent of metabolic crises such as diabetic ketoacidosis, hyperglycemic hyperosmolar state, or hypoglycemia.
Footnotes
Acknowledgment
This research did not receive any specific grant from funding agencies in the public, commercial, or not-for-profit sectors.
Author Disclosure Statement
Dr. Currow reports an unrestricted research grant from Mundipharma, is an unpaid member of an advisory board for Helsinn Pharmaceuticals, and has consulted Specialist Therapeutics and Mayne Pharma and received intellectual property payments from Mayne Pharma.