
Abstract
Introduction:
Pediatric palliative care (PPC) programs have grown in size and number at academic children's hospitals in the United States for the past 20 years. Little is known about the relationships between program workforce staffing, billing and coding practices, clinical service requirements for billing providers, and sustainability of program models for billing providers.
Methods:
The authors contacted a convenience sample of 10 PPC program leaders at academic children's hospitals in the United States. Program leaders were asked to provide information about billing provider full-time equivalent (FTE) staffing, billing and coding practices, and productivity metrics for a three-month period, from January 1 to March 31, 2017.
Results:
Ten programs participated in the convenience sample survey, and seven provided information about billing and coding practices. For the seven programs that provided evaluation and management data, calculated estimate of mean work Relative Value Unit (wRVU) production per 1.0 FTE per year was 1626. Calculated estimate of consultations per 1.0 FTE per month was 15. Calculated estimate of total clinical encounters per 1.0 FTE per month was 70.
Conclusions:
The relationships between PPC billing provider productivity and clinical workload are complex and vary widely among a convenience sample of academic PPC programs. Given the high burnout rates in the field, efforts should be made to more clearly define these relationships to promote sustainability of both billing and nonbilling PPC providers.
Introduction
As the pediatric palliative care (PPC) subspecialty has grown, more than two-thirds 1 of children's hospitals advertise the presence of PPC services. Programs at academic institutions face challenges, including adding teaching, scholarship, and administrative duties to the provider's clinical responsibilities. 2 Clinical productivity metrics reflecting inpatient and outpatient practice for PPC academic programs are lacking, despite this information's importance to hospital administrators and program directors. National organizations, such as the Center to Advance Palliative Care, collect productivity data for adult palliative care programs,3–5 with data collection among pediatric programs in process. To begin filling this gap in knowledge about PPC program productivity, the authors created and distributed a convenience sample survey to 10 PPC programs at academic children's hospitals in the United States. In 2017, Kaye et al. 6 discussed the elusive nature of objective productivity metrics for PPC providers. The authors acknowledged the importance of utilizing wRVU, which contribute to the United States Medicare reimbursement formulas for physician services, while suggesting additional metrics. These included average number of consultations per month, clinical encounters per billing provider per month, and patient encounters per month. This survey attempts to capture information from established PPC programs about the first two additional suggested metrics.
Methods
Authors solicited survey responses from a convenience sample of 10 established PPC programs in the United States to obtain information about clinical productivity at academic children's hospitals. Programs provided demographics and full-time equivalent (FTE) position composition for billing providers. They also provided information about billing provider evaluation and management (E&M) codes use during January 1 to March 31 of 2017. The authors extrapolated E&M information from this period to estimate annual clinical productivity. The authors used the 2017 American Academy of Pediatrics (AAP) Resource-Based Relative Value Scale (RBRVS) provided by Centers for Medicare and Medicaid Services (CMS) to estimate annual wRVU production for each billing provider. For the purpose of this survey, clinical FTE was defined as the FTE dedicated to clinical patient care responsibilities, excluding administrative, research, and teaching time.
Results
Ten academic children's hospital PPC programs provided survey responses, with seven programs completing the survey in full. Three programs reported that they either did not have access to or know how to obtain data about E&M code use from their institution. Hospital sizes of the seven programs that completed surveys ranged from 128 to 639 acute care beds (median 315), with between 2 and 8 PPC billing providers (including physicians and nurse practitioners) at each institution. Seven (25%) physicians' clinical FTE was reported at 0.75–1.0, 11 (39%) physicians at 0.5–0.75, and 10 (36%) physicians at 0.2–0.5. Six Advance Practice Registered Nurse (APRN) providers were reported at 0.8–1.0 clinical FTE. Respondents indicated that nonclinical time was divided among administrative, educational, research, or quality improvement activities. Definition of clinical FTE with regard to inpatient or outpatient service weeks, call, and weekend coverage was widely variable, and no conclusions could be drawn from this sample.
The most commonly utilized E&M codes by PPC billing providers in this sample were, in order of decreasing use: 99233, 99232, 99231, 99254, 99255, 99253, 99215, 99243, 99244, and 99252 (Fig. 1). Data from E&M use were extrapolated to estimate annual wRVU production for individual billing providers using RBRVS, and all calculated estimates assume 1.0 clinical FTE per billing provider. For the seven programs that provided E&M data, calculated estimate of mean wRVU production per 1.0 FTE per year was 1626 (Fig. 2). Four (40%) responding programs reported that their institution holds the PPC service to a wRVU benchmark that is used for evaluation and hiring of billing providers. The mean institutional annual wRVU production estimate per 1.0 FTE for these four specific programs was 1740, and the annual wRVU expectation per 1.0 clinical FTE was 2432. Calculated estimate of consultations per 1.0 FTE per month was 15, and calculated estimate of total clinical encounters per 1.0 FTE per month was 70 (Table 1).
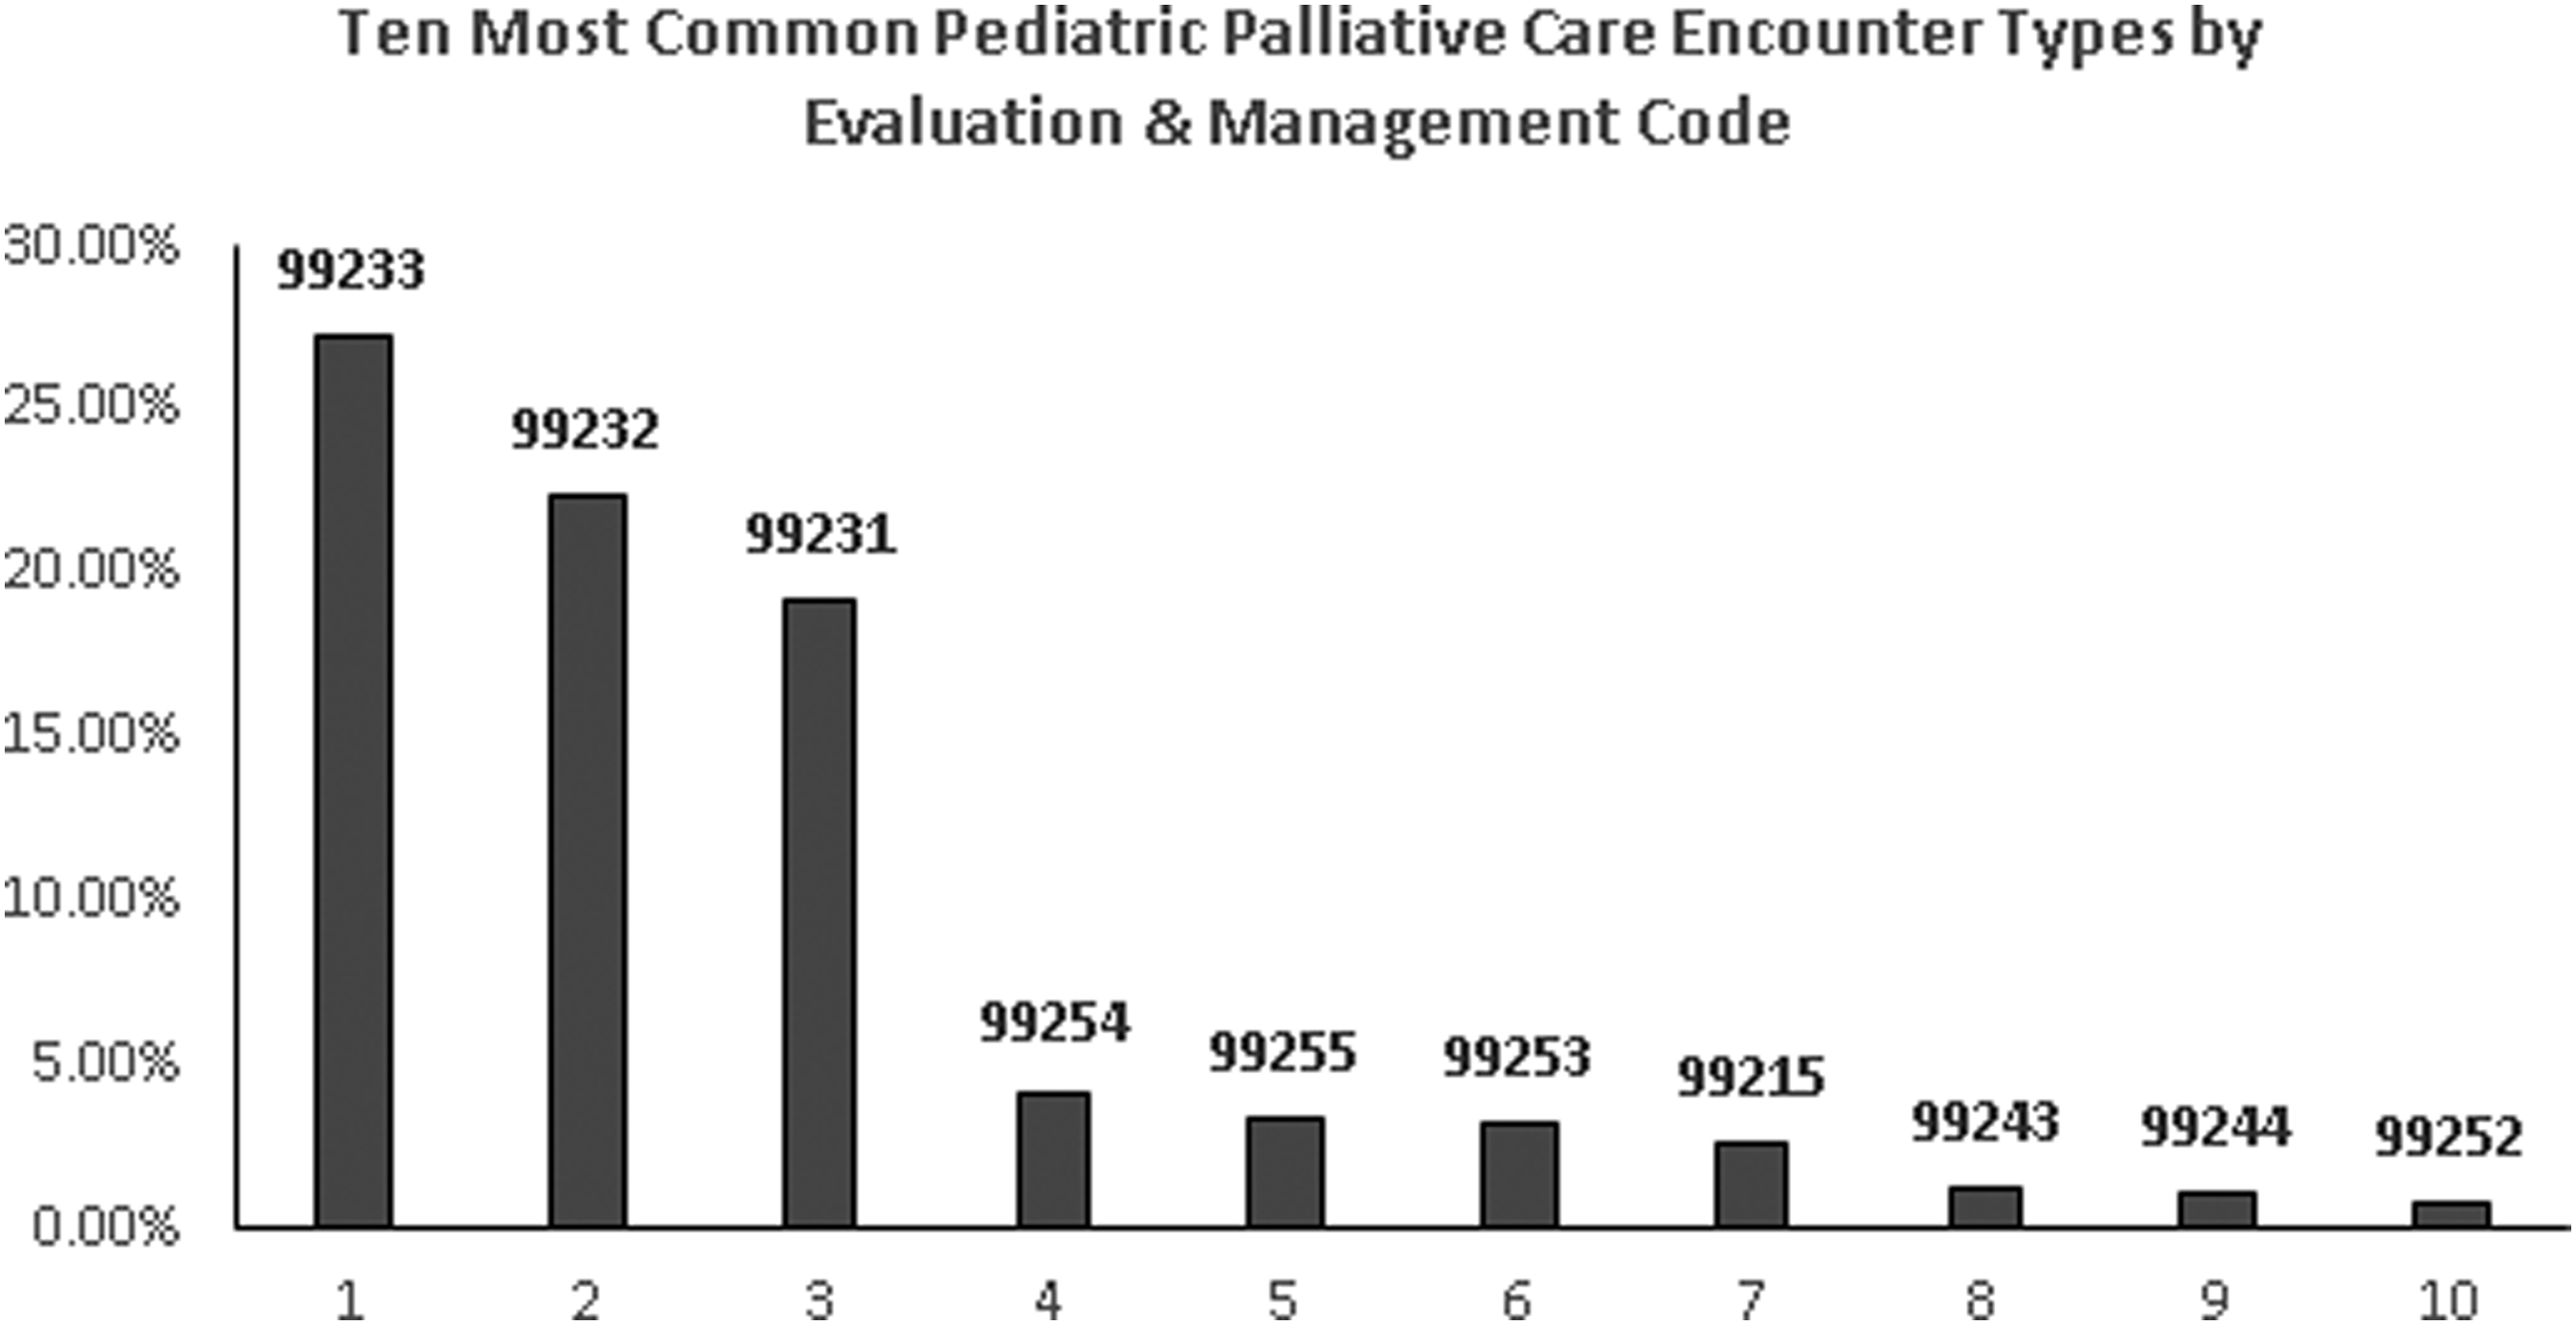
Ten most common pediatric palliative care encounter types by evaluation and management code.

Estimated annual wRVU per 1.0 clinical FTE. FTE, full-time equivalent; wRVU, work Relative Value Unit.
Clinical Productivity Metrics among Pediatric Palliative Care Services
Encounter number represents data provided by programs from first quarter (January 1–March 31) 2017.
Encounter data were extrapolated to estimate annual wRVU production for individual billing providers using RBRVS, and all calculated estimates assume 1.0 clinical FTE per billing provider.
FTE, full-time equivalent; RBRVS, resource-based relative value scale; wRVU, work Relative Value Unit.
Discussion
This convenience sample survey attempted to better understand clinical productivity metrics for PPC programs at 10 academic children's hospitals in the United States. The survey responses and calculations are not intended to accurately represent productivity data among all PPC programs and should not be construed as such. The information represents an attempt to better define and identify helpful PPC productivity metrics for use by program directors and hospital administrators.
Respondents reported widely variable clinical service requirements per one (1.0) clinical FTE. For example, some programs consider teaching and administrative responsibilities part of clinical duties rather than separate FTE. These data reflect the diverse service requirements, program staffing designs, and call structures across institutions with no identified standards that can be applied broadly. Future projects will attempt to better elicit and standardize billing provider clinical service requirements.
It is important to note that all survey participants perceive their teams to be operating near, at, or over clinical workload capacity, with some seeking institutional support for additional billing providers to meet clinical demand. It is possible that over time PPC programs, like other subspecialties, will be expected to meet wRVU benchmarks. When wRVU targets were set for PPC providers in this small survey, the average 2432 wRVU per 1.0 billing provider FTE was higher than the mean of 1740 wRVU, when clinical FTE (on average 0.735) is utilized rather than total FTE. Participating programs shared that wRVU benchmarks were created using multiple sources, including other pediatric subspecialties, adult palliative medicine data, and statewide PPC provider normative data. To most accurately measure clinical productivity, PPC programs will need more published wRVU data to help institutions calculate realistic benchmarks.
Although this study highlights the need for further study and cannot provide accurate benchmark data, there are three specific productivity measures that PPC programs may find useful to consider after reviewing the data in this convenience sample. First, for programs seeking wRVU data, consider measuring wRVU per clinical FTE and separate time for nonclinical duties. Second, in agreement with Kaye et al., the number of monthly consultations and overall encounters per 1.0 clinical FTE may be helpful to measure. Third, we recommend that programs routinely review the frequency and distribution of E&M code use for their services. In addition, the ratio of new consultations to overall encounters in this sample (mean 0.23, median 0.172) may be helpful as workforce plans are being developed, because, for example, an influx of new consultations due to initiation of a “trigger consult” may decrease follow-up encounters for other patients, potentially compromising the overall quality of care provided by a PPC program. 7
There are clear limitations to this small convenience sample survey. It is limited in scope as only 10 programs were surveyed and only 7 completed the survey in its entirety. The data do not accurately reflect all PPC programs across the United States as only academic children's hospitals were surveyed. The survey attempted to define clinical service staffing requirements as related to FTE, although as previously discussed there is too much variability to draw conclusions about that metric using the data from this sample. The productivity data were extrapolated from only three months of E&M codes, and may not reflect true annual clinical productivity for a PPC program. There is no other published PPC program productivity metric information available to provide comparison or context for the information and sample calculations provided by this survey. Lastly, it is important to highlight two secondary effects that a publication about measuring value through clinical productivity may have on institutions and PPC programs. The first is shifting attention from what is high value to patients (complex communication and symptom management) to what is high value to the health system (changing clinical practice to generate more wRVU). The second is the omission of nonbilling PPC providers from the conversation about value, when the reality is that high-quality interdisciplinary PPC would not be possible without the support and expertise they provide.
Further studies may include measuring wRVU per encounter per billing provider, which may help to measure the optimization of billing and coding practices. In addition, a general consensus among PPC programs about the number of service weeks and call structure per 1.0 clinical FTE may prove useful to programs both for measuring productivity and developing a better understanding of provider sustainability. As most PPC programs in this survey indicate both a high clinical workload and the perception of operating at or over workload capacity, current reported volumes are unlikely to be sustainable over time. Given that the prevalence of burnout8–10 among hospice and palliative medicine clinicians has been estimated as high as 62%, the concept of sustainable clinical workload expectations in PPC is one that deserves serious consideration.
Conclusion
Little is known about the relationships between PPC program workforce staffing, billing and coding practices, clinical workload requirements, and sustainability of program models for billing providers. The relationships between PPC billing provider productivity, clinical workload, and sustainability are complex, but, given the high burnout rates in the field, efforts should be made to more clearly define these relationships to promote sustainability of both billing and nonbilling PPC providers.
Footnotes
Author Disclosure Statement
No competing financial interests exist.
The views expressed in this article represent those of the authors alone and not those of the institutions listed earlier.