
Abstract
Background:
The concept of cost-effectiveness is necessary for optimal utilization of limited health care resources. However, few studies have assessed the cost-effectiveness of palliative care using quality-adjusted life years (QALYs), considered common outcomes in health economics.
Objective:
We aimed to perform a cost-effectiveness analysis of palliative care for terminal cancer patients by using QALYs.
Design:
A retrospective cohort study was performed.
Setting/Patients:
We included 401 patients with stage IV cancer, who were hospitalized and died at a Japanese general hospital during the period April 2014 to March 2019.
Methods:
Using the hospital database, we compared the total admission costs and QALYs based on pain levels of patients admitted to the palliative care (PC) department with those of patients admitted to other usual care (UC) departments. Patients in each group were matched through propensity scores to reduce bias. Bootstrapping estimated the 95% confidence intervals (95% CIs) and the probability that PC was more cost-effective than UC.
Results:
After matching, 128 patients in each group were selected. Converting 1 U.S. dollar (USD) to 100 Japanese yen, PC reduced mean total admission costs by 1732 USD (95% CI: 1584–1879) and improved mean health benefits by 0.0028 QALYs (95% CI: 0.0025–0.0032) compared with UC. Based on the Japanese cost-effectiveness threshold, there was an 82% probability that PC was more cost-effective than UC.
Conclusions:
Our results indicated that admission of terminal cancer patients to the PC department was associated with improvement in cost-effectiveness. This finding could support the introduction of palliative care for terminal cancer patients. Our study was approved at St. Luke's International University (receipt number 18-R061 and at the Graduate School of Pharmaceutical Sciences, The Univesity of Tokyo (receipt number 31–29).
Introduction
Cancer mortality is rapidly increasing worldwide. In 2018, 9.6 million people died of cancer globally. 1 Aggressive treatments for advanced cancer patients may prolong life by several months, 2 but they are expensive and sometimes reduce the quality of life (QOL). 3 Conversely, the introduction of palliative care to advanced cancer patients improves their symptom control,4,5 thereby offering them greater QOL6,7 and reducing hospital costs4,8–11 while allowing the disease to run its natural course.
In Japan, cancer has been the leading cause of death since 1981; in 2018, 373,584 people died of cancer. 12 However, palliative care units (PCUs) have been underutilized for terminal cancer patients. In fiscal year 2017, the death rate of cancer patients at PCUs was 13.4%, whereas their death rate at other units (e.g., intensive care unit) was 70.6%. 13 Under these circumstances, total medical costs in Japan reached a record high of 43 trillion Japanese yen (JPY) in fiscal year 2017, approximately double the amount reported in fiscal year 1990, 12 which may be due to the increasing sophistication and complexity of health care. One reason for the increase in medical costs is the introduction of expensive drugs, such as monoclonal antibodies in the oncology field.
Thus, adopting the concept of economic analysis in the advanced cancer treatment policy is needed while also maintaining respect for the feelings of patients and their families to improve the nation's fiscal health.
In cost-effectiveness analysis, quality-adjusted life years (QALYs) are often used as health outcomes. 14 Japan has introduced the concept of cost-effectiveness using QALYs to assess drug prices since April 2019. In fact, some studies have reported the cost-effectiveness of palliative care in comparison with other usual care by using QALYs.15–19 However, such studies in Japan only showed the cost-effectiveness of specific drugs for specific cancers compared with best supportive care.15,16 Research at an overseas hospital assessed the cost savings 11 and QALY improvement 19 of PC compared with other usual care (UC) for patients, including cancer and noncancer patients, but with the limitation that the QALY data were predicted using just the mean of other studies rather than each patient's status.
In our study hospital, the PC department does not perform direct cancer therapy (e.g., chemotherapy, radiation, and surgery). Instead, other UC departments (e.g., the medical oncology department) perform such therapies.
In this study, we aimed to examine costs and QALYs based on each patient's status of PC compared with other UC after adjusting for patient background factors, using a general hospital database in Japan.
Methods
Data sources and setting
A retrospective cohort study of terminal cancer patients was conducted using the hospital administrative database at St. Luke's International Hospital in Tokyo, Japan. Cost data were collected from the hospital's cost accounting system, HOPE/X-W (Fujitsu Limited, Japan). The other clinical data were collected from the hospital's computerized medical record system, HOPE/EGMAIN-GX (Fujitsu Limited).
We compared costs and cost-effectiveness for patients admitted to the PC department with those admitted to other UC departments.
The study protocol was approved by the research ethics board at St. Luke's International University (Receipt number: 18-R061) and at the Graduate School of Pharmaceutical Sciences, The University of Tokyo (Receipt number: 31-29), Japan. Individual patient informed consent was not obtained because it is not required for the use of encoded administrative health data.
Sample
Patients diagnosed with stage IV cancer before admission and who were hospitalized and died at St. Luke's International Hospital during the period April 2014 to March 2019 were eligible. We excluded patients who declined to participate, were under the age of 18, were transferred from UC to PC or from PC to UC during hospitalization, or who died of causes other than cancer. Patients transferred during hospitalization were excluded because these patients received both UC and PC. Patients who died of causes other than cancer were also excluded because it was possible that their doctor selected a care approach for noncancerous diseases. In addition, patients with missing data were excluded.
Costs
We measured total medical costs based on Japanese medical fee points (total costs), total costs of drugs based on Japanese drug prices (pharmacy costs), total costs of radiation therapy based on Japanese medical fee points (radiation costs), and total costs of surgery based on Japanese medical fee points (surgery costs). We calculated the costs per admission and per day of the admission period for all four types.
Regarding the currency unit, 1 U.S. dollar (USD) was converted to 100 JPY in this study.
Health benefits
We assessed the health benefits of patients by estimating their QALYs during hospitalization. The QALY data of patients were calculated by integrating their QOL scores with their admission period. In that case, the QOL score should be a value rated on a scale between 0 (dead) and 1 (perfect health). 14 However, Japanese hospitals do not measure such QOL scores in general practice. Thus, it is necessary to use clinical indicators that could be substitutes for QOL scores in the Japanese health care system.
Regarding the QOL score for advanced cancer patients, pain management is known to be an important clinical factor. 20 Japanese hospitals generally use the Numerical Rating Scale (NRS), the most commonly used pain scale in the health field, to assess pain management.21,22 In our study hospital, nurses asked patients to rate their pain level once a day or more when medically necessary.
By collecting patients' NRS scores from admission to death, we estimated their mean NRS score (pain score) as a surrogate endpoint for the QOL score. The NRS score on admission was defined as the score that patients initially reported after admission; the NRS score at death was defined as the patient's last reported score after admission. For example, if a patient's response was NRS = 0 at 0.5 day and NRS = 1 at 1.5 days and died 2 days after admission, the pain score was calculated as follows: [(0 + 0)(0.5 − 0)/2 + (0 + 1)(1.5 − 0.5)/2 + (1 + 1)(2 − 1.5)/2]/2 = 0.5.
Moreover, a previous study demonstrated the correspondence between QOL scores and NRS scores for patients with neuropathic pain (e.g., NRS 0 = QOL 0.820, NRS 1 = QOL 0.807, and NRS 10 = QOL 0.334). 23 Hence, we also estimated the QALY data of patients by converting NRS scores to QOL scores. The QOL score on admission (initial QOL) was defined as the QOL score based on the NRS score that patients initially reported after admission; the QOL score at death was set to 0 based on the definition. 14 For example, if a patient's response was NRS = 0 at 0.5 day and NRS = 1 at 1.5 days and died 2 days after admission, the QALY was calculated as follows: [(0.820 + 0.820)(0.5 − 0)/2 + (0.820 + 0.807)(1.5 − 0.5)/2 + (0.807 + 0)(2 − 1.5)/2]/365 = 0.0039.
In addition, the number of responses to NRS questions per day was measured because the frequency of responses might be related to the accuracy of pain scores and QALY data.
Covariates
We measured covariates based on the date of admission, including age, sex, marital status, presence of children, cancer type, medical history, and initial QOL. Age,24,25 marital status,26–28 children living at home, 29 and cancer type 28 were previously shown to explain most of the variation in cost-effectiveness. We speculated in advance that the other variables (sex, medical history, and initial QOL) would be associated with cost-effectiveness.
Regarding cancer type, we measured the presence of the top 10 cancer types causing mortality among Japanese people 12 because it was unknown which cancer types influenced the outcome.
Statistical analyses
We used the independent-samples t test to compare the mean of continuous variables (such as age) and Fisher's exact test to compare the proportions of categorical variables (such as sex) between UC and PC.
To further evaluate robustness, UC and PC patients were matched 1:1 without replacement on the logit of propensity scores. We used matching with calipers of width 0.2 standard deviations of the logit of the propensity score. 30 Standardized differences were assessed for balance in the baseline characteristics of treatment groups after matching. 31 A standardized difference of less than 0.1 in a covariate was considered to represent good balance between the groups. 32 Our propensity score model was adjusted for the following covariates: age, sex, marital status, presence of children, cancer type (lung, colorectal, stomach, pancreas, liver, gallbladder and bile ducts, breast, malignant lymphoma, prostate, esophagus, and others), medical history (history of chemotherapy, radiation therapy, and/or surgical intervention), and initial QOL.
The incremental cost-effectiveness ratios were estimated by dividing the additional mean total costs (incremental costs) by the additional mean QALYs gained (incremental benefits). To estimate the 95% confidence interval (95% CI) for incremental costs and benefits, we conducted a nonparametric bootstrapping method with 1000 replicates. Each bootstrap iteration included the cost and QALY of the matched pair. The results for PC compared with UC are presented as a scatterplot on the cost-effectiveness plane and as cost-effectiveness acceptability curves.
The threshold for significance was p value <0.05. All statistical analyses were conducted using JMP Pro, version 15.0.0.
Results
Matching
During the study period, 215 UC patients and 224 PC patients were enrolled. However, patients with missing NRS score data were excluded because we could not estimate their QALY data. Thus, 200 UC patients and 201 PC patients were selected for the analysis. A total of 128 UC and PC patients were matched 1:1 on the logit of propensity scores (Fig. 1). Before matching, the differences between patient groups were significant for 4 of the 19 baseline characteristics. PC patients had lower rates of lung cancer (UC: 30.5% vs. PC: 15.9%, p < 0.001) and malignant lymphoma (5.5% vs. 1.5%, p = 0.032), but higher rates of pancreatic cancer (9.0% vs. 16.9%, p = 0.025) and a medical history of radiation therapy (24.0% vs. 36.3%, p = 0.009) compared with UC patients. After matching, there were no significant differences in the measured clinical characteristics between groups. The standardized differences of all characteristics were under 0.1 (Table 1). We performed the analysis using the matched data.
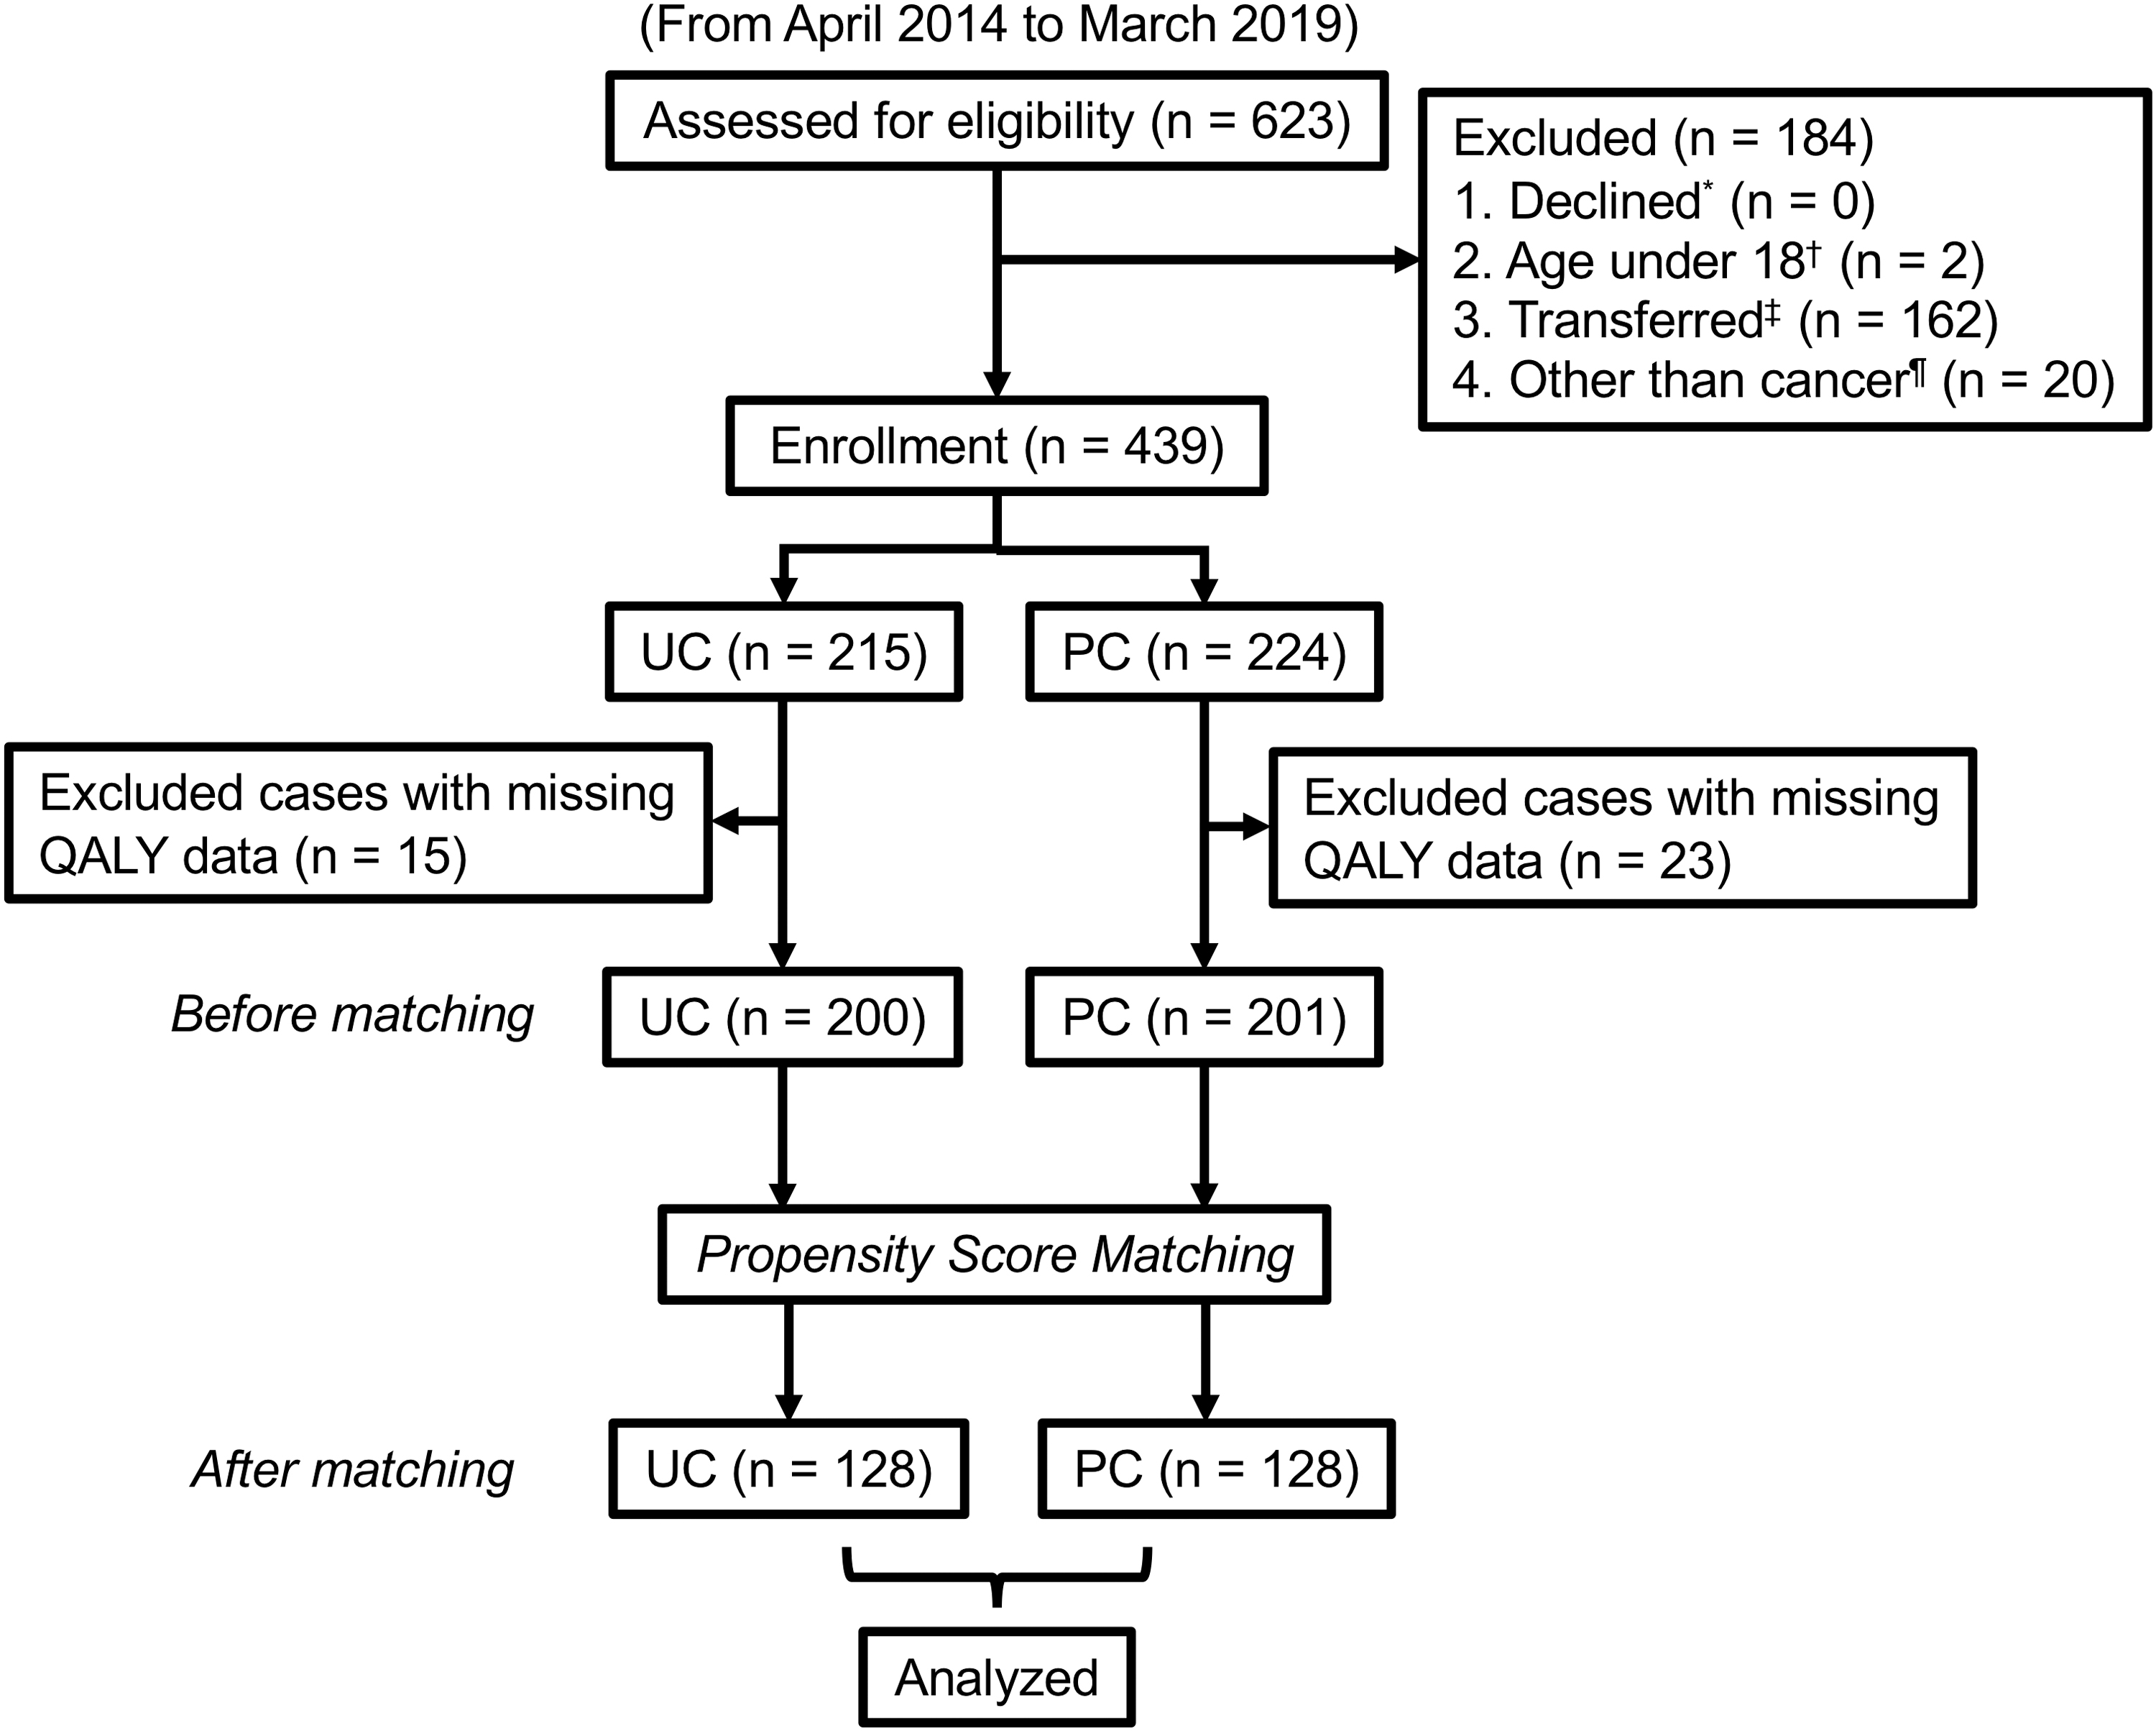
Flow diagram of enrollment of the study participants. PC, palliative care; QALY, quality-adjusted life year; UC, usual care. * Declined defines patients who declined to participate. † Age under 18 defines patients under the age of 18. ‡ Transferred defines patients who were transferred from UC to PC or from PC to UC during hospitalization. ¶ Other than cancer defines patients who died of causes other than cancer.
Clinical Characteristics of Patients Before and After Propensity Score Matching
p Values were calculated with the use of the independent-samples t test for continuous variables and Fisher's exact test for categorical variables.
Medical history was defined as the rate of the patients who underwent chemotherapy, radiation therapy, or surgical intervention for cancer before admission.
Initial QOL was defined as the QOL score based on the pain level that patients initially reported after admission.
PC, palliative care; QOL, quality of life; SD, standard deviation; Std. diff, standardized difference; UC, usual care.
Costs
Compared with UC, PC showed a downward trend in total costs per admission (14,837 USD [95% CI: 10,735–18,939] vs. 13,166 USD [95% CI: 11,067–15,264], p = 0.47). Moreover, compared with UC, there was a trend toward longer survival on admission to PC (22.9 days [95% CI: 19.8–26.2] vs. 25.9 days [95% CI: 21.8–28.3], p = 0.33). Hence, PC was significantly more inexpensive than UC in total costs per day (841 USD [95% CI: 672–1009] vs. 586 USD [95% CI: 548–624], p = 0.004). Compared with UC, PC also had a significant reduction in pharmacy costs per day (117 USD [95% CI: 81–152] vs. 65 USD [95% CI: 56–75] p = 0.006) and surgery costs per day (4.3 USD [95% CI: 1.0–7.7] vs. 0 USD [95% CI: 0–0], p = 0.012) and demonstrated a downward trend in radiation costs per day (3.0 USD [95% CI: 0.9–5.2] vs. 1.1 USD [95% CI: 0.1–2.1], p = 0.12) (Table 2).
Costs from Admission to Death after Propensity Score Matching
We converted 100 JPY to 1 USD.
p Values were calculated with the use of the independent-samples t test for continuous variables.
95% CI, 95% confidence interval; JPY, Japanese yen; USD, U.S. dollar.
Health benefits
The number of responses to NRS questions per day of UC patients was 2.99 (95% CI: 2.62–3.36) and PC patients was 1.22 (95% CI: 1.03–1.41). The frequency of PC compared with UC reduced significantly (p < 0.001). We estimated the pain score and health benefits using these data.
Compared with UC, the pain scores of PC patients were slightly worse (1.08 [95% CI: 0.78–1.30] vs. 1.37 [95% CI: 1.07–1.67], p = 0.19). Conversely, compared with UC, PC showed a slight upward trend in health benefits (0.0452 QALYs [95% CI: 0.0370–0.0535] vs. 0.483 QALYs [95% CI: 0.0398–0.0568], p = 0.61).
Cost-effectiveness
PC reduced the incremental costs by 1672 USD and improved the incremental benefits by 0.0030 QALYs compared with UC. Hence, PC was more cost-effective than UC.
To confirm the robustness of the result, we conducted a nonparametric bootstrapping method with 1000 replicates. PC reduced the incremental costs by 1732 USD (95% CI: 1584–1879) and improved the incremental benefits by 0.0028 QALYs (95% CI: 0.0025–0.0032) compared with UC (Table 3).
Cost-Effectiveness Estimated with Bootstrapping after Propensity Score Matching
We converted 100 JPY to 1 USD.
Dominant is a term for a new treatment that is both cost saving and clinically superior in health economics.
ICER, incremental cost-effectiveness ratio; QALY, quality-adjusted life year.
Using the cost-effectiveness acceptability curves, PC was cost-effective in 82% of the bootstrap replications at a willingness-to-pay threshold of 5,000,000 JPY/QALY (50,000 USD/QALY), the Japanese willingness-to-pay threshold 33 (Fig. 2).
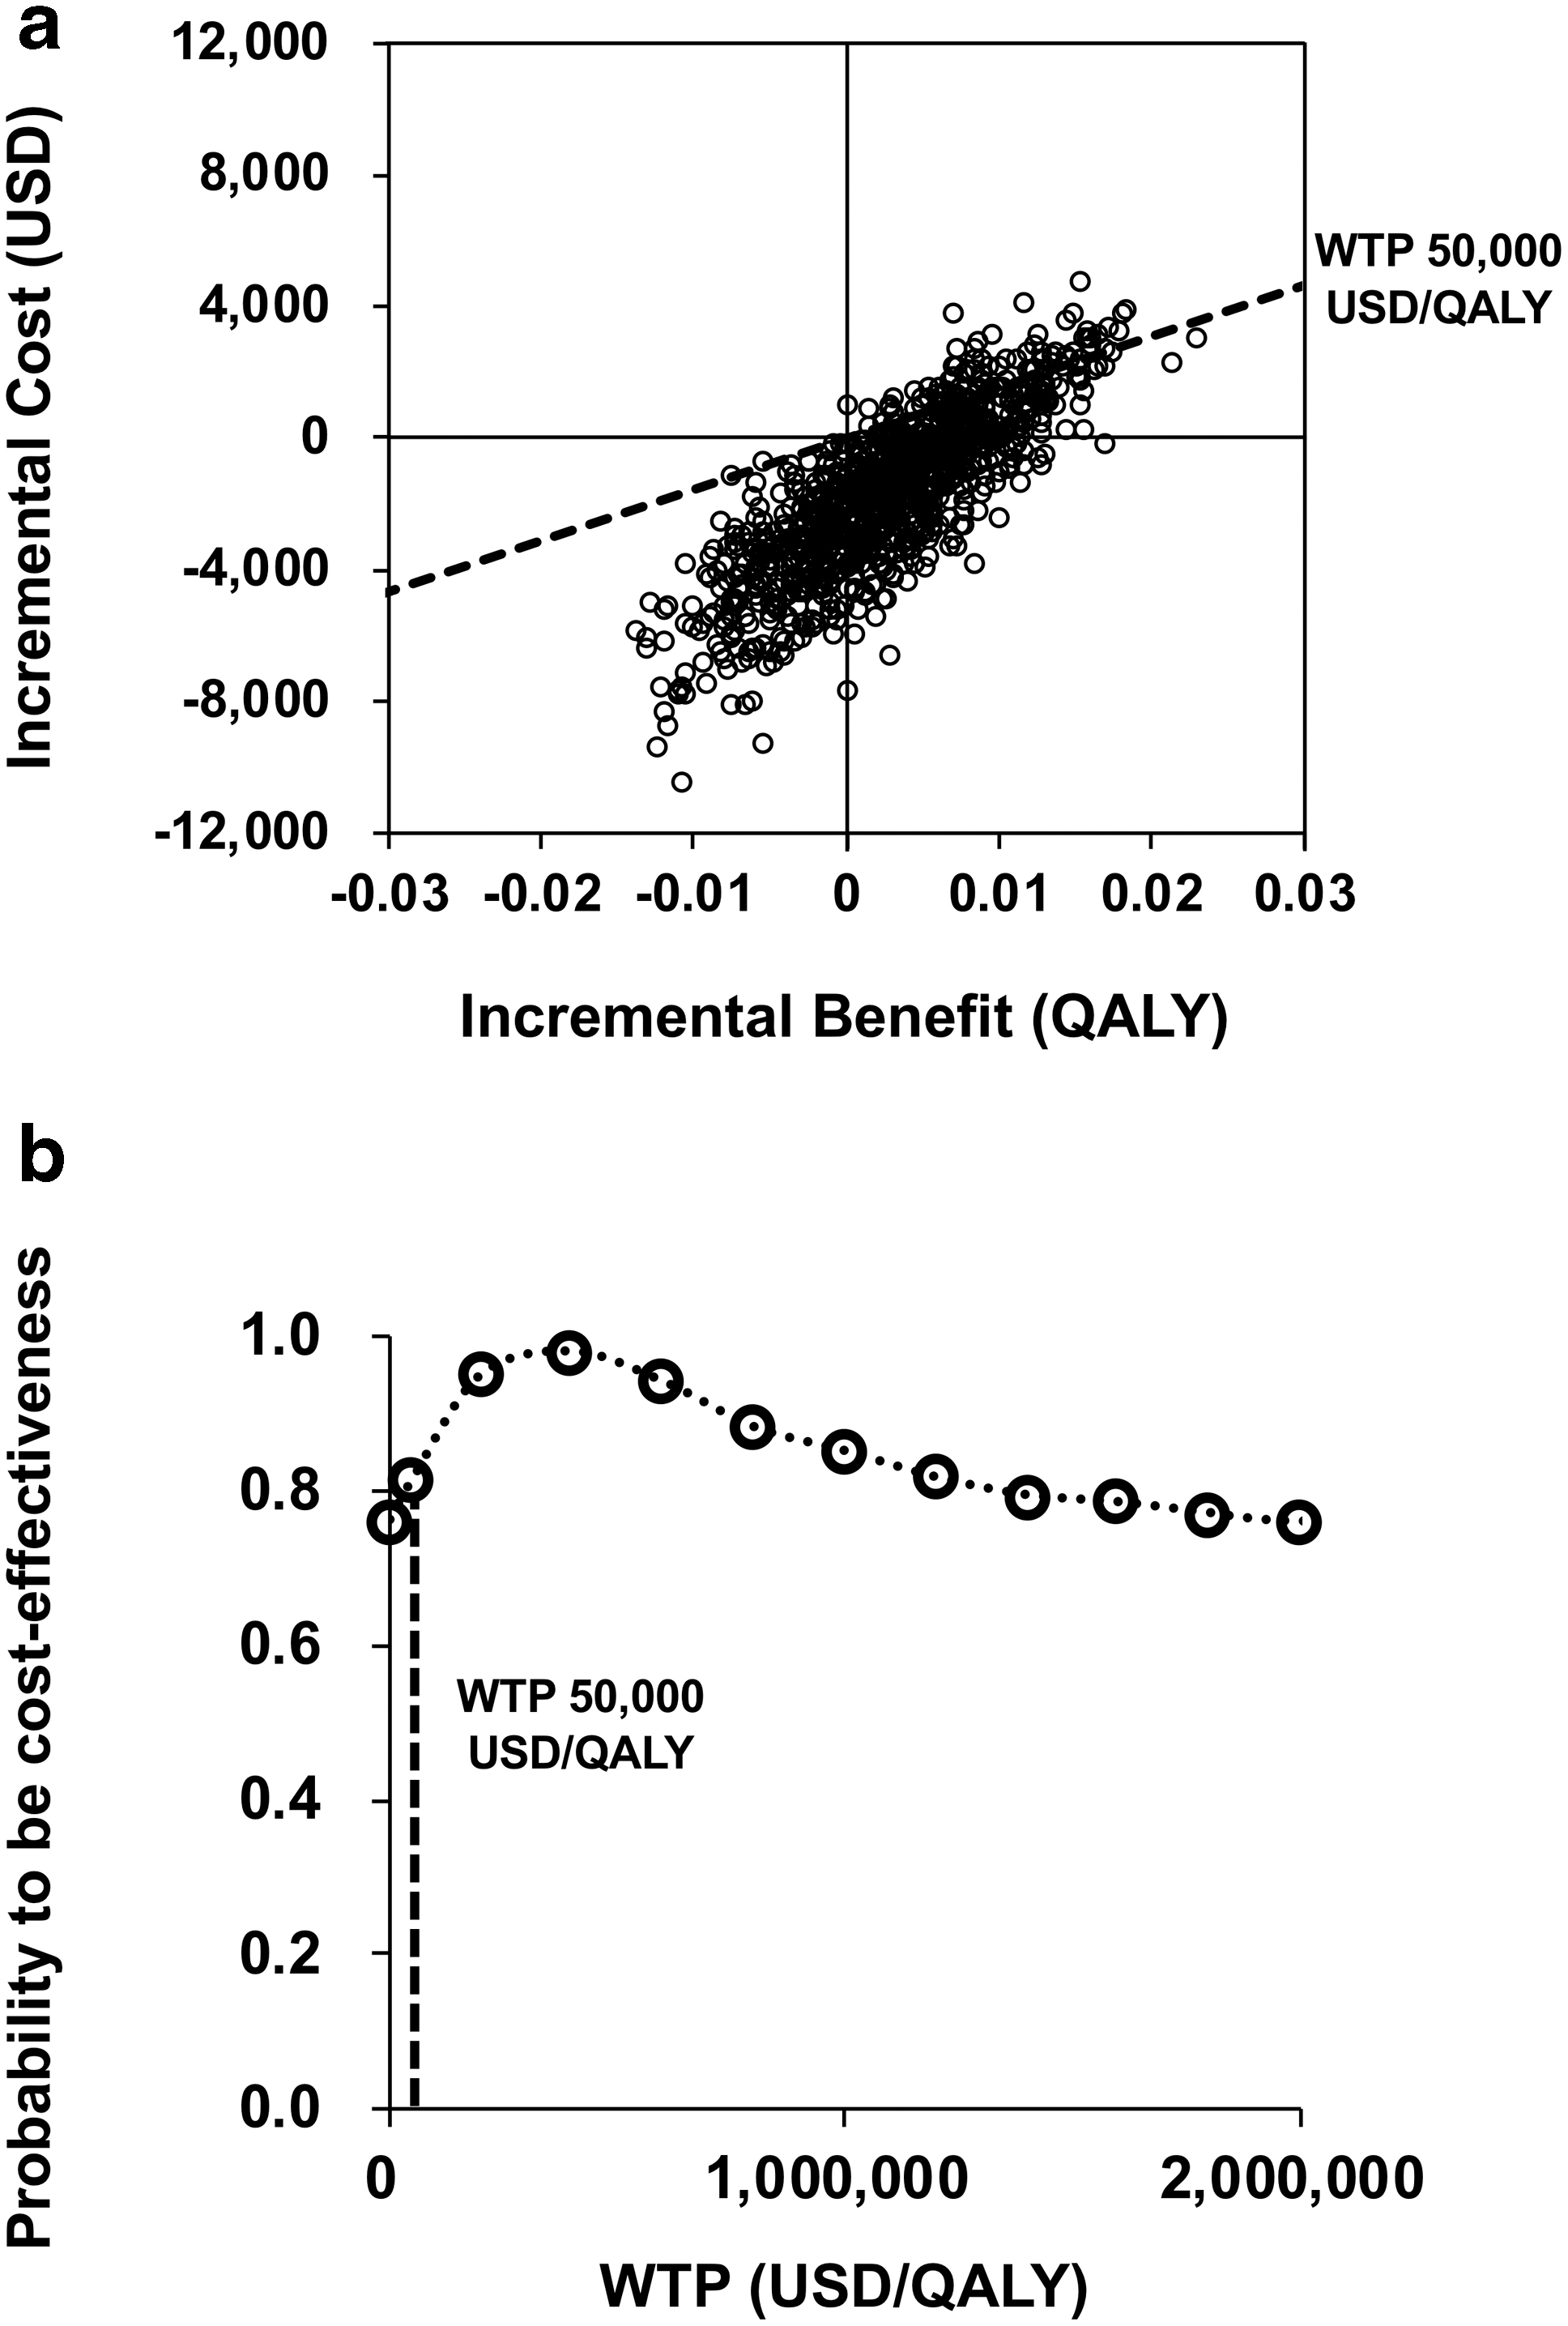
ICER scatterplot and cost-effectiveness acceptability curves after propensity score matching. USD, U.S. dollar.
Discussion
Our study investigated costs and cost-effectiveness of PC compared with UC with adjustment for patients' clinical characteristics, using the database of a general hospital in Japan. As expected, PC was associated with a reduction in admission costs. PC was also related to a modest increase in total QALYs because survival was marginally longer, although pain was slightly worse. Furthermore, the probabilistic sensitivity analysis indicated that there was an 82% probability that PC was a dominant strategy compared with UC at the Japanese willingness-to-pay threshold.
Regarding cost savings, previous studies indicated that the introduction of PC for patients reduced total medical costs as follows: for cancer and noncancer patients who died in the hospital, there was a reduction of 549 USD/day, 8 and for nonsmall cell lung cancer patients, there was a reduction of 2282 USD during the last 30 days of life (76 USD/day). 9 In our study, costs for PC (586 USD/day) for cancer patients reduced by 255 USD/day compared with UC (841 USD/day). Our result could be reasonable because these previous studies8,9 implied that the cost savings were greater as the range of target diseases was expanded.
Previous studies that conducted the probabilistic sensitivity analysis of specific anticancer drugs in particular cancer patients in Japan indicated that the best supportive care was more likely to be cost-effective at the Japanese willingness-to-pay threshold.15,16 Our results verified the cost-effectiveness of PC over UC for a wider range of cancer types, compared with previous studies in Japan.
Moreover, it has been reported that cost-effectiveness studies of palliative care were also limited in other countries.34,35 A study at an overseas hospital reported that variable costs decreased by 452 USD/day 11 and health benefits increased by 0.05 QALYs per 153 patients, 19 including cancer and noncancer patients who were discharged from the PCU or died in the PCU, after transfer to PCU compared with before transfer. However, the QALY estimation had limitations, which may have resulted in an overestimation or underestimation of QALYs. In this study, 19 QALYs were calculated by multiplying the patients' mean time spent in the PCU by the mean QOL score of other studies, including home-based PC studies. Thus, it was possible that our method was closer to real-world values because our QALY estimation was based on the pain levels of each patient rather than just the mean QOL score of other studies.
Furthermore, our method only required data that were available in most general hospitals. Hence, the analysis might be replicated in other hospitals at low costs because our method did not require additional data.
When making end-of-life treatment choices, 26.1% of cancer patients had a strong preference for PC, 29.8% had a strong preference for life-extending treatments, but 44.1% actively traded off costs and length for QOL. 28 Considering that 9.6 million people died of cancer in 2018 globally, 1 our findings could promote the introduction of PC for ∼4.2 million terminal cancer patients.
However, there were several limitations to our study. First, the propensity score matching results are generalizable only among those in the range of propensity scores included in the analysis and they cannot be applicable to those who are out of this range. Propensity score methods reduce bias in causal estimates due to observed differences between treatment groups, but are still subject to bias from unobserved differences (such as socioeconomic status, 36 a high level of positive religious coping,28,37 and initial QOL based on symptoms other than pain).
Second, the data were collected from one Japanese hospital. It is not clear how generalizable the results are to patients in other hospitals or programs in other health systems.
Third, the actual costs associated with treatment might be higher than the total costs we calculated from hospital records, which did not reflect some costs (e.g., food costs during hospitalization).
Fourth, there were significant sample reductions due to missing NRS score data, excluding ∼10% of enrolled patients (UC: 15/215, PC: 23/224). We speculated that the missing data were caused by patients being too ill to answer the NRS questions. In addition, the numbers of responses for NRS questions per day were significantly lower for PC than UC. We also speculated that the lower response rate was caused by the likelihood that more patients in PC were debilitated and unresponsive than those in UC. Our study can only be generalized to hospitalized patients with advanced cancer whose illness severity made them candidates for palliative care, but who were still able to answer the NRS questions.
Fifth, we converted the NRS score to the QOL score with the observed value based on a previous study. 23 However, these scores were based on the NRS scores for patients with neuropathic pain. Further research on the conversion between cancer pain and QOL is needed because this conversion for cancer pain may be different from that for neuropathic pain.
Finally, we estimated patients' QALYs based solely on pain. Patients' QALYs could be based on pain and other factors (such as nausea, dyspnea, hiccups, and sleep disturbance). Our results on cost-effectiveness could only be adapted to pain management.
Conclusions
In summary, our analysis indicated that PC for terminal advanced cancer patients reduced total admission costs by 1732 USD (95% CI: 1584–1879) and improved health benefits by 0.0028 QALYs (95% CI: 0.0025–0.0032). In the Japanese health system, there was an 82% probability that PC was more cost-effective than other UC. Our findings could support the introduction of PC for advanced cancer patients at the end of life.
Footnotes
Funding Information
No funding was received.
Author Disclosure Statement
No competing financial interests exist.