




Abstract
Background:
We have shown previously that in overweight premenopausal women, changes in macronutrient composition and increasing the number of steps walked per day favorably affect body composition and plasma lipid profiles. As a follow-up, we evaluated the effect of moderate carbohydrate intake and increased physical activity on inflammation and regulation of appetite.
Methods:
Seventy premenopausal women with a body mass index (BMI) between 25 and 37 kg/m2 participated in a 10-week weight loss intervention program consisting of the following macronutrient energy distribution: 40% carbohydrate, 30% fat, and 30% protein, in addition to a progressive increase in the number of steps taken per day. Plasma adiponectin, intracellular adhesion molecule-1 (ICAM-1), vascular cell adhesion molecule-1 (VCAM-1), leptin, and ghrelin levels were assessed at baseline and after 10 weeks.
Results:
Subjects reduced body weight by 4.5%, waist circumference (WC) by 6.4%, and trunk fat by 4.6%. Plasma insulin and insulin resistance assessed by homeostasis model assessment (HOMA) were reduced after 10 weeks (p < 0.01). Plasma adiponectin was increased by 11% (p < 0.05), and ICAM-1 levels were decreased (p < 0.05) after 10 weeks. A negative correlation was found between changes in insulin and changes in adiponectin between baseline and 10 weeks (r = −0.397, p < 0.01), indicating a role of adiponectin in increasing insulin sensitivity. In addition, plasma ghrelin levels were increased by 17% (p < 0.001), indicating a signal for increased appetite associated with weight loss.
Conclusions:
These studies indicate that weight loss interventions involving moderate changes in dietary carbohydrate and increases in physical activity favorably affect insulin sensitivity and decrease inflammation.
Introduction
Obesity is a major risk factor for several diseases, such as hypertension, dyslipidemia, insulin resistance, diabetes, and cardiovascular diseases. (CVD). 1 –3 Additionally, obesity is associated with other disease states, including asthma, breast cancer, and nonalcoholic liver steatosis, 4 and leads to increased premature death. 5 Overweight and obesity are rapidly increasing in the United States 3 and now affect the developing countries, including the Far East, the Middle East, and South America. 6
The clinical syndrome that links visceral obesity with diabetes has been named metabolic syndrome. This is a cluster of abnormalities characterized by insulin resistance, such as impaired glucose tolerance or type 2 diabetes, dyslipidemia, lower high-density lipoprotein (HDL) cholesterol, and arterial hypertension. 6 Adipose tissue secretes a number of bioactive molecules believed to affect the pathophysiology of obesity, called adipokines or adipocytokines. 7,8 These bioactive substances include adiponectin, resistin, plasminogen activator inhibitor-1 (PAI-1), leptin, tumor necrosis factor-α (TNF-α), and interleukin-6 (IL-6). 4,9,10
Adiponectin, a cytokine abundantly secreted from adipose tissue, 11 forms >0.01% of circulating protein 12 but, paradoxically, is present at low concentrations in obesity 1 and in subjects with type 2 diabetes, CVD, 13 and hypertension, 14 whereas most other adipokines are increased in obesity in proportion to an increase in total body fat mass. 9 Adiponectin also increases with weight loss. 15 Adiponectin has been established to have insulin-sensitizing effects, as well as anti-inflammatory and antiatherogenic properties. 12 In in vitro experiments, physiological concentrations of adiponectin inhibit TNF-α, which increases expression of vascular cell adhesion molecule-1 (sVCAM-1) and intracellular adhesion molecule-1 (sICAM-1) in human aortic endothelial cells, protecting the vessel wall from adhesion of leukocytes and from progression of atherosclerosis. 16 Accordingly, low levels of adiponectin contribute to insulin resistance and hasten the atherogenesis associated with obesity.
Leptin, a 16-kD adipocyte-derived cytokine, is synthesized and released from fat cells in proportion to body fat. 7 Leptin plays an important role in the regulation of body mass index (BMI) through increasing energy expenditure and reducing food intake to maintain metabolic balance. 17 Leptin expression is increased by overfeeding, insulin, glucocorticoids, endotoxin, and cytokines and decreased by fasting, testosterone, thyroid hormone, and exposure to cold temperature. 18 Opposite to adiponectin, serum leptin concentrations are reported to be increased in humans with obesity, insulin resistance, and dyslipidemia, after adjustment for body composition. 19 Increased leptin levels in obese individuals are usually accompanied by leptin resistance. 18 Hyperleptinemia or leptin resistance causes dysregulation of the hormone, resulting in exacerbation of obesity. 18
Ghrelin is a peptide hormone secreted by endocrine cells in the stomach 20 that regulates food intake and energy expenditure. It is a novel gut-brain peptide, an endogenous ligand of the growth hormone secretagogue receptor (GHS-R), and it regulates pituitary growth hormone secretion and food intake. 21 Ghrelin stimulates positive energy balance and has been shown to produce adiposity in rodents by decreasing fatty acid utilization. 22 In contrast to leptin, ghrelin is decreased in human obesity, and its effects on energy homeostasis are opposite to those of leptin. This downregulation may represent a physiological adaptation of positive energy balance linked to obesity, 21 raising the possibility that leptin and ghrelin are part of a dynamic feedback system in the regulation of body weight.
Compared with men, women appear to be more at risk for obesity and diabetes mellitus, possibly because of higher concentrations of intracellular triglyceride content. 23 In addition, coronary heart disease is the leading cause of death in women. 24 Low plasma adiponectin levels <4.0 μg/mL are associated with the metabolic syndrome in 37.5% of women. 25 Dietary or other interventions aimed at decreasing this alarmingly increased risk for chronic disease in women are clearly a necessity.
Carbohydrate restriction at any level has been shown to be beneficial for losing weight and for improving dyslipidemias and inflammation. 26 Although there is evidence that low-carbohydrate diets promote relatively rapid weight loss, long-term adherence to such diets has been problematic. 27,28 In the present study, however, we used moderate carbohydrate restriction, and adherence to the diet did not represent a problem. In addition, high-protein diets have been shown to suppress appetite. 29 We hypothesized that macronutrient composition including moderate carbohydrate intake (40% of energy) and high protein (30% of energy) would favorably affect plasma markers of inflammation as well as appetite hormones.
The effects of the present intervention involving moderate carbohydrate intake and increased physical activity on plasma lipids 30 and body composition 31 have been reported previously. The purpose of the present study was to examine plasma adiponectin, leptin, ghrelin, and metabolic/cardiovascular risk profile, including glucose, insulin, and inflammatory markers, before and after weight loss induced by a 10-week intervention in overweight and obese premenopausal women.
Materials and Methods
Materials
The Human Cardiovascular Panel 1 Lincoplex kit and Human Gut Hormonal Panel Lincoplex kit were obtained from Linco Research (St. Charles, MO). EDTA, aprotinin, sodium azide, 5, 5-dithiobis (2-nitrobenzoic acid), and phenylmethylsulfonyl fluoride were obtained from Sigma Chemical (St. Louis, MO). Plasma glucose kits were from Wako Chemicals (Richmond, VA). Omron HJ-104 pedometers were purchased from Omron Healthcare, Inc. (Vernon Hills, IL), and insulin and leptin kits were from Linco.
Subjects
As previously reported, 30,31 70 overweight and obese premenopausal women (20–45 years of age) were recruited from the University of Connecticut and surrounding communities. BMI ranged from 25 to 37 kg/m2. Exclusion criteria were pregnancy, lactation, and history of CVD, diabetes, and kidney or liver diseases. Using the International Physical Activity Questionnaire, the majority of participants considered themselves to be sedentary to moderately active. 31 We did not have enough plasma for 10 of the 70 subjects who participated in this intervention, and, therefore, we are reporting data for only 60 women in the present study.
Experimental design
The 10-week study protocol was approved by the University of Connecticut Institutional Review Board. Informed consent was obtained from all subjects. Energy needs were estimated from the Harris-Benedict formula and multiplied by an activity factor of 1.2 because the women were mostly sedentary. The distribution of energy in the diets was 30% protein, 30% fat, and 40% carbohydrate. The moderate restriction of carbohydrate was chosen to help maintain dietary compliance. Based on the calculated energy expenditure, we stratified our participants into five groups: 5880 kJ/day (1400 kcal), 6300 kJ/day (1500 kcal), 6720 kJ/day (1600 kcal), 7140 kJ/day (1700 kcal), or 7560 kJ/day (1800 kcal). Participants received food and menus to follow based on their energy level and macronutrient composition. Ninety percent of the food was provided to the subjects except for skim milk, condiments, and butter or margarine. Each participant also received a pedometer, which was set to her individual stride length. Participants were instructed to follow their respective menus and to record any modification or deviation from the menus. For the baseline, dietary information was collected using a 120-food item FFQ developed by the Fred Hutchinson Cancer Research Center (Seattle, WA). For each food, participants selected a serving size in comparison to the medium size listed. Pictures of small, medium, and large food items were provided to increase reporting accuracy. Participants recorded how many times, on average, in the past 3 months they had consumed each food listed in the FFQ and the serving size they thought best described their own. Participants were advised of the macronutrient composition of the diet, the energy consumed, and the benefits of increasing physical activity.
The average of the daily number of steps in week 1 was calculated and set as a baseline. At the beginning of week 2, subjects were instructed to increase the number of steps by 1500 steps per day more than baseline. At the beginning of week 4, participants were instructed to walk an additional 1500 steps per day and asked to do the same on week 6. The step per day goal was to reach a total increase of 4500 steps per day.
Blood samples were collected in week 1 and week 10. Blood was collected into tubes containing 0.15 g/100 g EDTA. Plasma was separated by centrifugation at 1500 × g for 20 minutes at 4°C and placed into vials containing phenylmethylsulfonyl fluoride (0.01 g/100 g), sodium azide (0.01 g/100 g), and aprotinin (0.05 g/100 g). Samples were placed in the −80°C freezer until assayed. Plasma samples were used to measure adiponectin, sVCAM-1, sICAM-1, ghrelin, leptin, and insulin.
Dietary assessment
During the intervention, the participants' menus with entries for 3 nonconsecutive weeks (15 weekdays and 6 weekend days) were entered into the Nutrient Database Systems for Research, version 4.05_33 (Nutrition Coordinating Center, University of Minnesota) for nutrient analysis, as previously reported. 31
Anthropometric measurements
Weight was measured to the closest 0.2 kg, and height was measured to the closest 0.1 cm on a portable stadiometer scale. 32 BMI was calculated as weight in kilograms divided by height in meters squared. Waist circumference (WC) was measured midway between the lowest rib and iliac crest to the nearest 0.1 cm. Hip circumference was measured at the widest point on the hip.
Fasting adiponectin, sVACM-1, and sICAM-1
From fasting plasma, VCAM-1, ICAM-1, and adiponectin were measured in duplicate in the same assay using the Human CVD Panel 1 Lincoplex kit. Samples were diluted 1:100 and simultaneously quantified by using Antibody-Immobilized beads and Luminex xMAP technology. The sensitivity for VCAM-1, ICAM-1, and adiponectin were 16.0 pg/mL, 9.0 pg/mL, and 56.0 pg/mL, respectively.
Plasma ghrelin
Plasma ghrelin quantification was performed as follows: 50 μL of plasma sample and the standards ranging from 1 to 1000 ng/mL were incubated with primary antiserum and biotinylated peptide for 2 hours. The biotinylated peptide was then incubated with strepavidin-horseradish peroxidase (HRP) for 1 hour to produce a blue solution. The enzyme substrate was stopped by adding HCl. The standard curve showed an inverse relationship between peptide concentrations and the corresponding absorbance. The sensitivity for ghrelin was 1.8 pg/mL.
Plasma glucose, insulin, and leptin
Plasma glucose was measured by a colorimetric assay. Insulin was measured using Linco RIA kits that use a double-antibody/PEG technique. 33 Plasma leptin was also analyzed using Linco RIA kits, and the method was very similar to the plasma insulin method. The sensitivities for insulin and leptin were 44.5 pg/mL and 157.2 pg/mL, respectively.
Homeostasis model assessment
The homeostasis model assessment (HOMA)
34
was used to calculate insulin resistance based on the following equation: HOMA insulin resistance = fasting insulin (μU/mL) × fasting glucose (mmol/L)/22.5
Based on the equation, our subjects were classified as having insulin resistance if the calculated value was ≥3.8. 34
Statistical analysis
A paired Student's t test was used to evaluate all the measured parameters between baseline and postintervention. Results are presented as mean ± standard deviation (SD). Values of p < 0.05 were accepted as statistically significant. A stepwise linear regression was conducted to evaluate the major determinants of weight loss (increased physical activity, caloric reduction, increased intake of protein, or decreased intake of carbohydrate).
Results
Diet intake and steps per day
As previously reported, 31 total energy was reduced from 8592 ± 3150 kJ at baseline to 6304 ± 503 kJ (p < 0.01) after 10 weeks. Energy contribution from all macronutrients was changed from baseline to 10 weeks: carbohydrates from 50.9% ± 10.1% to 42.1% ± 1.25% (p < 0.01), protein from 16.8% ± 3.3% to 28.1% ± 1.0% (p < 0.01), whereas fat remained unchanged at 32.7% ± 7.7% at baseline and 31.8% ±1.1% after 10 week. The number of steps was increased 42.6% from baseline by an average of 3816 steps (p < 0.01). An example of a sample menu for subjects consuming 1400 kcal (5600 kJ/day) is shown in Table 1. Stepwise linear regression indicated that the restriction of carbohydrate was the determinant of weight loss in this intervention.
90% of the food was provided to the participants, except for the condiments and nonfat milk.
Anthropometric measurements
As shown in Table 2, significant decreases were observed between baseline and the end of the intervention in body weight, BMI, WC, and trunk fat. Subjects reduced body weight by 4.5%, WC by 6.4%, and trunk fat by 4.6%.
Participants consumed a hypocaloric diet containing an energy distribution of 40% carbohydrate, 30% protein, and 30% fat and engaged in a walking program that increased by 4500 the number of steps from baseline.
Values are mean ± SD for 60 subjects.
Plasma ghrelin, insulin, and leptin
Subjects had a 17% increase in plasma ghrelin following the intervention (p < 0.01) (Table 3), indicating an increased signal related to appetite associated with the weight loss. At baseline and according to the HOMA equation, 19 participants had insulin resistance; this number was reduced to 9 at the end of the intervention (p < 0.01) (Table 3).
Participants consumed a hypocaloric diet containing an energy distribution of 40% carbohydrate, 30% protein, and 30% fat and engaged in a walking program that increased by 4500 the number of steps from baseline.
Values are mean ± SD for 60 subjects.
Plasma adiponectin, sICAM-1, and sVACM-1
Results are presented for only 60 subjects because of an insufficient quantity of plasma from 10 of 70 subjects. A significant increase in plasma adiponectin was observed from baseline to the end of the protocol. Plasma adiponectin was increased by 11% following the intervention (p < 0.05). A significant negative correlation (r = −0.397, p < 0.01) was found between change in adiponectin from baseline to 10 weeks and change in insulin from baseline to 10 weeks (Fig. 1). Plasma sICAM-1 concentration was decreased from 0.14 ± 0.06 to 0.12 ± 0.06 (p < 0.05), whereas sVCAM-1 concentration did not change after the 10-week intervention (Table 2). Individual changes in sVCAM-1 concentrations are presented in Figure 2. Forty of the 60 women experienced a decrease in this cytokine.

Pearson corrrelation (r = −0.397, p < 0.01) between changes in adiponectin and changes in insulin between baseline and postintervention for all subjects.
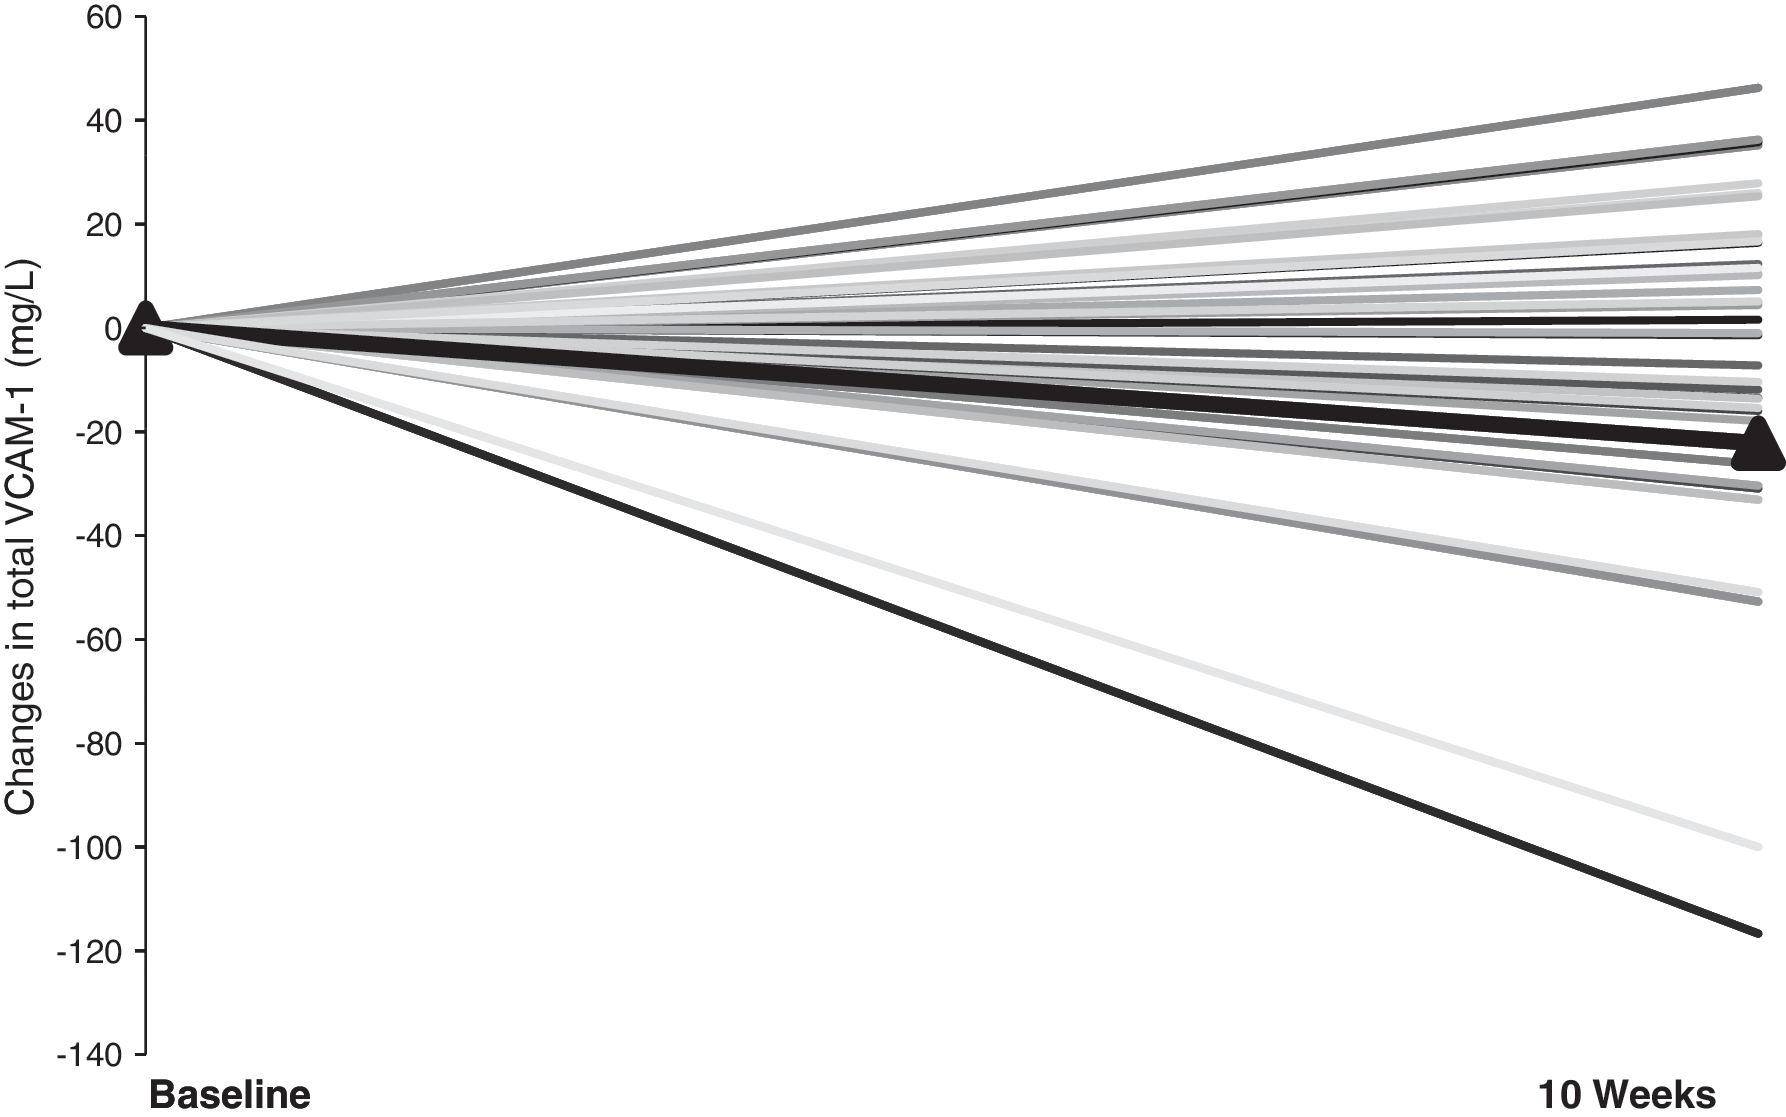
Changes in sVCAM-1 between baseline and posttreatment for all subjects. The black line represents the mean for the group.
Discussion
In the present study, we show that plasma adiponectin concentrations increased after weight loss following a 10-week intervention that included changes in macronutrient composition and increased physical activity. We also observed a significant decrease in body weight, WC, and trunk fat. Concordant with our data, Ryo et al. 25 pointed out that plasma adiponectin concentrations correlated negatively with WC and visceral fat area. Yang et al. 35 also found a significant correlation between increases in adiponectin concentrations and the reduction of BMI and waist/hip measurements in 15 morbidly obese women after gastric surgery. Shin et al. 36 found that plasma adiponectin concentrations were negatively correlated with body weight after a 12-week intervention in 144 overweight/obese women. In spite of the significant decrease in energy intake and the significant increase in the number of steps taken per day, we found that the best predictor for weight loss was carbohydrate reduction, as analyzed by stepwise linear regression. A significant decrease in fasting plasma insulin accompanied by improvements in insulin resistance index as estimated by HOMA was also found in the current study after weight loss. Other studies have shown that increases in adiponectin are predictive of insulin sensitivity, as estimated by the HOMA equation. 34 In addition, Pellem et al. 2 indicated that plasma adiponectin was inversely correlated with fasting proinsulin, fasting insulin, and acute insulin response and positively correlated with insulin sensitivity. In our study, we also observed a negative correlation between changes in adiponectin and changes in insulin. Adiponectin appears to play a role in fatty acid and glucose metabolism through activation of fuel oxidation by AMP-activated protein kinase and peroxisome proliferator-activated receptor-α, reducing lipotoxicity and hepatic glucose output and improved insulin sensitivity. 37,38
Although there was no change in plasma sVCAM-1 as a result of the intervention, a significant decrease in plasma sICAM-1 was observed. In line with our results, Ziccardi et al. 39 reported that reduction of body weight causes significant improvements in endothelial activation and is correlated with reduction of TNF-α, IL-6, and ICAM-1 after a 1-year multidisciplinary program of weight reduction.
Ouchi et al. 11 reported that in vitro physiological concentrations of adiponectin (3–30 μg/mL) had significant inhibitory effects on lipid accumulation, class A macrophage scavenger receptor expression, and class A macrophage scavenger receptor ligand binding and uptake activities in human monocyte-derived macrophages. Moreover, adiponectin modulates signaling of nuclear factor-κB (NF-κB), a transcription factor involved in the inflammatory response, through a cAMP-dependent pathway. 11
It is clear that adipose tissue produces multiple bioactive peptides, which not only influence adipocyte function but also affect multiple metabolic pathways through the bloodstream. Whereas plasma adiponectin concentrations are reported to be decreased, plasma leptin concentrations are elevated in human obesity and have been independently associated with inflammatory markers such as IL-6, C-reactive protein (CRP), and fibrinogen. 18
Leptin plays a significant physiological role in regulation of BMI by increasing energy expenditure and reducing food intake to maintain metabolic balance. 17 There is also increasing evidence that regulation of BMI can be attributed to leptin. Leptin has systemic effects apart from those related to energy balance, including regulation of neuroendocrine and immune function and a role in development. 40 In contrast, ghrelin is downregulated in human obesity.
We have observed that weight loss caused a significant decrease in plasma leptin as well as an increase in plasma ghrelin from baseline to the end of the protocol. In accordance with previous studies, decreases in plasma leptin and increases in plasma ghrelin levels have been reported in morbidly obese females after gastric surgery. 41 Other studies have shown that in human obesity, fasting plasma ghrelin concentrations are negatively correlated with body weight, percent body fat, BMI, fat mass, leptin, and insulin. 42 This reduction of ghrelin in human obesity represents a physiological adaptation of positive energy balance associated with obesity, raising the possibility that leptin and ghrelin are part of a dynamic feedback system in the regulation of body weight. Leptin production by white adipose tissue is enhanced by insulin and cortisol and decreased by β-adrenergic agonists, cAMP, and thiazolidinediones. 43 The reduction in leptin may be associated with decreased leptin resistance and a better suppression of appetite as well as improved insulin action.
In summary, plasma adiponectin and ghrelin concentrations increased after a 10-week intervention, whereas plasma leptin, insulin, sICAM-1, and HOMA values were significantly decreased. We conclude that moderate changes in lifestyle leading to weight loss, such as modulating macronutrient composition of the diet and increasing physical activity, favorably affect inflammation markers and insulin sensitivity in premenopausal women.
Disclosure Statement
The authors have no conflicts of interest to report.