




Abstract
Background:
More women than men pursue bariatric surgery for treatment of obesity. Untreated obstructive sleep apnea (OSA) in bariatric patients increases perioperative morbidity and mortality, and, therefore, most bariatric surgeons screen for OSA with polysomnography (PSG). We sought to develop a model for predicting OSA in women seeking bariatric surgery in order to use this diagnostic resource most efficiently.
Methods:
We identified 296 women who had PSG in preparation for bariatric surgery. Regression and logistic regression analyses were used to assess the relationship between history and physical examination findings and OSA severity. After developing best statistical models, we constructed a summary index to identify patients exceeding clinical thresholds for mild (apnea-hypopnea index [AHI] ≥5) and moderate to severe disease (AHI ≥15).
Results:
In our sample, most women (86%) had OSA, and more than half (53%) had moderate to severe disease. Multiple logistic regression showed that age, body mass index (BMI), neck circumference, hypertension, witnessed apneas, and snoring predicted AHI. Diabetes mellitus and daytime sleepiness measured with the Epworth Sleepiness Scale (ESS) were not significant predictors of OSA. Prediction models were statistically significant but had poor specificity for predicting OSA severity.
Conclusions:
OSA is highly prevalent in symptomatic and asymptomatic women planning bariatric surgery for obesity. Best prediction models based on clinical characteristics did not predict disease severity under conditions superior to those in which they might be applied. In light of the perioperative risks associated with OSA in bariatric patients, all women considering bariatric surgery for obesity should be evaluated for OSA with PSG.
Introduction
Obstructive sleep apnea (OSA) is a form of sleep-disordered breathing that causes sleep fragmentation and nocturnal oxygen desaturation. In addition to experiencing such consequences as disrupted sleep and daytime sleepiness, women with OSA are at higher risk for coronary artery disease (CAD), 1 hypertension, 2 and stroke. 3 In women of childbearing age, OSA is often comorbid with conditions, such as polycystic ovary syndrome (POS) 4,5 and pregnancy-induced hypertension (PIH). 6
OSA is common in the general population. For instance, Young et al. 7 studied a random sample of 626 adults aged 30–60 years and found that 9% of women and 24% of men had at least mild OSA (defined as apnea-hypopnea index [AHI] ≥5), with moderate to severe disease (AHI ≥15) observed in 4% of women and 9% of men. Several studies have shown that women have a lower prevalence of OSA than men, but among women, OSA is underdiagnosed. 7,8 The knowledge of this sex difference in prevalence may underlie observed gender disparities in diagnosis of OSA in women. 7,9,10 Underdiagnosis in women has also been attributed to differing clinical presentations in men and women 11,12 and disregard of typical symptoms (such as snoring) in women. 13 In addition to male sex, other well-documented risk factors for OSA include older age, obesity, large neck circumference, narrow airway configuration, presence of snoring, and complaints of daytime sleepiness.
Given the importance of obesity as a risk factor for OSA, it is not surprising that OSA is frequently observed in patients planning bariatric surgery. Bariatric surgery is an increasingly common treatment for obesity, with more women than men pursuing weight loss surgery. 14 In addition, bariatric patients represent a population where typical sex differences in OSA are less robust. For example, Frey and Pilcher 15 performed diagnostic polysomnography (PSG) in 41 patients (34 women) as part of a bariatric surgery evaluation and found OSA (defined by AHI ≥5) in 68% of women and 86% of men. Serafini et al. 16 performed PSG in 23 women and 4 men who reported sleepiness as part of bariatric surgery screening. They did not report their results by gender, but only 1 of 27 patients did not have OSA; thus, the prevalence of OSA in the women in their sample was at least 96%. O'Keeffe and Patterson 17 analyzed data from 142 women and 21 men screened for bariatric surgery and found OSA in 77% of women and 100% of men. Similarly, Sareli et al. 18 examined 342 patients who underwent PSG as part of bariatric screening and reported sleep apnea in 74% of women and 94% of men. Therefore, compared to the male/female ratio of OSA in the general population of approximately 2.4:1, the ratio in patients with obesity who are planning bariatric surgery is lower, at approximately 1.3:1, an increased risk of approximately 1.8 times. This increased risk, coupled with a tendency for underdiagnosis in women, poses a particular risk to the population of women seeking weight loss surgery.
The implications for underdiagnosis of OSA are profound. Patients with OSA are more prone to postoperative respiratory complications than patients without sleep-disordered breathing, 19,20 and untreated OSA in bariatric patients increases perioperative morbidity and mortality. 21 Therefore, most bariatric surgeons routinely employ PSG for all patients being considered for weight loss surgery to screen for OSA. Performing PSG on all patients planning bariatric surgery may not be practical at all centers because of the cost and somewhat limited availability of PSG. Sleep medicine physicians commonly use the presence of symptoms, such as snoring, witnessed apneas during sleep, and daytime sleepiness, to decide whether or not to perform PSG on nonbariatric patients. We hypothesized that these clinical correlates could predict the presence or severity of sleep-disordered breathing in women with obesity. Thus, we sought to develop a model for predicting the presence, absence, and severity of OSA using history, symptoms, and physical findings in women seeking bariatric surgery in order to use this diagnostic resource most efficiently.
Materials and Methods
Patient selection
Using retrospective chart review, we identified 342 adult patients (296 women) who were evaluated for bariatric surgery at Rhode Island Hospital between January 2003 and December 2005. As part of preoperative screening, all patients had PSG evaluation for OSA and were seen by a sleep medicine specialist (R.P.M. or a colleague). None of the patients was preselected for sleep evaluation based on symptoms. An investigator (C.T.) with no knowledge of the clinical status of the patients or if they eventually had bariatric surgery reviewed the Sleep Disorders Center and sleep physician office charts of the 296 female patients. Age, height, weight, neck circumference, report of snoring, witnessed apneas during sleep, and the presence of comorbid hypertension and diabetes mellitus were extracted for each patient. Daytime sleepiness was measured with the Epworth Sleepiness Scale (ESS), an 8-item questionnaire where participants rate their likelihood of dozing in various situations. 22 The ESS is included among the basic questionnaires that all patients complete for the Sleep Center and was not used to screen for which bariatric patients would undergo PSG.
Polysomnography
Standard overnight PSG was performed at one of three sites of the Sleep Disorders Center of Lifespan Hospitals (The Miriam Hospital and Rhode Island Hospital in Providence, RI, and Newport Hospital in Newport, RI). All studies were performed using Viasys equipment (Yorba Linda, CA). Sleep staging was monitored using central and occipital electroencephalographic leads, bilateral electro-oculograms, and a submental electromyelogram (EMG). Respiration was monitored using continuous pulse oximetry, a snoring microphone, nasal and oral thermistors, a nasal pressure transducer, and chest and abdominal piezo electrodes. In addition, the heart rate was continually monitored using a modified V2 lead, and bilateral tibialis EMG leads were placed to detect periodic limb movements.
All records were visually scored by the technologists using Rechtshaffen and Kales criteria, 23 with the Viasys software to tabulate indices. The same technologists did all scoring and had periodic concordance checks performed. Respiratory events were scored according to consensus critera. 24 Apneas were defined as an absence of airflow lasting >10 seconds. Hypopneas were scored if there was a clear decrease in the nasal pressure transducer signal of >50% from baseline amplitude lasting at least 10 seconds with either an oxygen desaturation >3% or an arousal. Events were classified as central in the absence of any respiratory effort, mixed if there was initially no respiratory effort followed by progressive evidence of ineffective respiration, and obstructive if there was persistent respiratory effort despite an absence of airflow. Arousals were determined using established criteria. 25 The presence of OSA was determined using the AHI, which is defined as the total number of apneas and hypopneas divided by the total number of hours of sleep. Mild OSA was defined as AHI ≥5 and <15. Moderate OSA was noted if the AHI was ≥15 and <30, and severe OSA was noted if the AHI was ≥30 episodes per hour. 24
This study was approved by the Rhode Island Hospital Institutional Review Board.
Statistical methods
Data screening and preparation
Analyses were carried out using SAS version 9.2 (SAS Institute, Cary, NC), SPSS 17.0 (SPSS, Inc., Chicago, IL), and Matlab r2008b (The Mathworks Inc., Lowell, MA). The distributions of continuous variables were checked for symmetry and normality based on the skewness coefficient (criteria set to exceeding ± 2) and Shapiro-Wilk statistic (p < 0.01). Variables that violated both criteria were logarithmically transformed. A constant was added to those with ranges including zero such that the distribution was shifted to right of zero before transformation (to avoid undefined numerical values). This transformation reduced the skewness coefficient in each instance, indicating better symmetry (not reported). The transformed variable was then used in any subsequent parametric analyses (as indicated). Such transformations are generally thought to result in better representation of the measure, as they often better approximate an underlying linear aspect of the mechanism and reduce the influence of values appearing to be outliers on one scale but not on another. 26,27
We used analysis of variance (ANOVA) and chi-square analyses to compare means and distributions of women without OSA and those with mild and moderate/severe disease.
Predictive models of OSA severity (AHI)
Ordinary least-squares linear regression and multiple linear regressions were used to assess the strength of the relationship between patient characteristics and the apnea severity as estimated by the AHI (individually and additively, respectively), as well as to develop predictive models. We used characteristics that were individually predictive in the least-squares linear regression (with alpha set at 0.05) as eligible predictors in the multiple regression using a stepwise-selection method (entry/exit at p < /≥0.15).
Because two of our statistically significant independent predictors from the least-squares regression (body mass index [BMI] and neck circumference) were strongly correlated with each other, we chose to construct two independent multiple regression models. The first model excluded neck circumference from the pool of predictors to avoid multicolinearity with BMI. In addition, neck circumference was missing in many patients, so the first model included more participants. Despite the missing neck circumference data, we were interested in examining this variable, particularly because of the likelihood of neck circumference being the more proximal risk factor for OSA. Thus, the second multiple regression model included both neck circumference and BMI in the variable pool and permitted them to compete for entry/exit into and out of the model.
Clinical utility of best AHI prediction models
To assess the utility of the best statistical models constructed, the betas from each were used to construct summary indices, which represent the AHI for each patient as predicted by the model. The predicted AHIs were used to attempt to identify patients exceeding clinical thresholds for mild (AHI ≥5) and moderate to severe (AHI ≥15) apnea using the models with a signal detection theory approach. Plots of sensitivity/specificity as a function of threshold were produced, as well as the receiver operator characteristic (ROC) curves. The area under the ROC curve was calculated based on the Wilcoxon score along with the risk ratio associated with crossing an optimized threshold selected as the point of intersection for sensitivity and specificity (using linear interpolation where necessary).
Results
Patient characteristics and demographics
Table 1 presents patient demographics for the sample divided into three groups: women without OSA, women with mild OSA (5 ≤ AHI < 15) and women with moderate/severe OSA (AHI >15). The mean age of the entire sample was 42 years (range 19–61 years), and average BMI was 50.1 kg/m2. Two hundred fifty-five women (86%) had an AHI ≥5, and 158 (53%) had an AHI ≥15. There was a high prevalence of hypertension (44%) and of diabetes (20%). Although the majority of the sample reported snoring, only a small percentage reported witnessed apneas while sleeping or had ESS scores indicative of excessive daytime sleepiness.
Variable logarithmically transformed for analyses; raw means and standard deviations reported in table.
significant difference between OSA negative group and moderate/severe OSA group.
significant difference between OSA negative group and mild OSA group.
significant difference between mild OSA group and moderate/severe OSA group.
OSA, obstructive sleep apnea; AHI, apnea-hypopnea index; F, F-statistic; df, degrees of freedom.
ANOVA and chi-square analyses showed significant effects of OSA severity for age, BMI, neck circumference, history of any symptoms, history of witnessed apneas, and history of snoring. Post hoc analyses performed with Tukey honestly significant differences (HSD) test revealed that compared with women without OSA, women with moderate/severe OSA were older, had higher BMI, and had larger neck circumferences. Post hoc Holm procedure confirmed that women with moderate/severe disease were also more likely to report symptoms, particularly snoring and witnessed apneas, than women without OSA. Women with moderate/severe disease also had larger neck circumferences than women with mild OSA. Women with mild OSA had significantly higher BMIs and lower oxygen saturation (SaO2) nadirs than women without OSA (Table 1).
Prediction of apnea severity
Table 2 summarizes the linear regressions used to predict apnea severity. Age, log BMI, log neck circumference, hypertension, report of at least one symptom, witnessed apneas, and snoring each individually predicted relative apnea severity (log AHI). Diabetes and daytime sleepiness (log ESS) did not predict severity of OSA.
Variable logarithmically transformed for analysis.
ESS, Epworth Sleepiness Scale; df, degrees of freedom; N, numerator; D, denominator; F, F-statistic; r 2 , the proportion of variance accounted for or r-square.
The statistically significant predictors were entered into a stepwise multiple linear regression, excluding only neck circumference. Although neck circumference may be considered more proximal to OSA, it was excluded to avoid multicolinearity with BMI (r = 0.44, p < 0.0001) and because it was not recorded in a high proportion of the sample. Age, BMI, and witnessed apneas were selected for the final model. Each of these was positively related to the AHI and remained statistically significant after adjusting for each other's effects. A second stepwise multiple linear regression included neck circumference in the list of potential predictors, lowering the sample size considerably and permitting BMI and neck circumference to compete for variability. Age, neck circumference, and snoring were selected for the final model, whereas witnessed apneas were not. Both the smaller sample size and any systematic differences between patients with neck circumference measurements and those without may have contributed to the variation between variables selected in the final models.
Prediction of apnea severity clinical thresholds
The final models from the two stepwise multiple regressions predicting log AHI severity were used to create two different indices, which were in effect predicted values for log AHI. These were then evaluated for clinical utility by calculating their sensitivity and specificity for identifying patients with AHI ≥5 or AHI ≥15 at all possible thresholds. An ROC curve was created, and optimized thresholds were determined based on maximizing sensitivity and specificity (the point of intersection for their two functions with threshold).
Figure 1 illustrates the diagnostic parameters for identifying patients having an AHI of ≥5 (top) and ≥15 (bottom) using a model that excluded patient neck size. For each, sensitivity and specificity were plotted as a function of thresholds in predicted AHI. The vertical lines represent the optimized threshold at which the sensitivity and specificity functions intersect. An ROC curve is inset in each graph, with the asterisks representing the point in the ROC at the optimized threshold.

This illustrates the diagnostic parameters for identifying patients with AHI ≥5 (
Although areas under the ROC curve of 0.76 (any OSA) and 0.67 (moderate to severe OSA) seem encouraging, the optimized sensitivities and specificities (i.e., the point at which sensitivity and specificity are the same) were approximately 66% and 64% for AHI of ≥5 and ≥15, respectively. In our sample of 294 patients, 253 had an AHI ≥5, but our best model at our best threshold missed 86 patients, or 34%. Similarly, 157 patients had an AHI ≥15, but our best model with an optimized threshold missed 57 patients, or 36%. These translated to negative predictive values of 24% and 60% for AHI of ≥5 and ≥15, respectively.
Figure 2 similarly illustrates the diagnostic parameters for identifying patients having AHI of ≥5 (top) and ≥15 (bottom), including neck circumference as a predictor (note smaller sample size). Again, sensitivity and specificity are plotted as a function of thresholds in predicted AHI. The vertical lines represent the optimized threshold at which the sensitivity and specificity functions with threshold intersect. An ROC curve is inset in each graph, with the asterisks representing the point in the ROC at the optimized threshold.
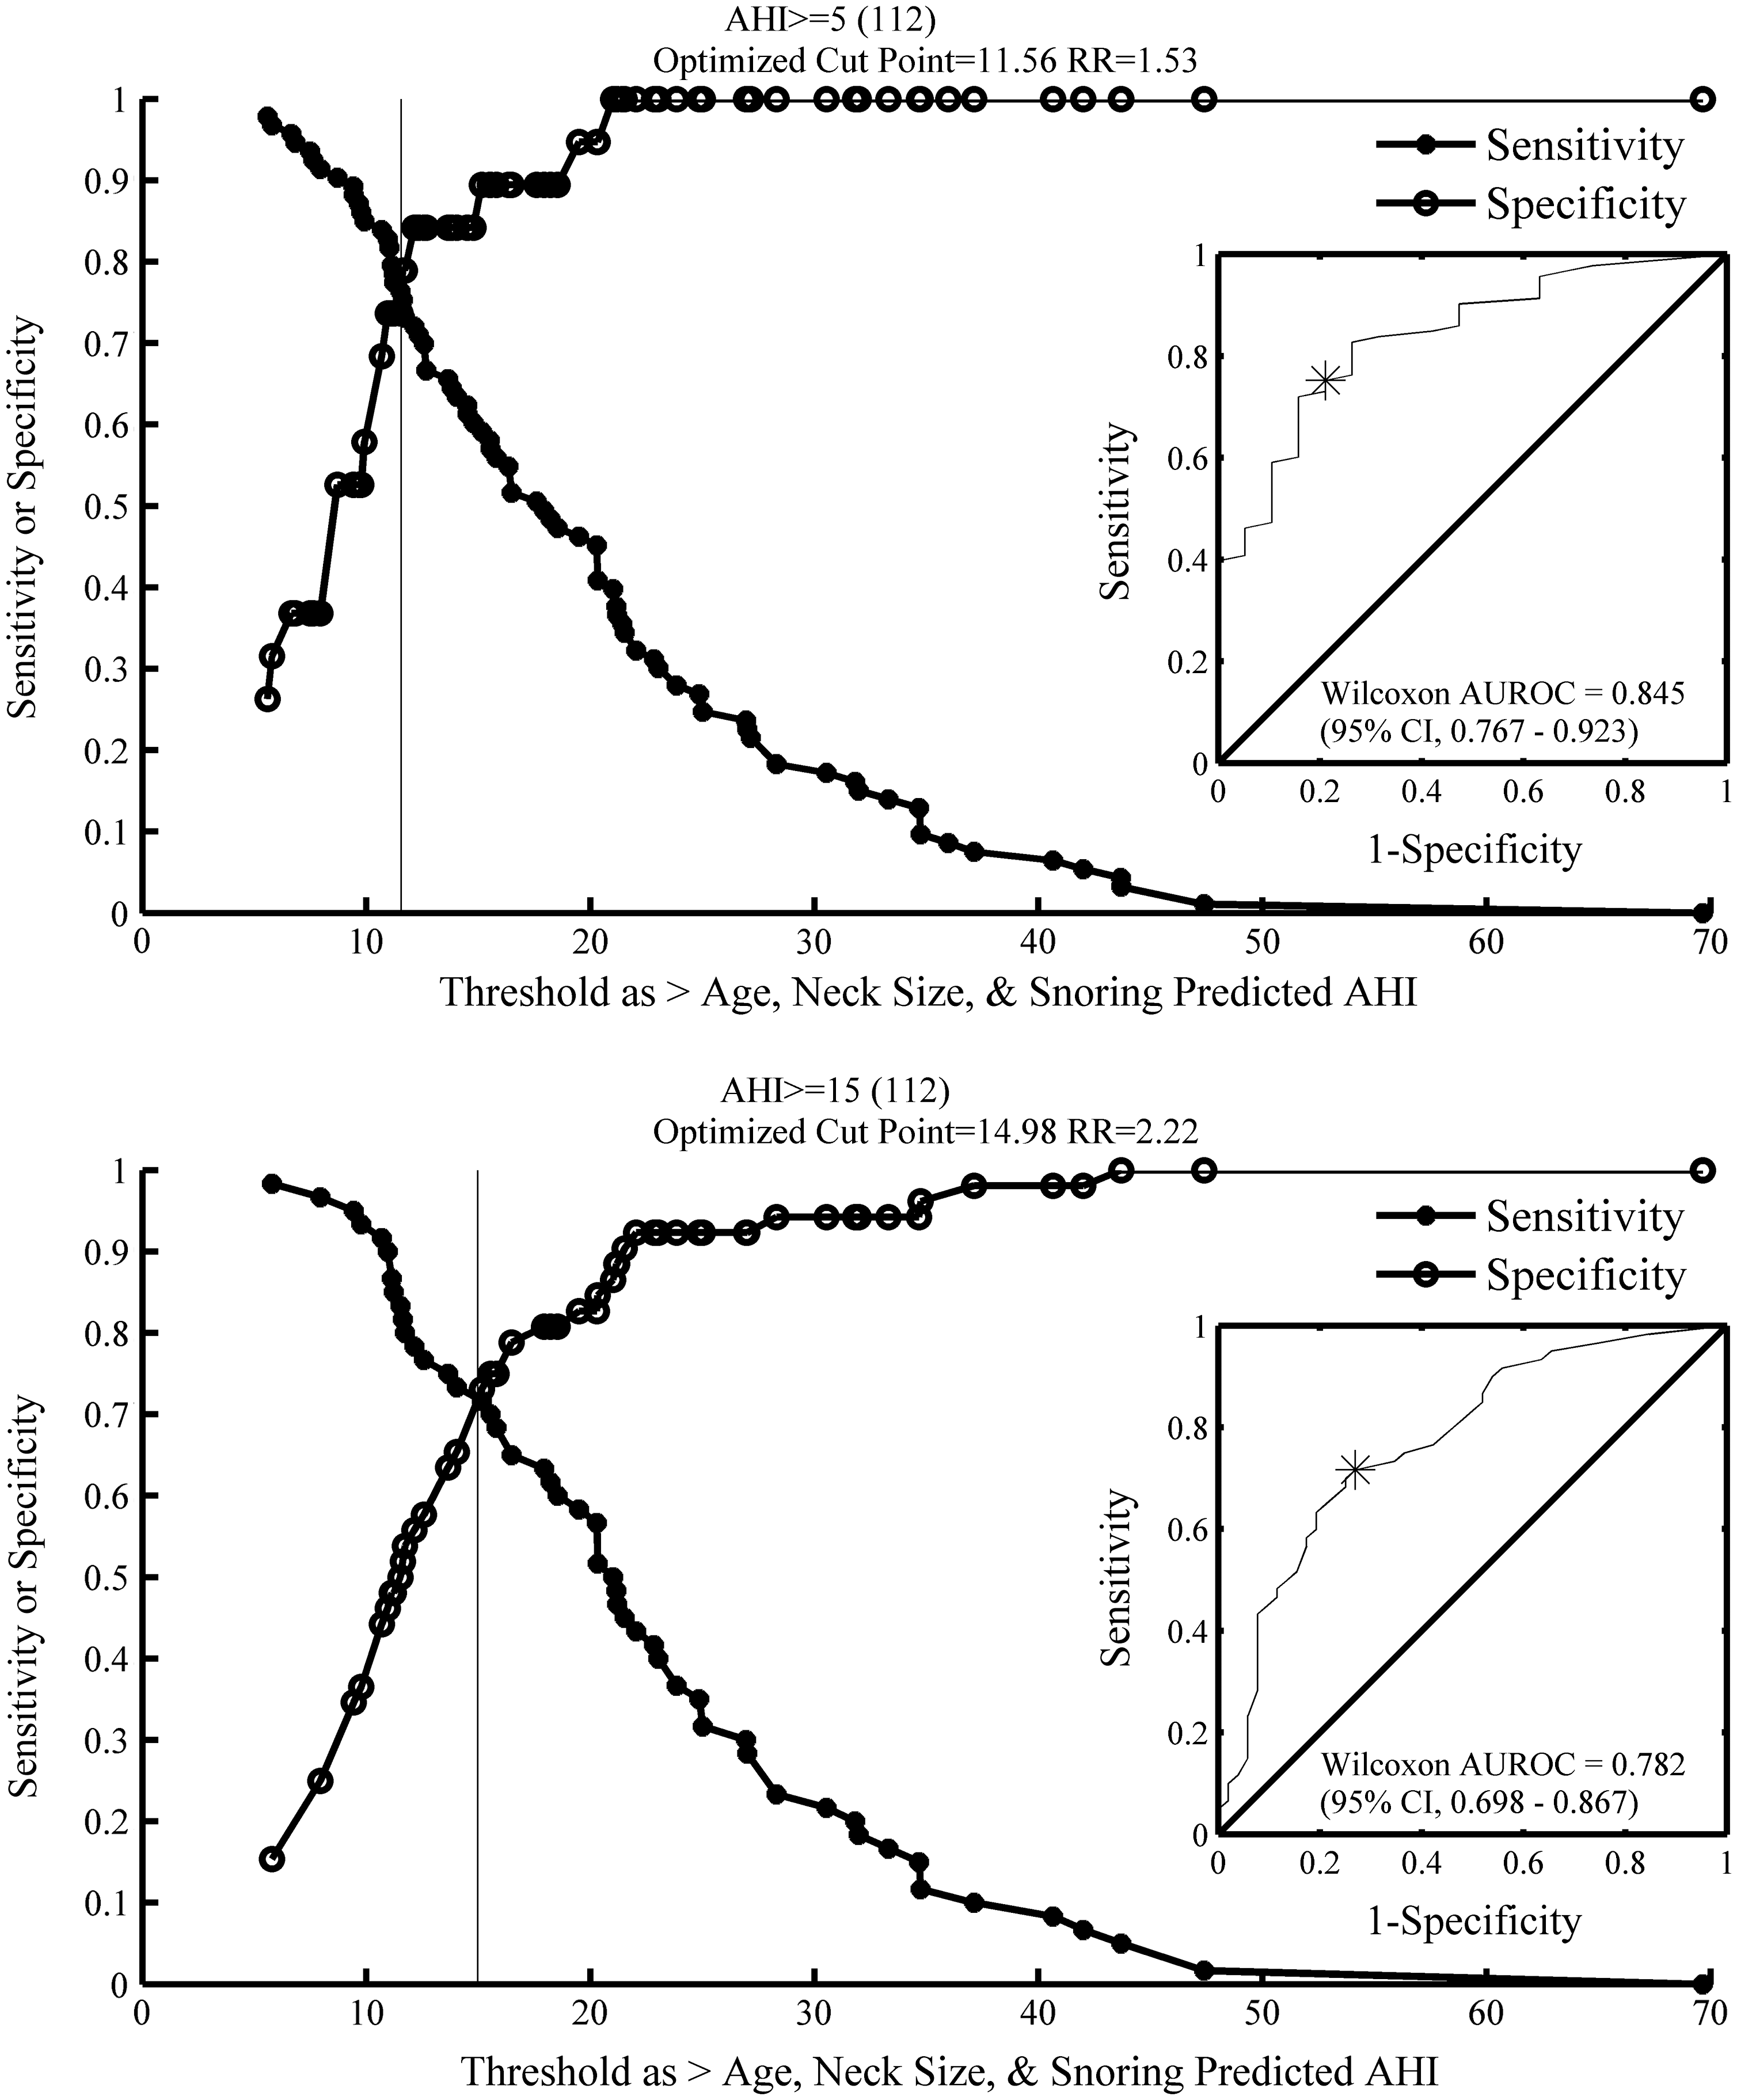
This similarly illustrates the diagnostic parameters for identifying patients with AHI ≥5 (
There were 112 patients in this analysis, and 93 had an AHI ≥5. The optimized sensitivity and specificity for distinguishing patients with AHI ≥5 was approximately 76%, with 22 patients missed. The corresponding negative predictive value was 39%. There were 60 patients who had an AHI ≥15. The optimized sensitivity and specificity for distinguishing these patients was approximately 72%, with 16 patients missed. The corresponding negative predictive value was 68%.
We also note that as the models produce predicted AHI, one would expect the optimized thresholds in the prediction to be at or near the clinical thresholds. However, the optimized thresholds for identifying an actual AHI of ≥5, based on a predicted AHI, were much higher than 5 for both models. If the model predictions were perfect (or even unbiased), the threshold would have been close to 5. These results further indicate that the model fails to predict mild OSA despite statistically significant effects. The model's optimized thresholds for predicting an actual AHI of ≥15 were closer, indicating less bias, although performance was still poor.
Discussion
Prevalence of OSA
The major finding of our study is the high prevalence of OSA in this large sample of women planning bariatric surgery for treatment of obesity. Using a cutoff of an AHI ≥5, 86% of our participants had at least mild OSA, and 53% had moderate to severe disease (AHI ≥15). Furthermore, average AHI in our sample was in the severe range, at 30.0 events per hour of sleep. Our findings are similar to those of other studies of the prevalence of OSA in bariatric patients, where percentages of 68%–96% have been observed in female patients. 15 –18 These results highlight the fact that although OSA is more common in men than in women in the general population, this sex difference is overshadowed by extremely high rates of OSA in a population with obesity.
Clinical characteristics related to OSA
Our analyses showed that older age, higher BMI, larger neck circumference, presence of hypertension, report of witnessed apneas, and report of snoring were related to OSA severity in our sample. Age is a known risk factor for OSA, although in midlife women, the age-related risk for OSA does not increase until women are older than 50 years. 7 Furthermore, several studies have demonstrated that sleep apnea is more prevalent in postmenopausal rather than premenopausal women. 28,29 The average age of our participants was 42 years, and the youngest woman evaluated for surgery was only 19 years of age. Thus, although we did not measure menopausal status per se, there were a high number of younger women in our sample who most likely were premenopausal. This finding implies that obesity itself plays a significant role in the development of OSA independent of hormonal state. This is consistent with our previous work in a nonbariatric sample showing that hormonal factors may be less important than weight and facial morphology in the development of OSA in women. 30
The mean neck circumference in our participants was 16.75 inches, and the BMI was 50.1 kg/m2. Previous work has shown that women with a neck circumference >16 inches are at increased risk of OSA. 31 The current finding is also consistent with a previous study from our laboratory on women with OSA that showed that the AHI correlated with BMI and measurements of upper body obesity, including triceps and subscapular skin folds and neck skin fold. 32
Neither diabetes mellitus nor daytime sleepiness was a significant predictor of OSA. We were surprised that sleepiness was not associated with OSA in this sample, as ESS score has been associated with OSA severity in other studies of men and women from the general population 33 and from a population with obesity planning bariatric surgery. 18 For example, in a nonbariatric sample of men and women with OSA, patients with AHIs in the severe range (like our participants) had a mean ESS score (±SD) of 16.2 ± 3.3. 33 In women with obesity and severe OSA, Sareli et al. 18 reported a mean ESS (±SD) score of 9.9 ± 5.4, but ESS was not related to OSA severity once they controlled for gender and menopausal status. Average ESS (±SD) was 6.4 ± 4.5 in our sample. A clinical cutoff of ESS ≥10 is typically used for screening for excessive daytime sleepiness, 22 although a threshold of ESS >6 has been used in the bariatric population. 16,34 Although the ESS has been used frequently to subjectively assess daytime sleepiness in patients with OSA, recent studies have questioned its reliability in known clinical populations. 35 In addition, it has been suggested that bariatric patients may be motivated to underreport symptoms, particularly psychiatric symptoms, during bariatric screening. 36 Thus, ESS scores in our sample may be low because of participants' belief that surgery may be denied if they endorse symptoms. Other possible factors explaining the lack of a relationship between ESS and OSA severity in our sample include inability to recognize impairment or true absence of sleepiness. Further work is needed to understand if there are gender differences in sleepiness reported in bariatric patients. Future investigations of this issue should also include objective measures of sleepiness and performance.
Predictive models of OSA
In an effort to make efficient use of PSG, researchers have attempted to create predictive models for assessing bariatric patients' risk for OSA based on symptoms consistent with OSA. 16,18,37 –40 Two of the most consistently identified factors in patients with known OSA are snoring and observed apneas. 41,42 Our study confirmed that virtually all of our patients who reported observed apneas while sleeping had an AHI ≥5 and an AHI ≥15 on PSG. We were unable to separate women without OSA from those with OSA or women with mild OSA from patients with moderate/severe disease based on our models.
Ultimately, however, these models are based on the relatively low bar of statistical significance. This should be viewed as a necessary but not sufficient criterion. A predictive model should be assessed based on performance in the context in which it would be used. For example, although symptoms of snoring and observed apneas were clearly (and significantly) related to OSA, they could not be used effectively to identify patients without OSA, as there were many patients found to have OSA without either of these symptoms.
The current study sought to augment the approach taken by others 16 –18 by similarly constructing the best possible statistical models for predicting AHI, then using the algorithm defined by the model to create an index score (predicted AHI), which was submitted to a battery of evaluations for diagnostic utility. This approach provides a best-case scenario, as the models are fit for the same set of patients. The results using the same algorithm on different patients (i.e., a validation study) would almost certainly be inferior to those of the current analyses. Thus, this analytical strategy highlights the distinction between statistical significance and precision in prediction models.
There was unequivocal statistical significance for our factors, but our models failed to provide the precision necessary for clinical use. The implication considering our design is that a model with fixed parameters applied to other populations would exhibit further limitations. Our models failed to reach the degree of precision necessary for clinical application, but this does not mean other models suffer similarly. It does, however, suggest that the use for which other models are developed should be rigorously specified and validated. Use should not be based on solely statistical significance but should be based on a study design that further tests use directly.
One methodological concern with our study is that symptoms were based on patients' self-report, which are subjective and can be influenced by various reporter biases. For example, snoring requires a bed partner or family member to hear the snoring. Another limitation is absence of neck circumference data in many of the patients. This reduced our sample size for certain analyses, although we do not believe that fewer missing data points for neck circumference would have altered the performance of our prediction models. Third, we did not collect information about menopausal status in our patients, and this is certainly a measure of interest in this population. Overall, the patients were young, however, so this may not have affected the outcomes of our analyses. Finally, we did not include race or ethnicity as a factor in these analyses, as this information was not routinely recorded for the patients' clinical evaluation.
Conclusions
Clinically significant OSA occurs in most women planning bariatric surgery as a treatment for obesity. Given the high prevalence of OSA in this population, predictive models based on clinical characteristics are not effective for predicting AHI. The finding that the absence of symptoms did not preclude the presence of significant sleep apnea implies that it is difficult for a healthcare provider to exclude the diagnosis of OSA in women with obesity or distinguish between mild and moderate/severe disease by history and physical examination findings alone. In light of the significant morbidity and mortality associated with untreated OSA, particularly in the perioperative period, women with obesity who are planning bariatric surgery should be evaluated for OSA with PSG until better prediction models or alternate diagnostic technologies can be developed to meet the needs of the many patients who require screening for sleep-disordered breathing.
Footnotes
Disclosure Statement
No competing financial interests exist.