




Abstract
Background:
There are substantial variations in cardiovascular disease (CVD) risk and outcomes among women. We sought to determine geographic variation in risk factor prevalence in a contemporary sample of U.S. women.
Methods:
Using 2008–2009 Sister to Sister (STS) free heart screening data from 17 U.S. cities, we compared rates of obesity (body mass index [BMI] ≥30 kg/m2), hypertension (HTN ≥140/90 mm Hg), low high-density lipoprotein cholesterol (HDL-C <40 mg/dL), and hyperglycemia (≥126 mg/dL) with national rates.
Results:
In 18,892 women (mean age 49.8 ± 14.3 years, 37% black, 32% white, 14% Hispanic), compared to overall STS rates, significantly higher rates were observed for obesity in Baltimore (42.4%), Atlanta (40.0%), Dallas (37.9%), and Jacksonville (36.0%); for HTN in Atlanta (43.9%), Baltimore (42.5%), and New York (39.1%); for hyperglycemia in Jacksonville (20.3%), Philadelphia (18.1%), and Tampa (17.8%); and for HDL-C <40 mg/dL in Phoenix (37.4%), Dallas (26.5%), and Jacksonville (18.1%). Compared to national American Heart Association (AHA) 2010 update rates, most STS cities had higher rates of hyperglycemia and low HDL-C.
Conclusions:
In a large, community-based sample of women nationwide, this comprehensive analysis shows remarkable geographic variation in risk factors, which provides opportunities to improve and reduce a woman's CVD risk. Further investigation is required to understand the reasons behind such variation, which will provide insight toward tailoring preventive interventions to narrow gaps in CVD risk reduction in women.
Introduction
Cardiovascular disease (CVD) remains the leading cause of death in women. 1 Each year, more women than men die of CVD, but this burden is not distributed equally. Previous work has shown that CVD risk factors vary by age, gender, race, ethnicity, and region. For example, black women have substantially higher rates of hypertension (HTN) at all ages compared with other racial and ethnic groups. 1 Minority women have higher rates of overweight and obesity, sedentary lifestyle, and diabetes, whereas non-Hispanic white women have higher rates of hypercholesterolemia. Regionally, the southeast United States exhibits the highest rates of HTN and stroke, earning the designation, Stroke Belt. Further, within the United States, obesity rates are highest in the east, diabetes rates are highest in the south, and a high rate of both plagues the southeast. 2,3 Risk factor prevalence rates are often reported on a national level, however, which tells us little about city risk, even though most initiatives are carried out at the community level. Understanding variation provides opportunities for tailored interventions to improve CVD outcomes.
Variance in the prevalence of CVD risk factors has been observed by multiple investigators. 4 –9 Many experts believe disparities surrounding geography act as proxy measures for high-risk populations and that mapping risk factor prevalence geographically allows at-risk communities to be located. This results in better community outreach and more cost-effective resource allocation. A Canadian group found that risk factors tend to cluster within regions and are highly associated with socioeconomic status (SES) but are not entirely explained by SES. 4 The British Regional Heart Study found a higher incidence of CVD events in the Northern regions, which was predicted mostly by lifestyle factors on individual analysis. 10 The German Cardiovascular Prevention Study found that after controlling for SES, regional effects were small compared to individual effects. 11 No single parameter can explain community differences. Multiple factors make up a community, such as racial and ethnic majorities, education, and income, in addition to local conditions that affect lifestyle, such as climate, grocery stores, transportation, safety, and parks and open spaces. Reasons for regional variance reflect a profound amount of interplay between a region and the population inhabiting it. Still, a paucity of evidence exists in this area; thus, describing variance patterns is difficult. Understanding regional variance will allow us to recognize what risk factors exist within communities and how we can more effectively approach prevention.
Sister to Sister: The Women's Heart Health Foundation, is a national grass-roots effort that provides free public heart screenings for women annually and offers a unique opportunity to explore regional variance and risk. Since its creation in 2000, more than 10,000 women each year attend Sister to Sister (STS) fairs held in major cities across the United States. Using this nationally representative sample of women, we sought to determine and compare rates of obesity, HTN, hyperglycemia, and low high-density lipoprotein cholesterol (HDL-C) between cities and with national rates.
Materials and Methods
The study sample was drawn from women who attended the 2008 and 2009 STS screening events held in 17 U.S. cities. Of the hosting cities, 12 (Atlanta, Georgia, Baltimore, Maryland, Boston, Massachusetts, Chicago, Illinois, Dallas, Texas, Detroit, Michigan, Jacksonville, Florida, Los Angeles, California, Miami, Florida, St. Louis, Missouri, Tampa, Florida, and Washington, DC) held annual fairs in both 2008 and 2009, and 5 cities (Charlotte, North Carolina, Indianapolis, Indiana, New York, New York, Philadelphia, Pennsylvania, and Phoenix, Arizona) held fairs in 2008 only. Events were advertised on the STS website, through local advertisements, and by word of mouth in the month before the events. Women who attended the screenings lived within the urban center of the city and surrounding areas. Each screening event consisted of a standardized questionnaire, cardiometabolic physical screening, receipt of health education materials, and counseling about identified risk factors and preventive measures. Bilingual experts were available to participants in most cities.
All women with a signed consent form, a completed questionnaire, and valid vital sign and serum value determinations were included in the study. Consent forms and screening procedures were approved by Quorum Institutional Review Board (Seattle, Washington).
Screening
The standardized questionnaire included demographic data and personal and family history of CVD. Demographic data included address, age, gender, and racial and ethnic background. Race and ethnicity reflected Census categories: black or African American, white, Asian/Pacific Islander, American Indian or Alaskan Native, and other race. Ethnicity was categorized as Hispanic or non-Hispanic. Additional demographic data were available from the 2009 screenings and included annual household income, current primary care provider (PCP), insurance status, and prescription coverage. Family history of premature CVD was defined as having a first-degree relative who suffered a heart attack or who underwent bypass, stent, or angioplasty before the age of 55 in men and 65 in women.
Cardiometabolic measures
Cardiometabolic risk factor measures included blood pressure, body mass index (BMI), waist circumference (WC), and serum measures of glucose, total cholesterol (TC), HDL-C, and triglycerides (TG). Non-HDL-C was calculated. Low-density lipoprotein cholesterol (LDL-C) was calculated when TG measures were available, dependent on local health board regulations and Cholestech® analyzer software capabilities (Iverness Medical, Hayward, CA). Each woman was provided with a summary of her screening information and individually counseled by a healthcare professional.
Trained personnel performed all measures. Blood pressure was taken while women were in a seated position after a 1–2-minute rest. A single blood pressure measure was performed using an automated blood pressure machine with an appropriately fitting cuff. BMI was calculated using the formula:
Height was self-reported, and weight was measured at the time of screening. Overweight was defined as BMI 25–29.9 kg/m2, and obese was defined as BMI ≥30 kg/m2. WC was measured while women were standing erect, with arms at sides and heels together. The measuring tape was horizontally wrapped around the superior-most part of the iliac crests and recorded to the nearest 0.1 inch. Increased WC was defined as ≥35 inches. Blood glucose and cholesterol levels were measured using Cholestech fingerstick technology, with previously proven validity. 12 Fasting and nonfasting status were recorded. LDL-C was calculated using the Freidewald equation. Non-HDL-C was calculated by subtracting HDL-C from TC.
Outcomes and national baseline rates
The primary outcomes of interest included four binary risk measures: (1) obesity, defined as BMI ≥30 kg/m2, (2) HTN, defined as systolic blood pressure ≥140 mm Hg or diastolic blood pressure ≥90 mm Hg, (3) hyperglycemia, defined as glucose ≥126 mg/dL, and (4) low HDL-C levels, defined as HDL-C <40 mg/dL. These cutoffs were determined using clinical guidelines set by the National Cholesterol Education Program Adult Treatment Panel III (NCEP ATP III), 13 along with the evidence-based guidelines for CVD prevention in women published in 2004. 14 Our cutoff of HDL-C <40 mg/dL was used to allow comparison with available prevalence data in women from the American Heart Association (AHA) Heart Disease and Stroke Statistics 2010 update, which reports low HDL-C as <40 mg/dL in women despite the currently recommended cutoff of <50 mg/dL. The hyperglycemic cutoff of glucose level ≥126 mg/dL was chosen because of the mixed fasting status of participants. Results are not meant to represent rates of diabetes but should be interpreted as impaired glucose tolerance. Our intent was to increase the threshold and, therefore, increase the specificity of an elevated glucose level.
Demographic information included age and race/ethnicity. Age was reported as a continuous variable, and race/ethnicity was categorized as white, black, Hispanic, and other. The STS data included variables for race and ethnicity, which allowed us to categorize women into four groups: white (non-Hispanic), black (non-Hispanic), Hispanic, and other race. The other category included 6% of women who declared a race/ethnicity different from white, black, or Hispanic and 11% of women of unknown race/ethnicity who were kept in the study to increase the total number of women with the primary outcome measures. Comorbid conditions included current smoking and family history of premature CVD, both defined by personal self-report and questionnaire. Socioeconomic information was obtained from city-level Census data 15 and not the self-reported data.
We obtained national prevalence rates for the four measures from the AHA Heart Disease and Stroke Statistics 2010 update 1 and used 2006 city-level sociodemographic information from the U.S. Census Bureau website. 15 From the AHA 2010 update, 1 national prevalence rates in women ≥20 years old were 34.0% for obesity, 32.6% for HTN, 7.9% for hyperglycemia (the rate of physician-diagnosed diabetes in women), and 7.9% for HDL <40 mg/dL. We used the diabetic prevalence rate, given our use of the diabetic cutoff for the hyperglycemia measure.
Statistical analysis
We conducted descriptive and bivariate analyses to illustrate women's baseline demographics, comorbidities, vital signs, and laboratory test data. We developed a hierarchical generalized linear model (HGLM) for each outcome measure, which was fitted with a random city-specific effect to account for within-city correlation of the risk measure and separate within-city variation from between-city variation. The 95% confidence interval (CI) was calculated for each estimate obtained from the models. We created a dummy variable in models to represent records that had missing age and excluded records with missing BMI, vital signs, and laboratory test data for each individual measure. Women were treated as individual observations across both years in the regression model. Using HGLM, we obtained city-specific estimated rates and compared these rates with the overall STS rate for each measure. We then divided the 17 cities into three groups: statistically significantly lower than the overall STS rate, no difference from the overall STS rate, and statistically significantly higher than the overall STS rate. Moreover, we conducted bootstrap simulations to generate a 95% CI for city-specific estimated rates for each city and each measure using the Normand-Krumholz approach. 16 We then classified cities into better than national average (i.e., the upper 95% CI is lower than the national rate), no difference from the national average, and worse than national average (i.e., the lower 95% CI is higher than the national rate). Finally, we constructed an HGLM to assess relationship between cardiometabolic risks and participant characteristics for each measure. All statistical testing was 2-sided, at a significance level of 0.05, and all analyses were conducted using SAS version 9.1.3 (SAS Institute Inc., Cary, NC).
Results
Study sample
The final study sample included 18,892 women (average age 49.8 ± 14.3 years) screened in 2008–2009 across 17 large U.S. cities. Thirty-seven percent (7,030) of the women were black, 32% (5,999) were white, 14% (2,665) were Hispanic, and 17% (3,206) were grouped into the other category (Table 1). BMI was calculated for 87% (16,409) of women, with an overall mean of 27.9 kg/m2. WC was measured in 70% (13,166) of the women, with an overall mean of 36.2 inches. Of the 18,892 women, 81% (15,317) had their cholesterol measured, 60% (11,351) had TG measured, 76% (14,291) had HDL-C measured, 56% (10,541) had LDL-C calculated, and 75% (14,251) had non-HDL-C calculated. Serum glucose was measured in 78% (14,713) of women.
Lipid measures reported in mg/dL; blood pressure measures reported in mm Hg; waist circumference reported in inches; BMI reported in kg/m2.
BMI, body mass index; HDL-C, high-density lipoprotein cholesterol; IQR, interquartile range; LDL-C, low-density lipoprotein cholesterol; SD, standard deviation.
Additional demographic survey information available from 2009-only STS screening fairs revealed 54.1% (5,105) of women had private insurance, 9.2% (868) had Medicare only, 2.5% (238) had Medicaid only, and 34.2% (3,232) had no health insurance. Seventy-eight percent (7,093) reported having a current PCP. Median household incomes from 2009 STS fairs were reported within five brackets, with 14% (1,323) of women reporting annual incomes >$75,000, 11.3% (1,063) reporting $50,000–$75,000, 12.8% (1,208) reporting $35,000–$50,000, 13.5% (1,282) reporting $20,000–$35,000, and 18.1% (1,705) reporting <$20,000. Thirty percent of women did not report their income.
Using 2006 published Census data (Table 2), 15 there was remarkable variance between city characteristics where STS fairs were held. The median household income ranged from $23,483 (Miami) to $46,975 (Charlotte), the percent below poverty ranged from 10.6% (Charlotte) to 28.5% (Miami). Miami had the highest percentage of senior citizens (17%), and Phoenix had the lowest (8.1%). Racial/ethnic variation was also remarkable, with Detroit having the highest population percentage of blacks (81.6%) and Phoenix having the lowest (5.1%). Miami had the most Hispanic women (65.8%), and Baltimore had the least (1.7%).
U.S. Census Bureau.
15
State and county quickfacts. 2010. Available at
Outcomes of measures
Observed and estimated rates for each measure varied remarkably by city (Table 3). The obesity estimated rate ranged from the lowest of 19.1% (Los Angeles) to the highest of 42.4% (Baltimore). Hypertension ranged from 17.2% (Los Angeles) to 43.9% (Atlanta), hyperglycemia ranged from 7.7% (Phoenix) to 20.3% (Jacksonville), and HDL-C <40 mg/dL ranged from 6.6% (New York) to 26.5% (Dallas). An additional analysis yielded a prevalence of HDL-C <50 mg/dL among our STS women of 32.6% (no national comparison). Figure 1 illustrates the distribution of STS cities with prevalence rates that were significantly higher or significantly lower compared to the other STS cities. The between-city variances were high across the measures even after adjusting for attendees' age, race, and smoking status. The variances (standard error [SE]) were 7.4% (2.9%), 9.1% (3.5%), 10.0% (4.1%), and 31.3% (12.0%) for BMI, HTN, glucose >126, and HDL-C <40, respectively.
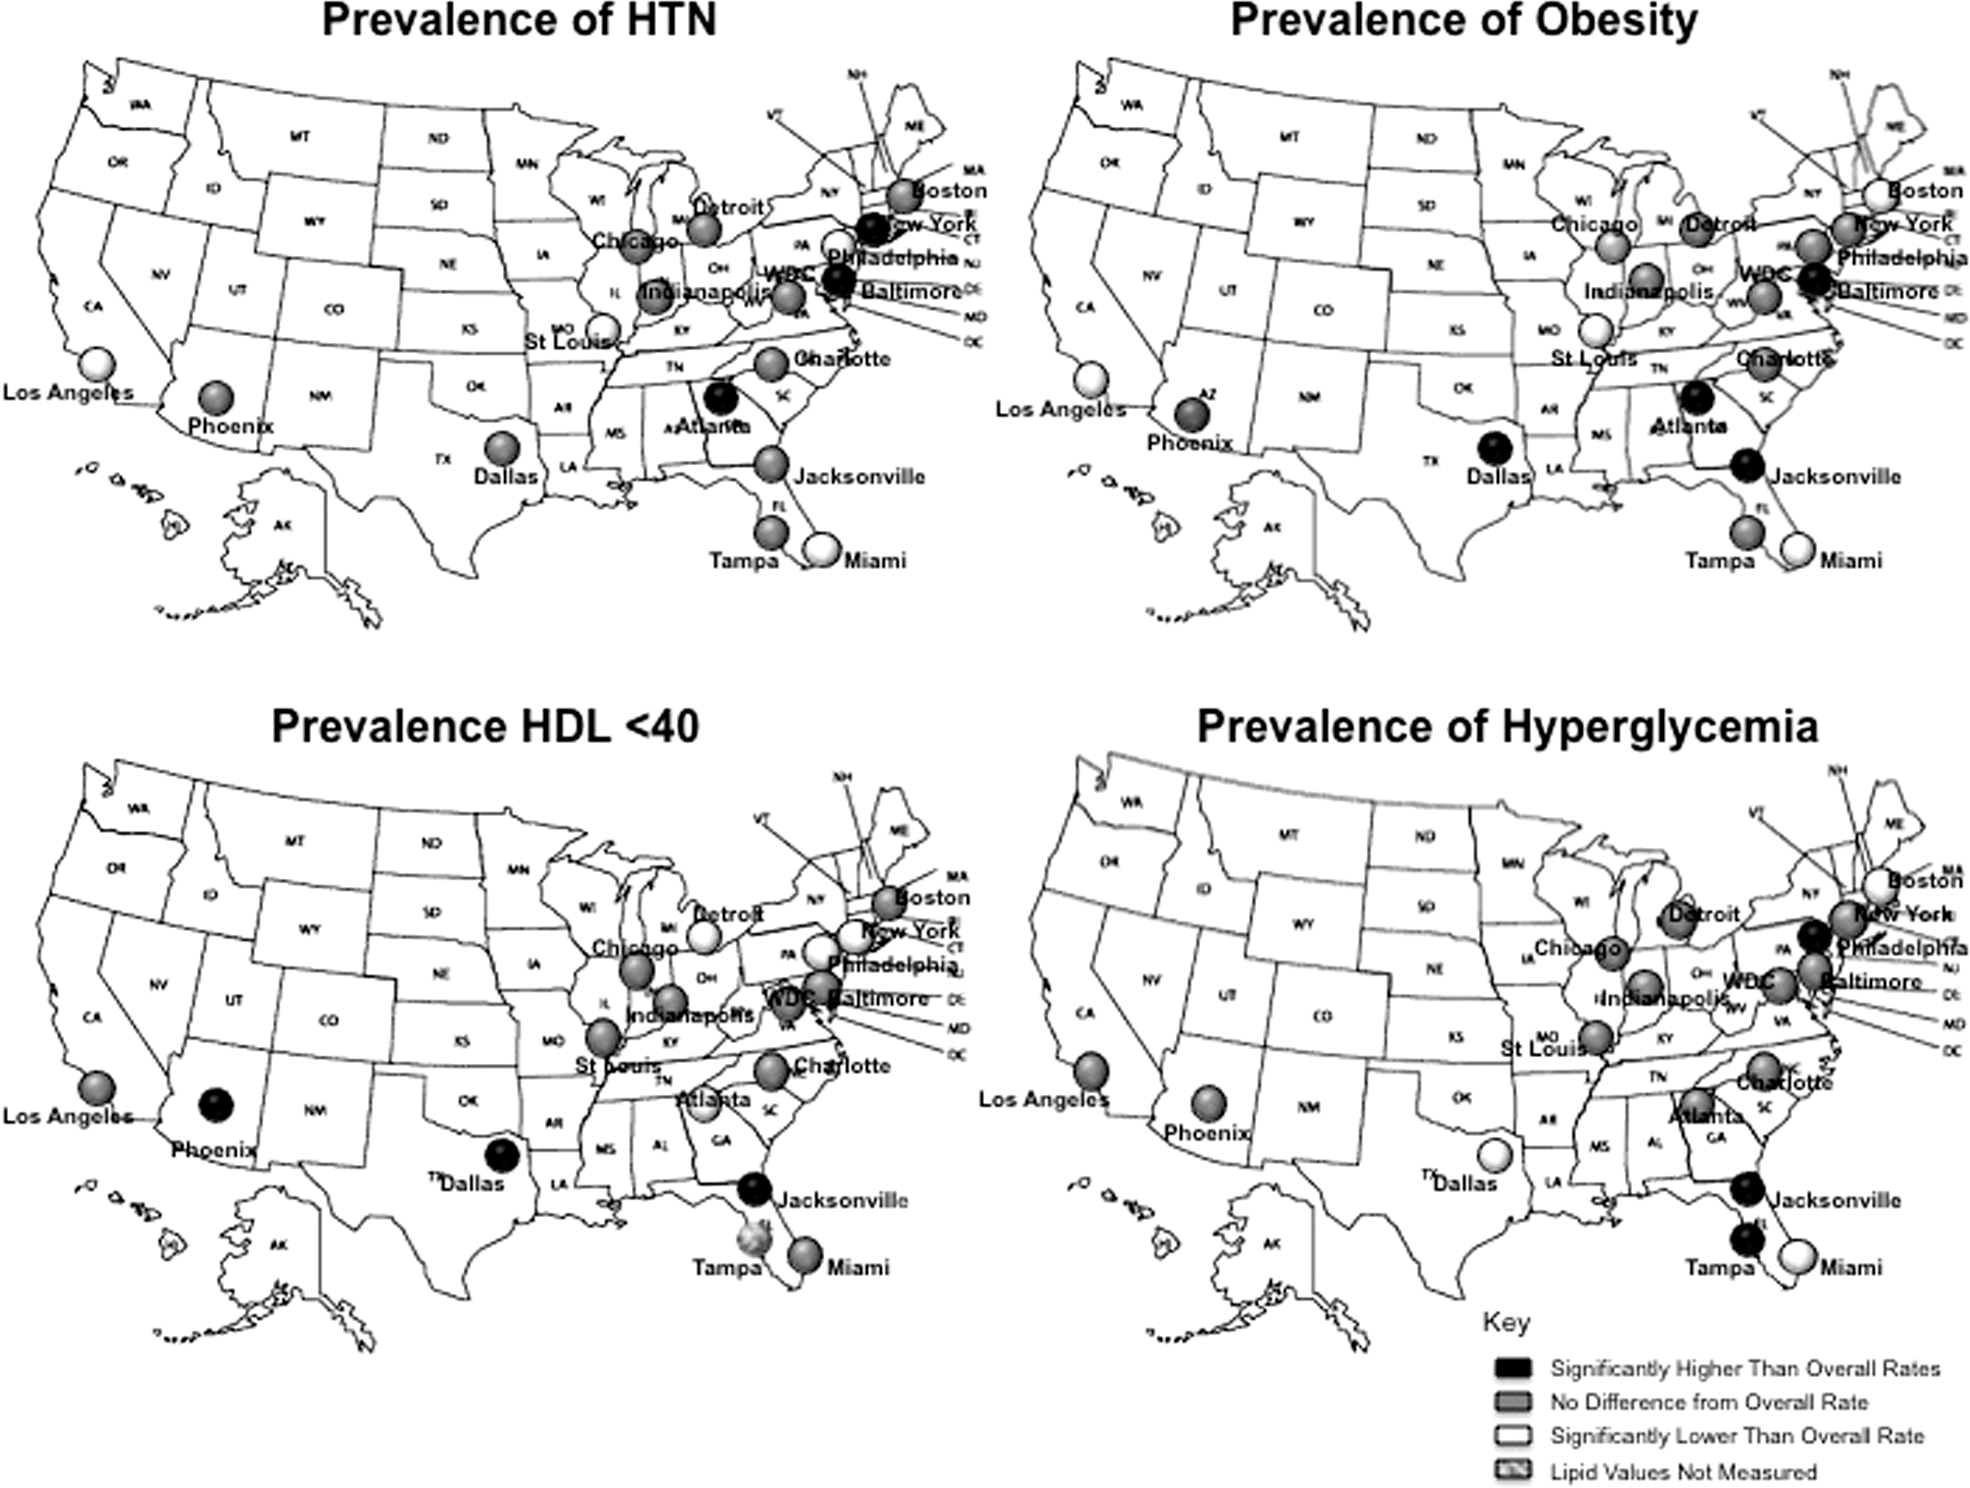
Relative comparison of overall Sister to Sister rates with city-specific rates. HTN, hypertension.
Difference in sample sizes due to missing data.
HTN, hypertension. Defined as systolic blood pressure ≥140 mm Hg or diastolic blood pressure ≥90 mm Hg.
Hyperglycemia, serum glucose ≥126 mg/dL.
Estimated rates were drawn from hierarchical regression model using Sister to Sister data and accounting for between-city variance and within-city variance.
Tampa: lipid measures were not performed secondary to restrictions by local health board.
Difference in sample size because of missing data.
N/A, not available.
Overall, STS women from 17 U.S. cities showed remarkably higher rates on measures of hyperglycemia and HDL-C <40 mg/dL compared with national rates published in the AHA 2010 update. 1 At the city level, higher than national AHA rates were seen for HTN in 4 cities (New York, Baltimore, Atlanta, and Washington), for obesity in 3 cities (Baltimore, Atlanta, and Dallas), for glucose ≥126 mg/dL in 14 of 17 cities (all but Boston, Miami, and Phoenix), and for HDL-C <40 mg/dL in 15 of 17 cities (all but New York and Philadelphia). Figure 2 illustrates STS estimated city rates in comparison to AHA nationally reported rates. Overall estimated rates of obesity, HTN, hyperglycemia, and HDL <40 mg/dL from STS (32.7%, 28.5%, 13.4%, 15.1%, respectively) compared with national rates from the AHA (34.0%, 32.6%, 7.9%, 7.9%, respectively) yielded an absolute difference of −1.3%, −4.1%, 5.5%, and 7.2%, respectively.

Comparison of Sister to Sister city-specific rates with American Heart Association 2010 update national rates.
Black women were more likely to be obese (odds ratio [OR] 2.16, 95% CI 1.79-2.60) and hypertensive (OR 1.66, 95% CI 1.48-1.85) (Table 4). Hispanic women were more likely to have HDL-C<40 mg/dL (OR 1.35, 95% CI 1.14-1.59) and less likely to have HTN (OR 0.84; 95% CI 0.72-0.97). Overweight was significantly associated with increasing risk of HTN, hyperglycemia, and HDL-C <40 mg/dL.
BMI ≥ 30.
≥140/90 mm Hg.
Glucose ≥126 mg/dL.
Discussion
Using a large, diverse sample of community women, this study showed remarkable geographic variation for risk factor rates in STS cities. As expected, city-specific rates did not always correspond with nationally reported rates, and each city had a unique risk factor profile. Overall, the prevalence of HTN and obesity among STS participants was consistent with national rates according to those reported in the AHA 2010 update, 1 whereas substantially higher rates of hyperglycemia and low HDL-C were observed within our STS population compared with AHA nationally reported rates (Fig. 2).
We believe the comparisons between the national prevalence rates reported by the AHA and our STS rates are fair and reliable, given the age similarities in the two groups. One inconsistency might stem from our oversampling of black and Hispanic women and might account for some of the differences observed. When cities were analyzed individually, there was substantial variability in the risk factor profiles. Compared to overall STS rates, Atlanta and Baltimore had significantly higher rates of obesity and HTN yet had average rates for low HDL-C and hyperglycemia (Fig. 1). Jacksonville had a significantly higher rate of obesity, low HDL-C, and hyperglycemia. Dallas showed significantly higher rates of obesity and low HDL-C while also having significantly lower rates of hyperglycemia.
Associations between race and ethnicity and the outcome measures were observed. This could explain why the STS cities with the highest rates of HTN and obesity were Baltimore and Atlanta, both of which have high within-city black populations of >60%. The association between black race and HTN has already been well described and is not surprising. 1,6,17 –19 Moreover, obesity rates are known to be much higher among minority women, affecting a higher proportion compared to white women. 20 Using National Health and Nutrition Examination Survey (NHANES) 1999–2000 data, obesity rates were 30.1%, 39.7%, and 49.7% for non-Hispanic white women, Mexican American women, and black/African American women, respectively. 21,22 The pattern of adiposity also appears to be different between ethnicities. From the Coronary Artery Risk Development in Young Adults (CARDIA) study, 23 black women were found to have a larger mean waist circumference (77 cm vs. 71.7 cm, p < 0.001) than non-Hispanic white women and a larger waist/hip ratio (0.75 vs. 0.73, p < 0.001). In the San Antonio Heart Study, 24 Mexican American women were found to have a larger mean waist circumference (89.4 cm vs. 81.8 cm, p < 0.05), waist/hip ratio (0.84 vs. 0.79, p < 0.05), and BMI (30.1 vs. 27.4, p < 0.05) compared with non-Hispanic white women.
An important finding of our study was the high rate of HDL-C <40 mg/dL in all cities. We expected lower rates given the cutoff of <40 mg/dL. It is possible this is an effect of the cholesterol software used to measure cholesterol levels, but these analyzers have been validated, 12 and other lipids measured by the same devices were consistent with national rates. It could also be a reflection of the high proportion of Hispanic women represented in this sample, or it could be the result of a population with a high rate of abdominal obesity (mean BMI of 27.9 and WC of 36.2 inches), which is associated with lower levels of HDL-C. This finding is significant because high levels of HDL-C have been shown to be protective for both genders, but low HDL-C appears to be a stronger predictor of risk in women than any other lipid measure. 25 –28 From the Lipid Research Clinics' Follow-Up Study, analysis of 1,400 women followed for 14 years showed that an HDL-C level <50 mg/dL (1.30 mmol/L) was strongly associated with CVD death (RR 1.74, 95% CI 1.10-2.75). 28 This relationship held true for all levels of LDL-C and TG, as well as TC levels >200 mg/dL. Barter et al. 29 found that even in the presence of very low LDL-C levels achieved through aggressive statin therapy, low HDL-C was still predictive of future events. Hong et al. 30 found an elevated TC/HDL-C ratio was most predictive of the presence, extent, and severity of angiographically diagnosed coronary artery disease (CAD) in women. Prevention initiatives that address low HDL-C in women could have profound population affects on CVD risk reduction.
We found Hispanic ethnicity to be significantly associated with low HDL-C. This is consistent with observational and genetic studies showing lower HDL-C levels within Hispanic populations. 31 –34 In addition, high rates of the metabolic syndrome and diabetes are also observed within the Hispanic population. 25 Within the STS population, however, Hispanic ethnicity was not significantly associated with hyperglycemia. Therefore, it may be possible that Hispanics develop insulin resistance in a lower glucose range, signaling the need for ethnicity-specific cutoffs for the metabolic syndrome criteria.
Another interesting association observed was the apparently protective effect of Hispanic ethnicity against HTN. National prevalence rates for HTN broken down by race and ethnicity show similar rates of HTN in Mexican American women and non-Hispanic white women (31.6% and 31.1%, respectively) for women ≥20 years, with lower rates than black women (44.8%). 1 However, the reported HTN prevalence among all Hispanic women is only 21.0% for women ≥18. 1 Therefore, it is possible that our Hispanic population represents more than just Mexican American women or that the women within our Hispanic group were younger. Finally, although Hispanic women develop other criteria for the metabolic syndrome at high rates, HTN may not be one of them.
Although our STS population had a low rate of smoking compared with the national AHA rate (6.4% vs. 18.3%, 1 respectively), smoking was significantly associated with low HDL-C levels. This is consistent with previous work showing insulin resistance in smokers, 35 –37 increased risk of type 2 diabetes, 38 and dyslipidemias 39 in the form of increased TC, decreased HDL-C, and increased TG.
Overall, remarkable between-city variances exist across the cities studied. These variances imply that city-specific culture might impact women's CVD risks in addition to their demographics and SES. To our knowledge, this is one of the most comprehensive multicity studies to assess women's CVD risks. The strengths of the study include a large sample of community women, spanning all reproductive phases (mean age 49.8 ± 14.3 years) taken from a real-world setting. We believe this sample is representative of the entire socioeconomic spectrum in terms of income, education, and access. This study also included an oversampling of racial/ethnic minorities (Hispanic and black/African American), allowing for closer analysis of these two groups, which are traditionally underrepresented. Finally, the measures used for this study were performed by trained personnel and were not self-reported.
The limitations of our study need mention. It is possible that we had measurement error for HTN rates by using a single blood pressure measure after a 1–2-minute rest instead of the traditional 5-minute rest, perhaps capturing activity-related pressure elevations. We might also have underestimated HTN rates because we were unable to account for women with controlled blood pressure through use of antihypertensives. Serum glucose and lipid measures were not always taken while the women were fasting, and although fasting status was recorded and many women did arrive fasting, we used combined fasting and nonfasting data in our analyses. There was a lack of significant difference between fasting glucose means (104 mg/dL) and combined means (106 mg/dL), although we recognize the likely overestimation of glucose ≥126 mg/dL. We still believe these data do not deviate far from true hyperglycemic rates because they are consistent across all cities and have likely captured insulin-resistant individuals in addition to uncontrolled diabetics (diagnosed and undiagnosed). Nonfasting lipid measures could have caused artificially high TG levels, which would also increase LDL-C calculations, one of the main reasons we did not use LDL-C as an outcome measure. Additionally, we did not have direct SES information for every woman in the study and instead used city-level Census data. Because of available benchmarks, we used age-adjusted national rates from AHA 20101 for comparison. It would be more appropriate to present city-specific age-adjusted rates for efficient comparison if city-specific age-adjusted rates were available. Finally, we did not account for the possibility that a woman could attend a fair in both 2008 and 2009. Given that risk factors can change over the course of 1 year, however, they can be treated as individual observations in regression models.
The reasons for the differences in observed risk factor rates are likely complex and were not explained in entirety in this article. They appear to be driven by obesity, which was significantly but weakly associated with all risk measures and associated with race and ethnicity. Although we may not understand all the nuances that create risk factor variance, recognizing risk areas of a city serves to improve preventive initiatives so that resources are not wasted on an unnecessary intervention (e.g., blood pressure initiative in Los Angeles). This will aid in narrowing the gap for CVD risk in women and help eliminate risk disparities.
Conclusions
In a large, community-based sample of women nationwide, this comprehensive analysis shows that there is remarkable geographic variation in risk factors. This geographic variation provides opportunities to improve and reduce a woman's CVD risk. Further investigation is required to understand the reasons behind variation, which will provide insight toward tailoring preventive interventions to narrow gaps in CVD risk reduction in women.
Footnotes
Acknowledgments
J.M.F. was supported in part by a grant from Sister to Sister: The Women's Heart Health Foundation. J.L.J. was supported by the Sarnoff Cardiovascular Research Foundation, Inc.
Disclosure Statement
No competing financial interests exist.