
Abstract
Objective:
At-risk drinking, cigarette smoking, obesity, diabetes, and frequent mental distress, as well as their co-occurrence in childbearing aged women, are risk factors for adverse pregnancy outcomes. This study estimated the prevalence of these five risk factors individually and in combination among nonpregnant women aged 18–44 years by demographic and psychosocial characteristics, with a focus on racial and ethnic disparities.
Methods:
Data from the 2008 Behavioral Risk Factor Surveillance System (BRFSS) on nonpregnant women aged 18–44 years (n=54,612) were used to estimate the prevalences of five risk factors, pairs of co-occurring risk factors, and multiple risk factors for poor pregnancy outcomes.
Results:
The majority of women had at least one risk factor, and 18.7% had two or more risk factors. Having two or more risk factors was highest among women who were American Indian and Alaska Native (34.4%), had less than a high school education (28.7%), were unable to work (50.1%), were unmarried (23.3%), and reported sometimes, rarely, or never receiving sufficient social and emotional support (32.8%). The most prevalent pair of co-occurring risk factors was at-risk drinking and smoking (5.7%).
Conclusions:
The high proportion of women of childbearing age with preconception risk factors highlights the need for preconception care. The common occurrence of multiple risk factors suggests the importance of developing screening tools and interventions that address risk factors that can lead to poor pregnancy outcomes. Increased attention should be given to high-risk subgroups.
Introduction
The persistence of racial and ethnic disparities in infant mortality despite increased access to prenatal care has led public health professionals to consider preconception care as a means to reduce these disparities. 1,2 The infant mortality rates for non-Hispanic blacks (13.35 deaths per 1000 live births) and American Indians and Alaska Natives (8.28) is much higher than that of non-Hispanic whites (5.58), Hispanics (5.41), and Asians and Pacific Islanders (4.55). 3 The relatively high infant mortality rate for blacks is attributed mainly to preterm birth and low birth weight, and American Indians and Alaska Natives also suffer disparities in sudden infant death syndrome (SIDS), injury, and infections. 4,5
Improving preconception health and healthcare, which includes reproductive planning, can improve pregnancy outcomes by improving the overall health of women. 6,7 These improvements can aid also in reducing disparities in poor health outcomes by addressing disparities in preconception risk factors. 8,9 Screening by a knowledgeable professional can identify unrecognized risks to the mother and child. 10 Preconception counseling can increase a woman's knowledge and, more importantly, the likelihood that she will make any behavioral changes needed before and during pregnancy to reduce the risk of adverse pregnancy outcomes. 11 The benefits of preconception counseling may be even greater for minority women, who are more likely to initiate late prenatal care. 12 Because many women do not realize they are pregnant until 4–6 weeks into their pregnancy, often it is too late if a woman waits until beginning prenatal care to address some health risk issues (such as alcohol consumption and cigarette smoking) that can harm the fetus during the early weeks of pregnancy. 13 Because approximately half of all pregnancies in the United States are unintended and approximately 21% of births are from unintended pregnancies, preconception care, which includes reproductive planning, needs to be included in primary and specialty care during a woman's reproductive years. 14 –16
This study examined the prevalence of five selected preconception risk factors: at-risk drinking, cigarette smoking, obesity, diabetes, and frequent mental distress, as well as their co-occurrence. If a woman drinks during pregnancy, her child is at risk for a fetal alcohol spectrum disorder (FASD); FASDs include birth defects, neurodevelopmental deficits, and growth deficiencies. 17 Tobacco use during pregnancy increases the risk of ectopic pregnancy, spontaneous abortion, stillbirth, neonatal death, SIDS, low birthweight, and small for gestational age (SGA). 18 –20 Obesity has been associated with a number of adverse reproductive health outcomes, including being infertile and having pregnancy-related diabetes and hypertension, a cesarean section, and stillbirth. 21 –23 Diabetes has been associated with spontaneous abortion, preterm delivery, preeclampsia, and congenital malformation. 24 –28 Maternal stress, depression, and problems with emotions, which are included in the frequent mental distress measure, have been associated with preterm delivery, low birthweight, and SGA. 29 –32
The data used to examine the prevalence of the five individual preconception risk factors, as well as their co-occurrence as multiple risk factors (two or more), was the population-based 2008 Behavioral Risk Factor Surveillance System (BRFSS). Documenting the occurrence of multiple risk factors and risk factor pairs is important because they have implications for understanding risk and developing interventions. Also, risk factors may interact synergistically. 33, 34 Much more research is needed on the effectiveness and implementation of bundling interventions that address more than one risk factor. 15,35 Determining the need and prioritizing the development of interventions that address multiple risk factors can be aided by examining the prevalence of their occurrence nationally and by psychosocial characteristics. Interventions that address multiple risk factors may help to improve preconception care and reduce disparities in poor birth outcomes.
Materials and Methods
Data source
The data used in this study were from the 2008 BRFSS, an ongoing telephone survey conducted by state health departments in collaboration with the Centers for Disease Control and Prevention (CDC) to assess health risk behaviors and preventative health practices related primarily to chronic disease and injury.
36
BRFSS data are obtained through an independent household probability sample drawn from noninstutionalized adults (aged ≥18 years). Data are weighted to account for the probability of selection and reflect the age, sex, and racial and ethnic distribution of the respondent's state of residence. BRFSS methods have been described in detail elsewhere.
37
BRFSS questionnaires, data, and reports are available at
Measures
Having multiple risk factors was defined as having two or more risk factors of the five risk factors examined in this study: at-risk drinking, smoking, obesity, diabetes, and frequent mental distress. The selection of these potentially modifiable risk factors was based on a report to improve preconception health by the CDC/Agency for Toxic Substances and Disease Registry (ATSDR) Preconception Care Work Group and the Select Panel on Preconception Care and on the availability of data on these risk factors in the BRFSS. 6 At-risk drinking was defined as consuming on average more than seven drinks per week or four or more drinks on one occasion during the past 30 days. Smoking was defined as a woman having smoked at least 100 cigarettes during her lifetime and at the time of interview, indicating that she was smoking cigarettes every day or on some days. Obesity was defined as having a body mass index (BMI=weight (in kilograms)/height (in square meters) ≥30). Being categorized as having diabetes was based on a “yes” response to the question: Have you ever been told by a doctor that you have diabetes? This category included all women who were told they had diabetes whether or not they were pregnant at the time. We included women with gestational diabetes in the at-risk group because the American Diabetes Association (ADA) and the American College of Obstetricians and Gynecologists (ACOG) Committee on Obstetric Practice recommend more frequent screening for women with a history of gestational diabetes to provide these women who are more likely to develop diabetes and gestational diabetes during future pregnancies opportunities to improve preconception glucose control before subsequent pregnancies. 38,39
Psychologic distress was assessed with the question: Now thinking about your mental health, which includes stress, depression, and problems with emotions, for how many days during the past 30 days was your mental health not good? This question was first included in the BRFSS in its health-related quality of life module in 1993 along with three other questions about number of days of poor physical health, number of days of activity limitation, and general health status. 40 These questions have been shown to have high retest reliability and good construct validity and to correlate well with the clinically validated Medical Outcomes Study Short Form 36 (SF-36). 41 –44 Women who reported ≥14 days of not good mental health were categorized as having frequent mental distress, a measure that has been used in other studies as well. 45 –48
Statistical analysis
Prevalence estimates and 95% confidence intervals (CI) were calculated for the reported number of risk factors, for each of the five risk factors among all respondents, and for each of the five risk factors by the number of reported risk factors. Prevalence estimates and 95% CIs were calculated for respondents with 0, 1, 2–3, 4–5, and ≥2 risk factors by six demographic and psychosocial characteristics: age (18–24, 25–34, and 35–44 years), race and ethnicity (white, black, Hispanic, Asian, and American Indian and Alaska Native), highest level of education completed (less than a high school education, a high school education, having some college, and being at least a college graduate), current employment status (employed, unemployed, homemaker, student, unable to work, and retired), marital status (married and unmarried), and frequency of receipt of sufficient social and emotional support (always; usually; and sometimes, rarely, or never). All references to a specific race refer to non-Hispanic members (e.g., non-Hispanic white and non-Hispanic black). Analyses include members of other racial/ethnic groups (n=856). This group includes non-Hispanic respondents who reported their race as Native Hawaiian or other Pacific Islander, other race, or multiracial with no preferred racial identification. Respondents were read a list of possible responses to the current employment status question that included unable to work. The reason why a respondent reported unable to work was not ascertained during the interview. The frequency of receipt of sufficient social and emotional support was based on the question: How often do you get the social and emotional support you need?
Prevalence estimates of the 10 possible pairs of risk factors among all respondents were calculated. The prevalence of pairs among respondents with exactly two risk factors and of combinations of three among respondents with exactly three risk factors was also calculated. Adjusted odds ratios (ORs) were calculated to assess the association of multiple risk factors with age, race and ethnicity, education, employment status, marital status, and frequency of receipt of sufficient social and emotional support. SAS (version 9.2) and SUDAAN (version 10.0) were used to account for the complex sampling design and to calculate accurate variance estimates.
Results
Having multiple risk factors (two or more risk factors) was reported by 18.7% of the women, one risk factor by 33.3%, and no risk factors by 48.0% (Fig. 1). Of the five risk factors examined in this study, obesity (23.4%) was the most commonly reported risk factor and diabetes the least (5.8%) (Fig. 2). Smoking was the most common risk factor among respondents with multiple risk factors (Table 1).

Prevalence of number of risk factors. Note: 25 respondents of 54,612 reported having all 5 risk factors.
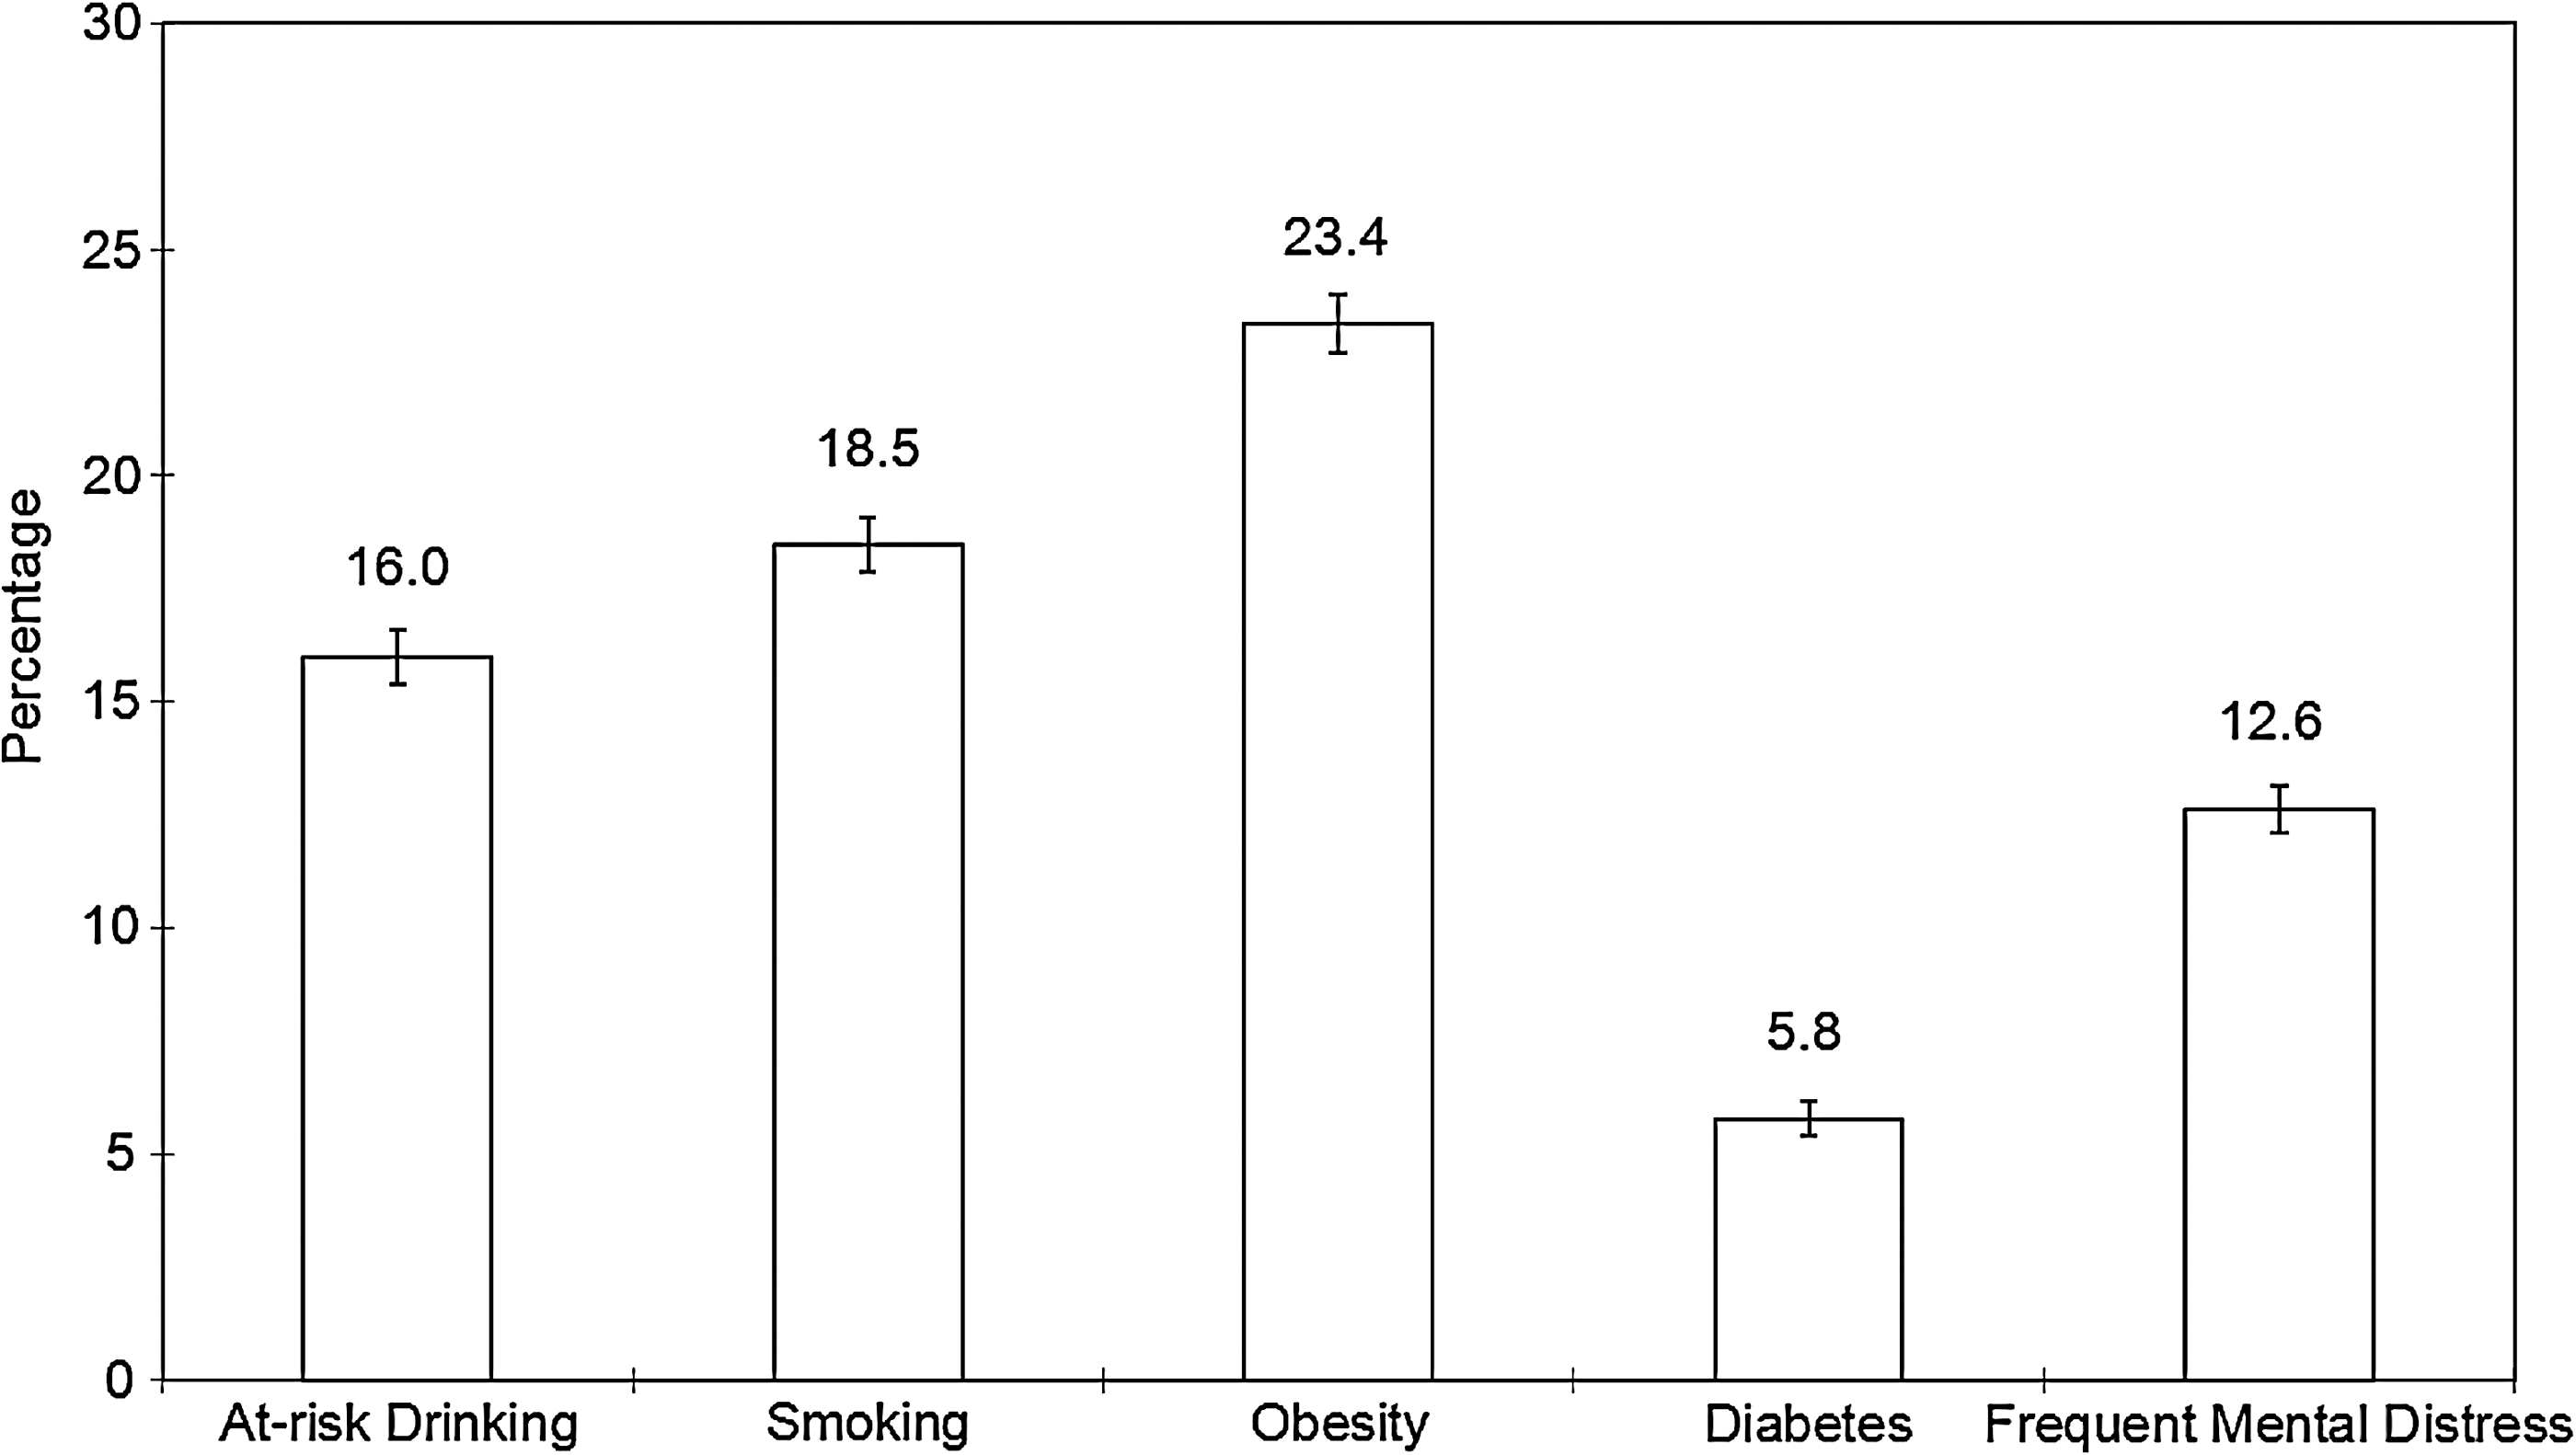
Prevalence of preconception risk factors.
Weighted percentage.
CI, confidence interval.
The prevalence of at-risk drinking was highest among American Indian and Alaska Native women (20.6%) and white women (18.9%) and lowest among Asian women, (6.5%) (Fig. 3). Smoking followed the same pattern, with a prevalence of 32.6% among American Indian and Alaska Native women, 21.4% among white women, and 5.0% among Asian women. The percentage of women who were obese was highest among black women (38.1%), followed by American Indian and Alaska Native women (32.9%), and lowest among Asian women (6.5%). The prevalence of diabetes was highest among American Indian and Alaska Native women (10.0%), followed by Hispanic women (8.2%). American Indian and Alaska Native women were most likely to report frequent mental distress (18.0%), and Asian women were least likely (7.1%).
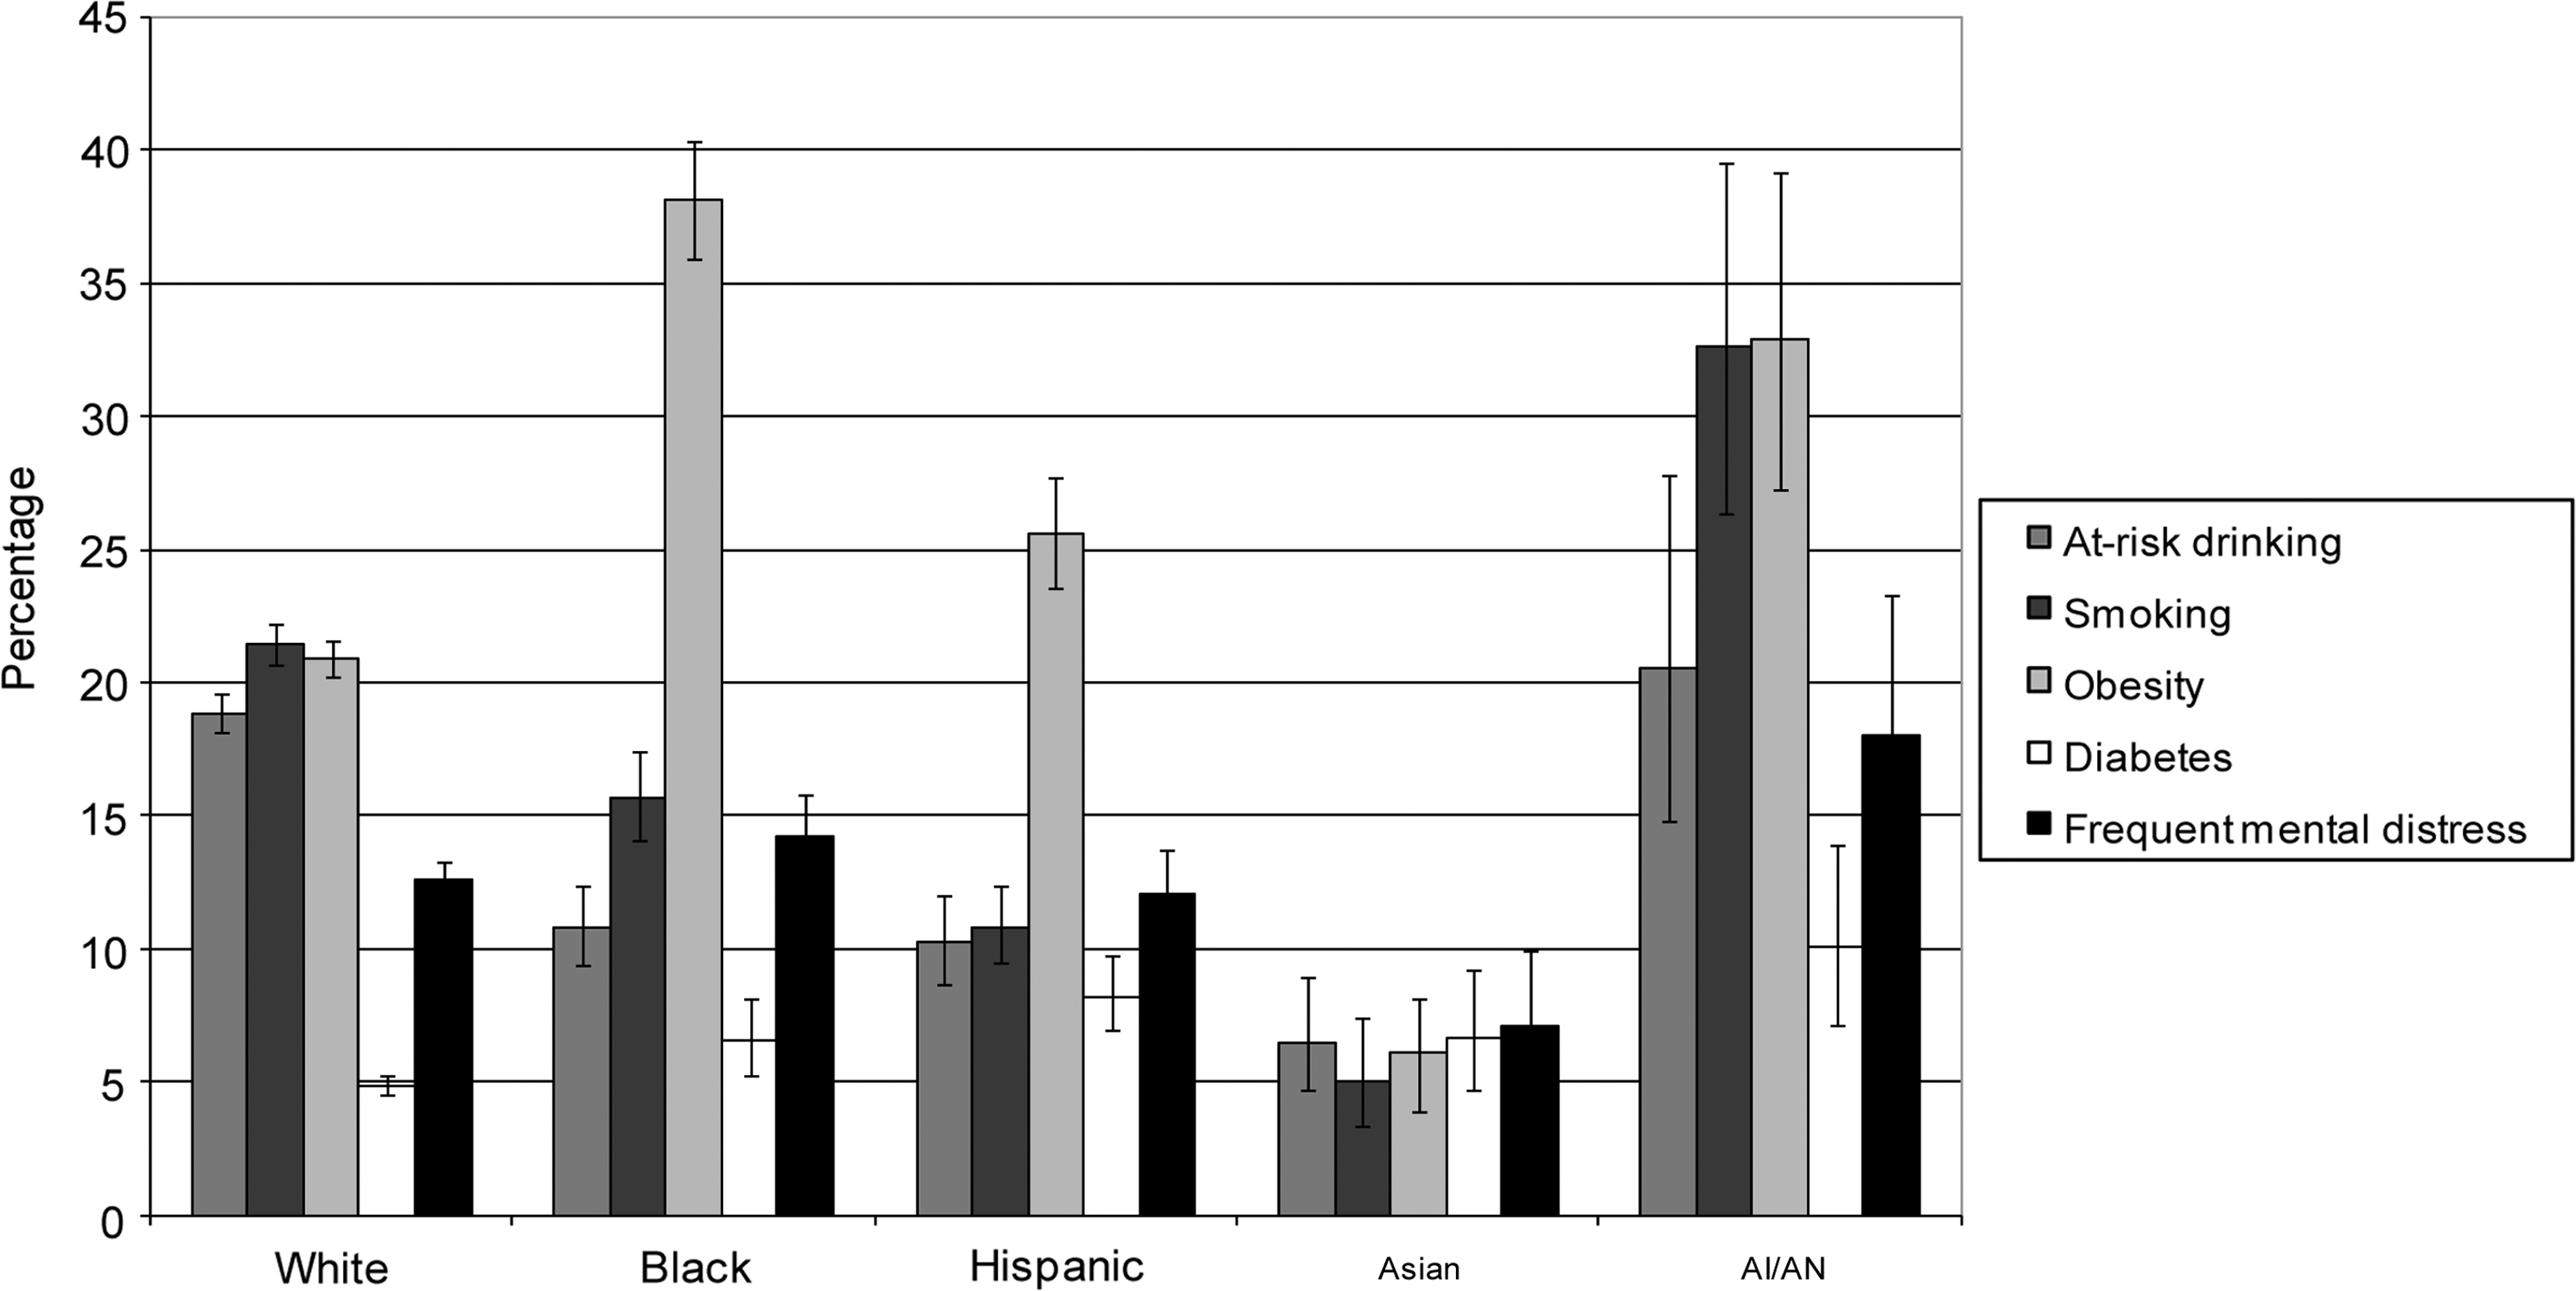
Prevalence of preconception risk factors by race and ethnicity. AI/AN, American Indian/Alaska Native.
Among all respondents, the two most prevalent pairs of risk factors were at-risk drinking and smoking (5.7%) and smoking and obesity (5.0%) (Table 2). Among respondents with exactly two risk factors, the most common pairs were also at-risk drinking and smoking (22.9%, 95% CI 21.1-24.9) and smoking and obesity (15.9%, 95% CI 14.6-17.3). The two most common combinations of three risk factors among respondents with exactly three risk factors were smoking, obesity, and frequent mental distress (24.3%, 95% CI 21.2-27.7) and at-risk drinking, smoking, and frequent mental distress (22.9%, 95% CI 19.8-26.2).
A woman might have had more than one co-occurring risk factor pair; e.g., a woman with three risk factors would have had three pairs.
Weighted percentage.
FMD, frequent mental distress.
The prevalence of having multiple risk factors (two or more) varied little by age (Table 3) (Appendix, supplemental material available on line at
Weighted percentage.
Table 4 shows the results of the multivariate logistic regression analysis that included age, race and ethnicity, education, employment, marital status, and frequency of receipt of sufficient social and emotional support in the model. Black, Hispanic, and Asian women were less likely to have multiple risk factors than white women. However, American Indian and Alaska Native women were almost 50% more likely to have multiple risk factors than white women. Women with less than a high school education were three times more likely to have multiple risk factors than women with at least a college education. Women who were unemployed or unable to work were more likely to have multiple risk factors than those who were employed, homemakers, or students. Women who reported sometimes, rarely, or never receiving sufficient social and emotional support were almost two and a half times more likely to have multiple risk factors than women who reported always receiving sufficient social and emotional support.
Multiple risk factors, defined as two or more of the following: at-risk drinking, smoking, obesity, diabetes, and frequent mental distress.
Includes racial/ethnic groups not shown separately (n=856).
AOR, adjusted odds ratio, adjusted for all other covariates.
Discussion
This study found that over half of the women in this representative sample of reproductive age women in the United States had at least one and 18.7% had two or more of the five selected risk factors for adverse pregnancy outcomes. Given that 52.0% of the women had at least one preconception risk factor, the need to increase preconception care in primary and specialty care systems is supported by the findings of this study. 15,49 It should be noted that the strength and quality of the evidence on which clinical care recommendations are based to address specific risk factors in preconception care vary from properly conducted randomized controlled trials done before pregnancy to opinions of respected authorities based on clinical experience. 14,50 Most of the research on addressing specific risk factors was conducted on an intervention for a single risk factor and not in the context of improving pregnancy outcomes. More research specifically in the context of preconception care and on bundling interventions is needed.
The prevalence of multiple risk factors for adverse pregnancy outcomes shows that many women need assistance addressing more than one risk factor during the preconception period in order to reduce the risk of adverse pregnancy outcomes. Among the pairs of co-occurring risk factors, the pair comprising at-risk drinking and cigarette smoking was the most common. This is the first study of which we are aware that has analyzed the prevalence of co-occurring preconception risk factor pairs. Because of the prevalence of at-risk drinking and smoking, it would be strategic to consider interventions that address this risk factor pair when developing interventions for preconception care. The prevalence of multiple risk factors was highest among women who were American Indian and Alaska Native, less educated, unemployed or unable to work, unmarried, or sometimes, rarely, or never received sufficient social and emotional support. Brief physician counseling may not be sufficient to reduce preconception risk factors among women of low socioeconomic status. 51 There has been some success in reducing risk factors among this group of women through outreach, support, case management, small group interventions, and motivational interviewing, but more research is needed. 8,52,53
Changes in chronic disease-related risk factors and health conditions among women of childbearing age were estimated by Ahluwalia et al. 54 for the time periods 1991–1992 and 2000–2001 using BRFSS data. This study's current smoking estimate for women aged 18–44 years (18.5%), based on 2008 data, was lower than theirs for the periods 1991–1992 (23.3%) and 2000–2001 (25.7%). This study's obesity estimate (23.4%), also for 2008, was higher than theirs for 1991–1992 (9.7%) and 2000–2001 (17.3%). These differences between studies are consistent with the recent trend for an overall decrease in smoking and increase in obesity occurring in the United States. 55,56
Other studies have looked at risk factors for adverse pregnancy outcomes based on pregnancy status and pregnancy intention using BRFSS data from 2002 and 2004, when a family planning module was included in the questionnaire. Anderson et al. 57 compared women intending to have a child within the next 12 months with women who were already pregnant and found that the women intending to have a child were more likely than the pregnant women to have engaged in binge drinking (10.7% vs. 1.9%), have smoked (19.4% vs. 8.4%), have been told they had diabetes (2.0% vs. 0.7%), and report frequent mental distress (12.8% vs. 9.6%). Xaverius et al. 58 compared health behaviors among women in five categories: pregnant, intended pregnancy (no contraception use), unintended high risk (no contraception use), unintended moderate risk (periodic contraception use), and unintended low risk (continuous contraception use), also using BRFSS data from 2002 and 2004. They found that pregnant women had healthier behaviors than nonpregnant women and women intending to become pregnant had healthier behaviors than women not intending to become pregnant. The unintended high-risk group compared to the unintended moderate-risk and the unintended low-risk groups, respectively, reported obesity (23.1% vs. 17.5% and 16.5%) and smoking (25.9% vs. 21.4% and 20.6%) more, and binge drinking (11.0% vs. 14.3% and 15.3%) less. Because those previous studies analyzed the data by different subgroups, it was difficult to make direct comparisons between them and the current study. However, the findings of those studies generally supported each other and concluded that there was a significant need for preconception healthcare.
This is the first population-based study of preconception risk factors of which we are aware that included Asians, Americans Indians, and Alaska Natives among its racial categories. American Indian and Alaska Native women had the highest prevalence of multiple risk factors among all the racial and ethnic groups in the study. This probably was because they had the highest prevalence for all but one (obesity) of the five risk factors. Other studies have shown higher prevalences of smoking and drinking while pregnant among American Indian and Alaska Native women than among other racial and ethnic groups. 4,59,60 Asian women had the lowest prevalence of multiple risk factors and for all but one (diabetes) of the five risk factors. Asians are a very heterogeneous group, and collapsing them into one group might have masked differences in preconception risk factors among Asian subgroups, as has been found to be the case with perinatal outcomes. 61 Clinicians may wish to consider the significant disparity in prevalence by racial and ethnic group in any effort to address preconception risk factors.
In this study, black women had only a slightly higher prevalence of multiple risk factors than white women, and after controlling for demographic and psychosocial characteristics, their likelihood of having multiple risk factors was less than that of white women. This was somewhat surprising because the infant mortality rate for blacks (13.35 deaths per 1000 live births) is over twice that of the rate for whites (5.58). 3 Blacks also have higher rates than whites of pregnancy-related mortality, low birthweight, and preterm births that cannot be explained wholly by differences in socioeconomic status. 3,62 –66 In other words, the presence of two or more of the preconception risk factors in our study does not seem to correlate with the known disparities in birth outcomes between black and white women. Some possible explanations are that this study did not include risk factors that would have explained these outcome disparities or that some risk factors that were included have a bigger effect on pregnancy outcomes than others, such as obesity, diabetes, or frequent mental distress, which are more prevalent among black women than white women.
Black women reported a slightly higher prevalence of frequent mental distress than white women, which also might have contributed to an explanation of the disparities in pregnancy outcomes between the two groups that was not explained by the presence of multiple risk factors. Giscombé and Lobel 67 reviewed the literature on five explanations for the disparity in pregnancy outcomes between blacks and whites: (1) differences in health behaviors and socioeconomic status, (2) higher levels of stress among black women, (3) greater susceptibility to stress among black women, (4) the effect of racism as either a contributor to stress or as a factor that exacerbates the effects of stress, and (5) racial differences in stress-related neuroendocrine, vascular, and immunologic processes. They did not find any of these explanations to fully explain the disparities, acknowledged methodologic and measurement challenges, and suggested further research on the relationship between racism and stress. Based on issues discussed in their review and other articles, the measure of frequent mental distress used in this study might not have been able to capture completely the stress differences between black and white women if black women had a greater cumulative burden of stress than white women (the BRFSS question only asked about the last 30 days), if black women did not report stress due to racism because they were accustomed to it, and if stress due to racism has a more negative effect on the fetus than other forms of stress. 67 –69
The findings of this study were subject to a number of limitations. BRFSS data are self-reported and subject to recall bias. Underreporting of at-risk drinking and obesity is likely to have occurred because of social desirability bias. 70 –72 Diabetes was probably underreported also because the measure used in this study was based on self-report, and approximately 30% of diabetes cases are undiagnosed. 73 The measure of frequent mental distress used in this study may not have been able to capture completely the stress differences between racial and ethnic groups if women of some groups had a greater cumulative burden of stress, as the BRFSS question only asked about the last 30 days. 67,69 Most states conducted BRFSS interviews in English and Spanish only, which might have affected the prevalence estimates of racial and ethnic groups differently. The 2008 BRFSS excluded households with only cellular telephone service. Therefore, the results of the BRFSS might not have been representative of all women of childbearing age. Young adults are more likely than older adults to live in cell phone-only households. 74 Furthermore, young adults in cell phone-only households are more likely to report binge drinking than young adults in households with landlines. 75,76 Finally, we did not examine preconception health risk factors that were not available in our data set, such as the use of certain anti-epileptic drugs, folic acid deficiency, and sexually transmitted diseases.
In this study, the majority of women had at least one of the five risk factors examined, and almost one in five women had two or more risk factors. The overall prevalence of having any preconception risk factor supports the need to increase preconception care. 14,50 Minority women are more likely to be uninsured than white women, mainly because of greater levels of poverty. 77 Poor women who are not pregnant, do not have children, and are not disabled would benefit from access to preconception care but are not generally eligible for Medicaid, the United States health program for certain people who cannot afford to pay for medical care. 77 Increased access to preconception care is needed to reduce disparities in preconception risk factors and birth outcomes. Furthermore, because of the frequent occurrence of multiple risk factors, public health researchers should increase efforts at developing clinical interventions that address multiple risk factors. 78
Footnotes
Acknowledgments
We acknowledge the contributions of the Behavioral Risk Factor Surveillance System state coordinators. The findings and conclusions in this report are those of the authors and do not necessarily represent the official position of the Centers for Disease Control and Prevention.
Disclosure Statement
No competing financial interests exist.
Appendix
| 0 Risk factors | 1 Risk factor | 2–3 Risk factors | 4–5 Risk factors | ||||||
|---|---|---|---|---|---|---|---|---|---|
| Characteristic | Unweighted number | % a | 95% CI | % a | 95% CI | % a | 95% CI | % a | 95% CI |
| Age, years | |||||||||
| 18–24 | 6,068 | 49.0 | 46.8-51.2 | 33.2 | 31.2-35.3 | 17.3 | 15.8-19.0 | 0.5 | 0.3-0.8 |
| 25–34 | 19,734 | 47.5 | 46.3-48.8 | 33.1 | 32.0-34.2 | 18.6 | 17.7-19.5 | 0.8 | 0.6-1.0 |
| 35–44 | 28,810 | 47.8 | 46.8-48.8 | 33.6 | 32.7-34.6 | 18.0 | 17.3-18.8 | 0.6 | 0.5-0.8 |
| Race and ethnicity | |||||||||
| White | 39,856 | 47.1 | 46.2-47.9 | 33.2 | 32.3-34.0 | 19.1 | 18.4-19.8 | 0.7 | 0.5-0.8 |
| Black | 5,800 | 42.7 | 40.3-45.0 | 36.1 | 33.9-38.4 | 20.5 | 18.7-22.4 | 0.8 | 0.5-1.1 |
| Hispanic | 5,574 | 50.7 | 48.2-53.2 | 34.9 | 32.5-37.3 | 13.9 | 12.4-15.6 | 0.5 | 0.3-1.0 |
| Asian | 1,399 | 74.8 | 70.7-78.6 | 20.3 | 16.9-24.1 | 4.9 | 3.3-7.2 | 0.0 | 0.0-0.3 |
| American Indian and Alaska Native | 1,127 | 34.6 | 28.1-41.7 | 31.0 | 25.7-36.9 | 31.3 | 25.0-38.3 | 3.1 | 1.5-6.5 |
| Education | |||||||||
| <High school | 3,781 | 36.9 | 33.9-39.9 | 34.5 | 31.6-37.5 | 27.2 | 24.7-29.9 | 1.4 | 0.8-2.5 |
| High school | 12,514 | 42.5 | 40.7-44.2 | 33.7 | 32.1-35.3 | 22.9 | 21.6-24.3 | 1.0 | 0.8-1.2 |
| Some college | 16,088 | 43.8 | 42.3-45.4 | 35.5 | 34.0-37.0 | 20.0 | 18.9-21.2 | 0.7 | 0.5-0.9 |
| At least college graduate | 22,229 | 58.0 | 56.8-59.1 | 31.0 | 29.9-32.1 | 10.9 | 10.1-11.6 | 0.2 | 0.1-0.3 |
| Employment | |||||||||
| Employed | 37,470 | 47.4 | 46.5-48.4 | 34.4 | 33.5-35.3 | 17.7 | 17.0-18.4 | 0.5 | 0.4-0.6 |
| Unemployed | 3,053 | 34.8 | 31.5-38.3 | 33.6 | 30.5-36.8 | 29.7 | 26.7-32.9 | 1.9 | 1.3-2.7 |
| Homemaker | 9,071 | 55.0 | 53.2-56.8 | 30.0 | 28.4-31.7 | 14.4 | 13.2-15.8 | 0.6 | 0.4-0.9 |
| Student | 3,150 | 56.0 | 52.8-59.1 | 31.8 | 28.9-34.8 | 11.8 | 10.1-13.7 | 0.5 | 0.2-1.0 |
| Unable to work | 1,783 | 14.9 | 11.9-18.4 | 35.0 | 30.5-39.8 | 47.1 | 42.6-51.6 | 3.0 | 2.0-4.5 |
| Retired | 85 | 37.6 | 24.7-52.6 | 39.8 | 26.0-55.3 | 22.6 | 12.2-38.1 | 0.0 | 0.0-0.0 |
| Marital status | |||||||||
| Married | 32,328 | 53.3 | 52.3-54.2 | 31.8 | 31.0-32.7 | 14.5 | 13.9-15.2 | 0.4 | 0.3-0.5 |
| Unmarried | 22,284 | 41.5 | 40.2-42.9 | 35.2 | 33.9-36.5 | 22.3 | 21.3-23.4 | 1.0 | 0.8-1.2 |
| Sufficient social and emotional support | |||||||||
| Always | 24,966 | 54.3 | 53.1-55.4 | 31.7 | 30.6-32.8 | 13.7 | 13.0-14.5 | 0.3 | 0.2-0.4 |
| Usually | 19,870 | 47.2 | 45.8-48.5 | 35.1 | 33.8-36.4 | 17.3 | 16.3-18.3 | 0.5 | 0.3-0.7 |
| Sometimes, rarely, or never | 9,776 | 33.0 | 31.2-34.8 | 34.2 | 32.4-36.0 | 31.0 | 29.3-32.7 | 1.9 | 1.5-2.4 |
Weighted percentage.
CI, confidence interval.