




Abstract
Objective:
Previous studies have demonstrated an association between increased serum uric acid (SUA) levels and incident diabetes. Most clinical and epidemiological investigations, however, focused solely on male populations or did not analyze men and women separately. We assessed the association between SUA levels and diabetes incidence in a large cohort of apparently healthy men and women.
Methods:
Data were retrospectively gathered from 9140 adults who participated in annual medical screening visits during 2000–2009. Mean follow-up time was 4.8 years, and the median age was 50 years. Laboratory test results, data from physical examinations, medical history, and lifestyle information were extracted. The main outcome measure was incident diabetes, defined as two consecutive fasting glucose tests higher than 125 mg/dL. Cox proportional-hazards multivariate models were applied for measuring hazard ratios (HRs) for diabetes according to continuous and categorical levels of uric acid.
Results:
We identified 499 new cases of diabetes (total, 5.5%: men, 6.2%; women, 3.6%) during the follow-up period. The gender-specific HRs for diabetes, adjusted for age and a set of prespecified multiple risk and protective factors, were 1.57 for each 1 mg/dL increase in SUA (95% confidence interval [CI], 1.32–1.86) in women and 1.08 (95% CI, 0.99–1.17) in men; p for interaction of SUA by gender <0.001.
Conclusion:
SUA is independently associated with diabetes outcome, considerably more in women than in men.
Introduction
Elevated serum uric acid (SUA) has been found to associate with an increased risk of cardiovascular diseases. 1 The Chicago Heart Association Detection Project and the early National Health and Nutrition Examination Survey (NHANES) I study found a more pronounced association in women than in men. 2,3 Epidemiological data also suggest a positive association between uric acid levels and fasting plasma glucose, 4 impaired fasting glucose, 5 and the metabolic syndrome. 6,7 Physiologically, hyperuricemia was shown to be strongly correlated with insulin resistance, 8,9 although the direction of the causality is yet unknown. Increased SUA has also been found to be an independent risk factor for nonalcoholic fatty liver disease, 10 a condition that is closely linked to insulin resistance.
Several retrospective and at least two prospective studies (the Framingham and Microalbuminuria: A Genoa Investigation on Complications [MAGIC] studies) 11,12 have linked hyperuricemia to higher incidence of type 2 diabetes mellitus (DM), 13 but others have failed to establish such association. 7,14 Additionally, most studies have focused on male populations with substantial cardiovascular risk factors or have not analyzed males and females separately. Although some evidence suggests that the risk for diabetes in the context of elevated uric acid may be more pronounced in women, 12,15 –17 other studies did not find a significant interaction by gender between uric acid and diabetes. 11,14
In this relatively large retrospective cohort analysis, we aimed to investigate the hypothesis that uric acid is associated with the development of diabetes in an ambulatory adult population of apparently healthy men and women.
Methods
Study population
The Cardiovascular Risk and Metabolic Assessment (CARMA) study is a retrospective cohort designed to assess cardiometabolic risk factors in men and women who were annually evaluated at the Executive Screening Survey (ESS) at the Sheba Medical Center in Israel during 2001–2009. The ESS population is composed mainly of senior executives—all Caucasians of Jewish descent—sent by their firms and insurance companies for annual checkups.
For this study, inclusion criteria were age above 34 years, availability of follow-up data for ≥1 visit beyond the baseline visit, and ≥1 year between these visits. A diagnosis of diabetes or cardiovascular disease (CVD) (ischemic heart disease, acute coronary syndrome, acute myocardial infarction, or ischemic stroke) at an individual's first ESS visit was an exclusion criterion. Briefly, 18,034 participants who visited the ESS between January 2001 and December 2009 were assessed for eligibility. Excluded were 4101 with preexisting DM or CVD and 3020 with only a single visit. Baseline characteristics of the 3020 individuals were not statistically different from the characteristics of the included individuals (data not shown). Included for analysis were 9140 individuals, with mean age 50.6±9.2 years, for whom baseline laboratory data of SUA was complete (6580 men: mean age, 50.5±9.1 years; and 2560 women: mean age, 50.7±9.4 years). At each ESS visit, participants completed a detailed questionnaire assessing demographic, nutritional, lifestyle, and medical factors. Venous blood samples were drawn after a 12-hour fast and analyzed immediately. A physician performed a complete physical examination. Medical professionals performed blood pressure measurements with mercury sphygmomanometers. The full methods employed by this program were previously published. 18 –20 The Institutional Ethics Committee of Sheba Medical Center approved the study.
Primary outcome
The primary outcome was a diagnosis of diabetes, determined by two consecutive fasting glucose tests higher than 125 mg/dL performed at the ESS or reported by participants in the survey.
Independent variables
Independent variables of the first baseline visit included SUA, fasting plasma glucose, serum creatinine, history of hypertension and blood pressure measurement, body mass index (BMI), triglycerides, total serum cholesterol, smoking status, regular physical activity, chronic use of diuretics, and family history of diabetes. Regular leisure-time physical activity dichotomous variable was defined as reporting regular engagement in at least one specific type of leisure-time activity, such as walking or jogging. Baseline BMI was calculated by the metric formula [weight/height2].
Laboratory methods
Biochemical analyses of blood were performed on fresh samples in the core laboratory facility of the Sheba Medical Center using the Olympus AU2700TM Chemistry-Immuno Analyzer. In the procedure, uric acid is converted by uricase to allantoin and hydrogen peroxide, and the amount of hydrogen peroxide produced is measured. Normal laboratory ranges of SUA were 2.6–6.0 mg/dL for women and 3.5–7.2 mg/dL for men during the study period.
Statistical analysis
In the univariate analysis of the baseline characteristics, means and standard deviations (SDs) were calculated for continuous variables; frequencies and percentages for categorical variables. For baseline categorical and continuous variables, the chi-square test and Student's t-test were used, respectively, to assess association with diabetes incidence. The statistical significance of trends across uric acid quartiles of baseline categorical and continuous independent variables were analyzed, using the chi-square linear-by-linear association test and the nonparametric Kruskal-Wallis one-way analysis of variance, respectively. Kaplan-Meier survival curves stratified by SUA quartiles were used for men and women, separately.
Multivariate Cox proportional-hazards analysis was used to estimate the hazard ratio (HR) and 95% confidence interval (CI) for diabetes outcome. The set of variables adjusted in the model was a priori selected according to clinical relevance and included age, plasma fasting glucose, serum creatinine levels, BMI, total cholesterol levels, triglyceride levels, and SUA as continuous variables; gender (male or female); reporting regular physical activity (yes or no); history of hypertension (yes or no); diabetes family history (positive or negative); use of diuretics (yes or no); and current smoker (yes or no). We measured the significance of the interaction between SUA and gender in regard to diabetes outcome adjusted within the full multivariate HR model. All p-value calculations were two-tailed and considered statistically significant if ≤0.05. The statistical analyses were performed with IBM SPSS (Statistical Product and Service Solutions) version 19.0 (Chicago, IL).
Results
Baseline characteristics
The study cohort comprised 9140 individuals with mean age 50.6±9.2 years; 2560 were women (28%) with mean age 50.7±9.4 years, and 6580 were men (72%) with mean age 50.5±9.1 years. The median age was 50 years, with a range of 34 to 94 years. The mean follow-up time was 4.8 years and comprised 43,553 person years. A total of 499 new cases of diabetes were recorded during 2001–2009 among 9140 men and women (diabetes incidence, 5.5% of the cohort). Table 1 presents the full comparison separately for women and men between the baseline characteristics of individuals who developed diabetes and those who did not.
All values are reported as percentages or means±standard deviation.
DM, diabetes mellitus.
All values are reported as percentages or means±standard deviation.
DM, diabetes mellitus.
Participants were classified by gender-specific quartiles of baseline uric acid levels (Table 2 ). In women, increased age was significantly associated with higher uric acid quartiles. In women and men, plasma fasting glucose, serum creatinine, systolic and diastolic blood pressure, history of hypertension, total cholesterol and triglyceride levels, BMI, and the percentage of patients on diuretics were all increased significantly with increasing uric acid levels. In men, the highest percentage of persons who reported engagement in regular physical activity was observed in the lowest uric acid quartile (p for trend=0.004).
All values are reported as percentages or means±standard deviation except for triglyceride concentrations, which are reported as medians with interquartile ranges.
All values are reported as percentages or means±standard deviation except for triglyceride concentrations, which are reported as medians with interquartile ranges.
The mean uric acid level of men was higher than that of women (6.2±1.1 mg/dL; range, 1.5–11.8 mg/dL vs. 4.4±1.1 mg/dL; range, 1.6–10.5 mg/dL, respectively) (Table 3). Such a difference was also observed when the cohort population was further stratified by diabetes incidence in addition to gender (Fig. 1).
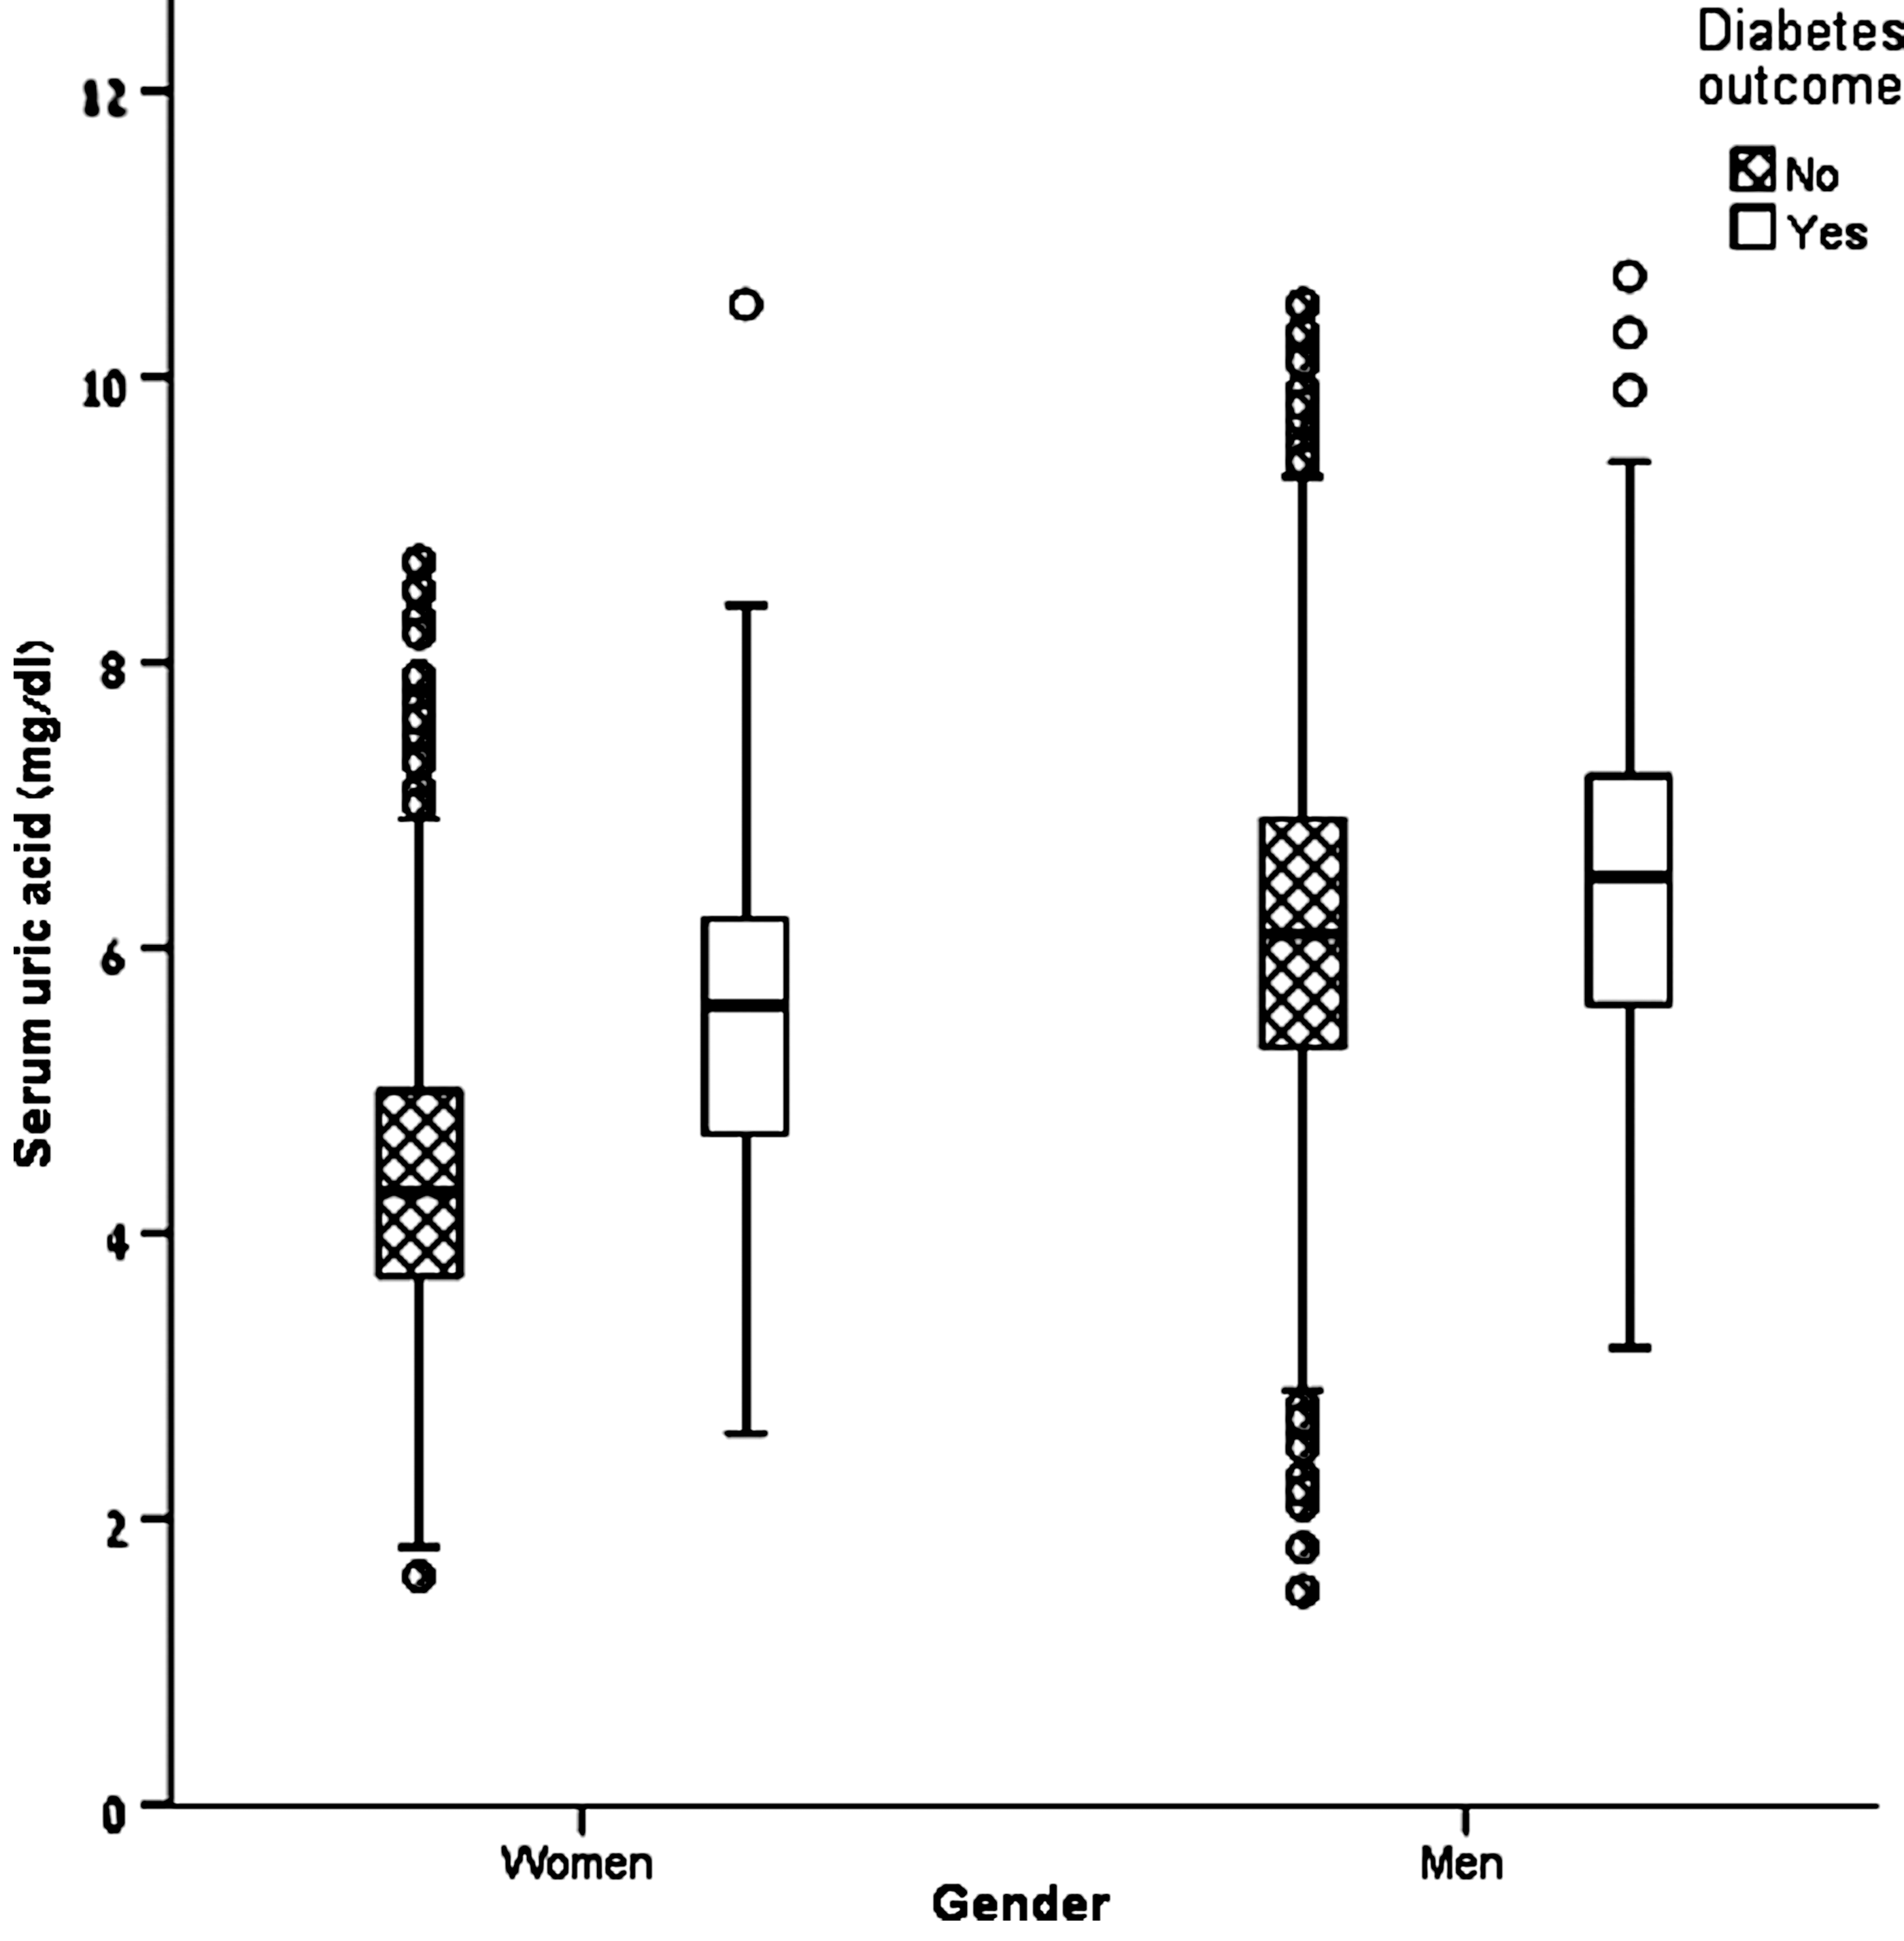
Gender- and diabetes outcome-stratified box plot of continuous serum uric acid levels among 6580 men and 2560 women. The median uric acid level of women with diabetes was higher than that of women without diabetes (5.6 mg/dL; interquartile range [IQR], 4.7–6.2 mg/dL; range, 2.6–10.5 mg/dL vs. 4.3 mg/dL; IQR, 3.7–5.0 mg/dL; range, 1.6–8.7 mg/dL, respectively). The median uric acid level of men with diabetes was higher than that of men without diabetes (6.5 mg/dL; IQR, 5.6–7.2 mg/dL; range, 3.2–10.7 mg/dL vs. 6.1 mg/dL; IQR, 5.3–6.9 mg/dL; range, 1.5–11.8 mg/dL, respectively).
The multivariate Cox proportional-hazards model was adjusted for age, plasma fasting glucose, serum creatinine levels, body mass index, total cholesterol levels and triglyceride levels as continuous variables; reporting regular physical activity (yes or no); history of hypertension (yes or no); diabetes family history (positive or negative); use of diuretics (yes or no); and current smoker (yes or no).
CI, confidence interval; IQR, interquartile range; SD, standard deviation.
Survival curves & multivariate regression model
Figure 2 presents Kaplan-Meier survival curves, stratified by SUA quartiles, for men and women. In women, the multivariate adjustment for age, fasting glucose, creatinine, BMI, triglycerides, total cholesterol, hypertension history, family history of diabetes, smoking status, and regular physical activity demonstrated HR for developing diabetes of 1.57 for each 1 mg/dL increase in uric acid (95% CI, 1.32–1.86
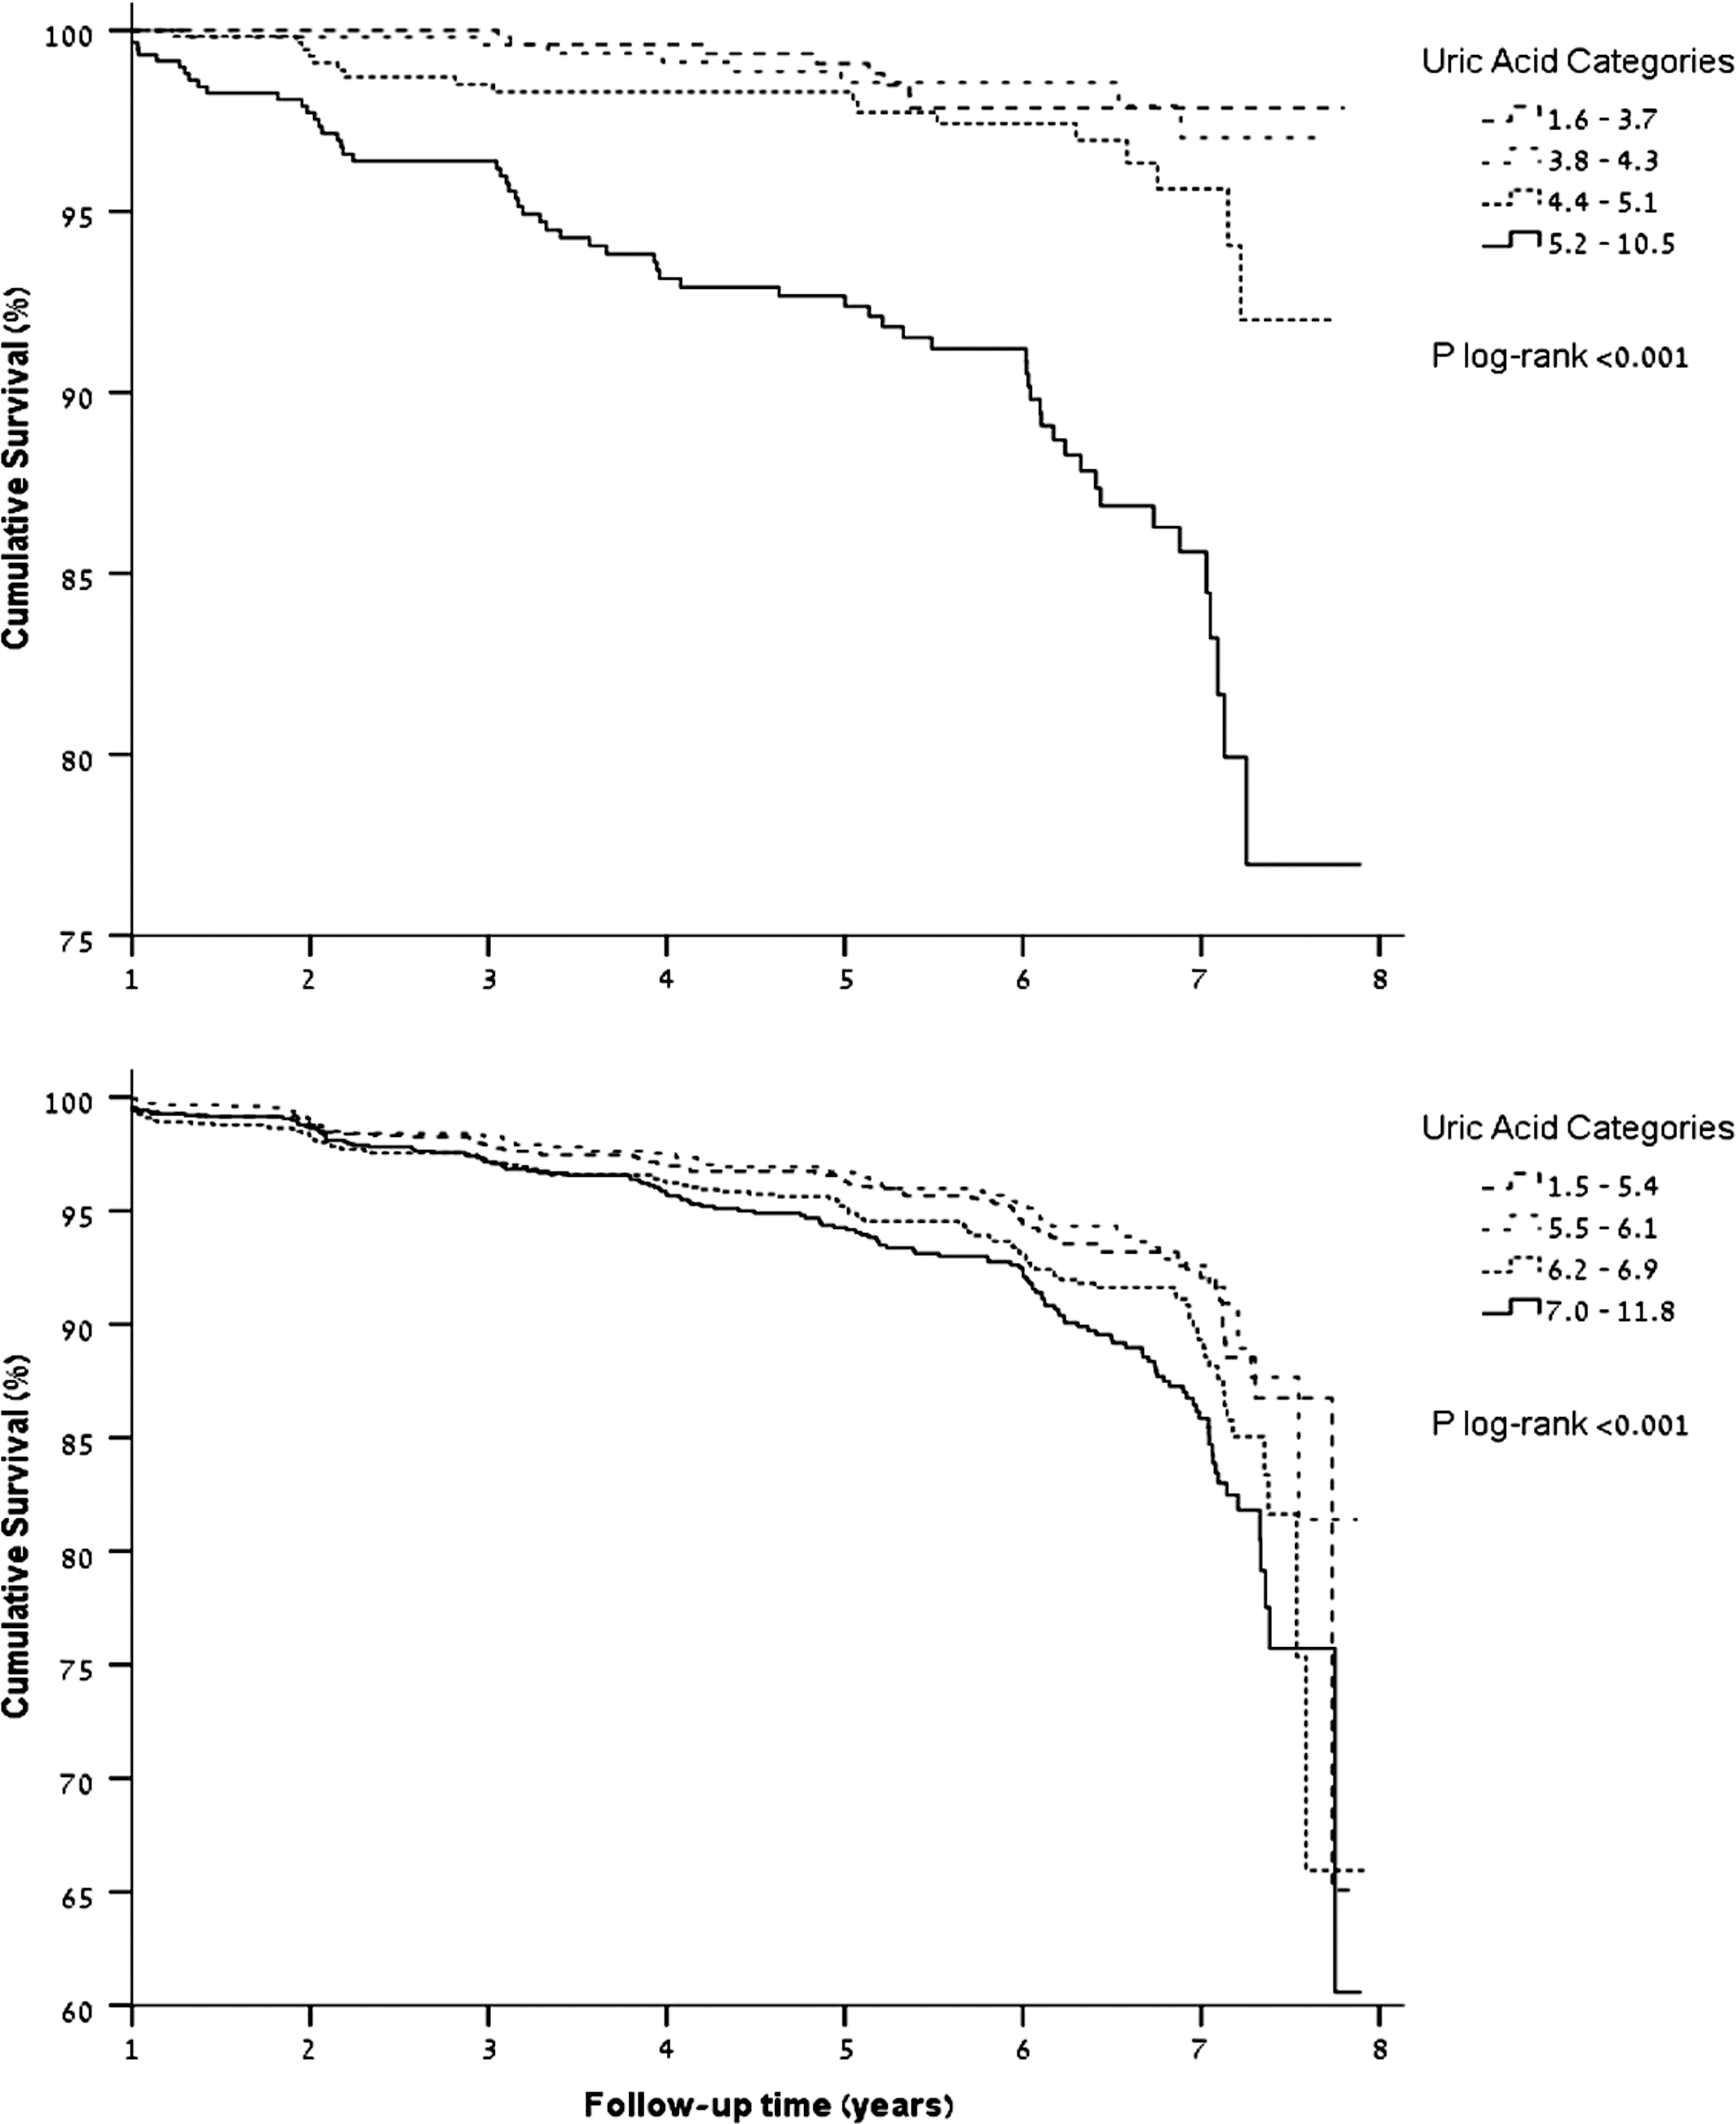
Kaplan-Meier survival curves for 6580 men and 2560 women, stratified by serum uric acid quartiles.
Discussion
In this population-based study of 9140 men and women without diabetes or CVD at baseline, levels of uric acid were associated with diabetes incidence after a follow-up period averaging almost 5 years. The uric acid HR for diabetes incidence was independent of multiple known risk factors for diabetes. There was a statistically significant modification of this association by gender; the HR for diabetes incidence increased by 57% in women and by only 8% in men for every 1 mg/dL increase of baseline uric acid level.
These results suggest that individuals, particularly women, with higher uric acid levels are at increased risk for developing diabetes. Several population-based cohorts have also demonstrated a greater association between uric acid and diabetes incidence in women than in men, 15 –17 albeit sometimes with no statistical significance 15 or without including in the multivariate model several significant confounders that may influence uric acid levels, such as chronic use of diuretics and serum creatinine, 15 –17 both included in our study, or with an analysis of a composite outcome that includes both impaired fasting glucose and diabetes conditions rather than diabetes alone, 17 as in our study.
In our cohort, the mean baseline uric acid level was higher in men than in women, as expected. It was previously suggested that lower levels of uric acid in women are due to estrogen-induced elevation in the fractional excretion of uric acid. 21,22 Thus, variations in uric acid level may be due to gender-dependent differences in the range of uric acid, similar to differences in other laboratory tests (e.g., creatinine, hemoglobin).
Like us, Yamada et al. 17 found elevated serum uric acid to predict diabetes, as well as impaired fasting glucose, in a cohort of 7114 men and 5529 women who underwent regular health examinations. Yamada et al. suggested that BMI may be a major confounder for the risk of developing diabetes in men. The authors speculated that differences in fat distribution between men and women might explain, at least in part, the gender differences observed in their study. In the multivariate model of the current study, BMI was the most significant confounder for diabetes incidence in men, followed by triglycerides; both BMI and triglycerides were correlated with uric acid, with statistical significance. Other variables of the full multivariate model were indeed less significant contributors to confounding in men (data were not shown).
The Monitoring of Trends and Determinants in Cardiovascular Disease (MONICA) Augsburg Cohort Study examined sex-related differences in risk factors for diabetes among 3052 men and 3114 women (aged 35 to 74 years). 16 Systolic blood pressure, regular smoking, and high daily alcohol intake predicted the development of diabetes in men only; uric acid (HR per 1 mmol/L increase, 2.05; 95% CI, 1.49–2.81) and physical inactivity during leisure time were associated with the development of diabetes in women only. In a prospective analysis of the Framingham Heart Study, original (n=4883) and offspring (n=4292) cohorts, the multivariable adjusted risk for developing diabetes was 1.2 and 1.15, respectively, per 1 mg/dL increase in uric acid level. 23 However, no significant interaction by gender was found, possibly due to the lack of sufficient power for each of the cohorts. In contrast, another prospective study, the MAGIC study, which followed 758 Caucasian men and women with untreated hypertension for 11 years, 12 found uric acid to be a significant predictor of incident diabetes, particularly in women.
In their meta-analysis of 11 cohort studies conducted between 1966 and 2009, 24 including 42,634 participants, Kodama et al. demonstrated a relative risk (RR) for diabetes incidence of 1.17 for 1 mg/dL increment of uric acid. Although most participants were men, a stratified meta–regression analysis for gender demonstrated a tendency toward a stronger association between uric acid and diabetes incidence in women (RR, 1.28 in women vs. RR, 1.09 in men); however, no statistically significant difference between RRs was demonstrated for either pooled women-only or men-only cohorts compared to the mixed-gender cohorts in the meta-analysis.
Epidemiological and clinical studies have documented elevated uric acid levels in the presence of multiple metabolic risk factors, such as increased BMI, hypertension, hypertriglyceridemia, hyperglycemia, and alcohol consumption. The strong association between hyperuricemia and insulin resistance 8 –10 may be the basis for the association between elevated uric acid levels and diabetes incidence. Explanations have been proposed by which uric acid may act as a mediator or as a marker of insulin resistance. As a mediator, uric acid may induce endothelial dysfunction and nitric oxide inhibition, both of which can lead to insulin resistance. 25,26 In addition, it was proposed that fructose in fed mice mediates the metabolic syndrome, in part by raising uric acid. Lowering uric acid levels in the fructose-fed mice was found to ameliorate some features of the metabolic syndrome, including hypertension, hypertrigliceridemia, hyperinsulinemia, insulin resistance, and renal vasoconstriction. 27 –30 Alternatively, elevated uric acid levels may reflect a prediabetes status, especially in the context of compromised renal function; insulin-resistance-related hyperinsulinemia may induce hyperuricemia both by reducing renal uric acid secretion 8,31 and by promoting the accumulation of substrates of uric acid production. 32 Nevertheless, in the current study, hyperuricemia was independent of multiple metabolic risk factors and several confounders, particularly in women, and to a lesser extent in men.
The large sample size and investigation of many clinical characteristics that have been associated with diabetes are strengths of this study. Although the CARMA cohort comprised a relatively low percentage (28%) of women, stratification by gender increased the significance of the association between uric acid levels and the development of diabetes. Based on the proportions of men and women, the cohort may not fully represent the general population. The retrospective design did not enable determination of temporal or causal relationship. Also, insulin levels and insulin resistance were not investigated. Because most of the participants of the CARMA cohort are senior executives, their mean socioeconomic status is presumably above that of the Israeli population as a whole. We had no information as to whether the dietary habits of our cohort differ from those of the general population and, if so, whether such difference influenced uric acid production. Data regarding alcohol consumption were not available and therefore not assessed in the CARMA cohort. Although alcohol consumption is considered an independent risk factor for type 2 diabetes, there is conflicting evidence about this issue. Three recent meta-analyses have suggested that whereas low to moderate alcohol intake might be protective of diabetes, high intakes were associated with increased risk for diabetes. 33 –35 Interestingly, in the MONICA study, 16 alcohol consumption was a risk factor for type 2 diabetes only in men. Alcohol consumption may also increase the risk for hyperuricemia and gout. Whether alcohol is an independent risk factor for diabetes is still unclear.
Conclusions
We found hyperuricemia to be significantly associated with diabetes incidence. The observation that gender was a strong significant modifier of this effect emphasizes the importance of assessing men and women separately in investigations of diabetes risk factors.
Footnotes
Acknowledgments
This work was supported by the Shalvi Foundation for Medical Research and Mr. Natan Hetz. The sponsors had no role in designing or conducting the study, gathering or analyzing the data, or writing the manuscript.
Author Disclosure Statement
No competing financial interests exist.