




Abstract
Background:
In 2010, almost 11,000 females were killed in motor vehicle crashes, and racial/ethnic minorities were affected disproportionally.
Methods:
To assess disparities in motor vehicle–related death rates by race/ethnicity among females in the United States, the Centers for Disease Control and Prevention analyzed 2005–2009 data from the National Vital Statistics System. Death rates and corresponding 95% confidence intervals were calculated, and differences between 2005 and 2009 death rates were examined.
Results:
The motor vehicle–related death rate for females was 6.8 deaths per 100,000 population in 2009. American Indian/Alaska Native females had the highest motor vehicle–related death rates, followed by whites, blacks, Hispanics, and Asian/Pacific Islanders. The greatest decrease in death rates between 2005 and 2009 occurred among whites from a rate of 9.4 per 100,000 population (95% CI: 9.2–9.6) to 7.1 per 100,000 population (95% CI: 6.9–7.2; absolute rate change: −2.3; p<0.001).
Conclusion:
Despite the recent declines in motor vehicle–related death rates noted in this article, the need remains for increased use of evidence-based strategies to reduce the burden of motor vehicle–related deaths among females overall and especially among American Indian/Alaska Natives.
Introduction
Traffic crashes are the leading cause of injury death among females 1–24 years of age, and a leading cause of death among children, teens, and young adults in the United States. 1 While progress has been made in reducing motor vehicle–related deaths in recent years, there were still more than 35,000 deaths caused by crashes in 2010 alone. 1 Nearly 11,000 of those killed (30%) were females.
Additional progress in reducing motor vehicle–related death rates can be made by identifying high-risk groups, understanding factors that may be placing them at higher risk, and then targeting and tailoring effective prevention strategies to reduce their risk. Previous research has largely focused on males because they have on average two to three times higher death rates than females. 2,3 The purpose of this study was to examine recent motor vehicle–related death rates specifically among females and to focus on differences by race/ethnicity. Changes in motor vehicle–related death rates among females between 2005 and 2009 were also examined to determine if certain racial/ethnic groups saw greater progress during this time period.
Materials and Methods
To assess disparities in motor vehicle–related death rates by race/ethnicity among females of all ages in the United States, the Centers for Disease Control and Prevention (CDC) analyzed data from the National Vital Statistics System (NVSS). A more thorough discussion of the methods can be found in the 2011 CDC Health Disparities and Inequalities Report 2 ; briefly, race/ethnicity was divided into five mutually exclusive categories: non-Hispanic whites, non-Hispanic blacks, non-Hispanic American Indians/Alaska Natives (AI/ANs), non-Hispanic Asian/Pacific Islanders (A/PIs), and Hispanics of all races. 2 Death rates and corresponding 95% confidence intervals were calculated and age-adjusted to the 2000 standard U.S. population. Absolute and relative differences in rates for females were calculated by race/ethnicity. Differences between age-adjusted death rates in 2005 and 2009 were compared using the z statistic based on a normal approximation, and p values ≤0.05 were considered statistically significant.
Results
In 2009, the overall motor vehicle–related age-adjusted death rate for females was 6.8 deaths per 100,000 population (Table 1). AI/ANs had the highest motor vehicle–related death rates in 2009 (17.3; 95% CI: 15.0–19.5), followed by whites, blacks, Hispanics, and A/PIs.
Age-adjusted death rates per 100,000 population.
CI, confidence interval.
Between 2005 and 2009, age-adjusted death rates showed statistically significant declines among females for all races/ethnicities with the exception of AI/AN (Table 1; Fig. 1). The absolute rate changed by −1.6 for AI/AN from 18.9 (95% CI: 16.4–21.4) in 2005 to 17.3 (95% CI: 15.0–19.5) in 2009; however, this change was not statistically significant (p=0.347). The greatest decrease occurred among whites from a death rate of 9.4 per 100,000 population (95% CI: 9.2–9.6) in 2005 to 7.1 per 100,000 population (95% CI: 6.9–7.2) in 2009 (absolute rate change: −2.3; p<0.001).
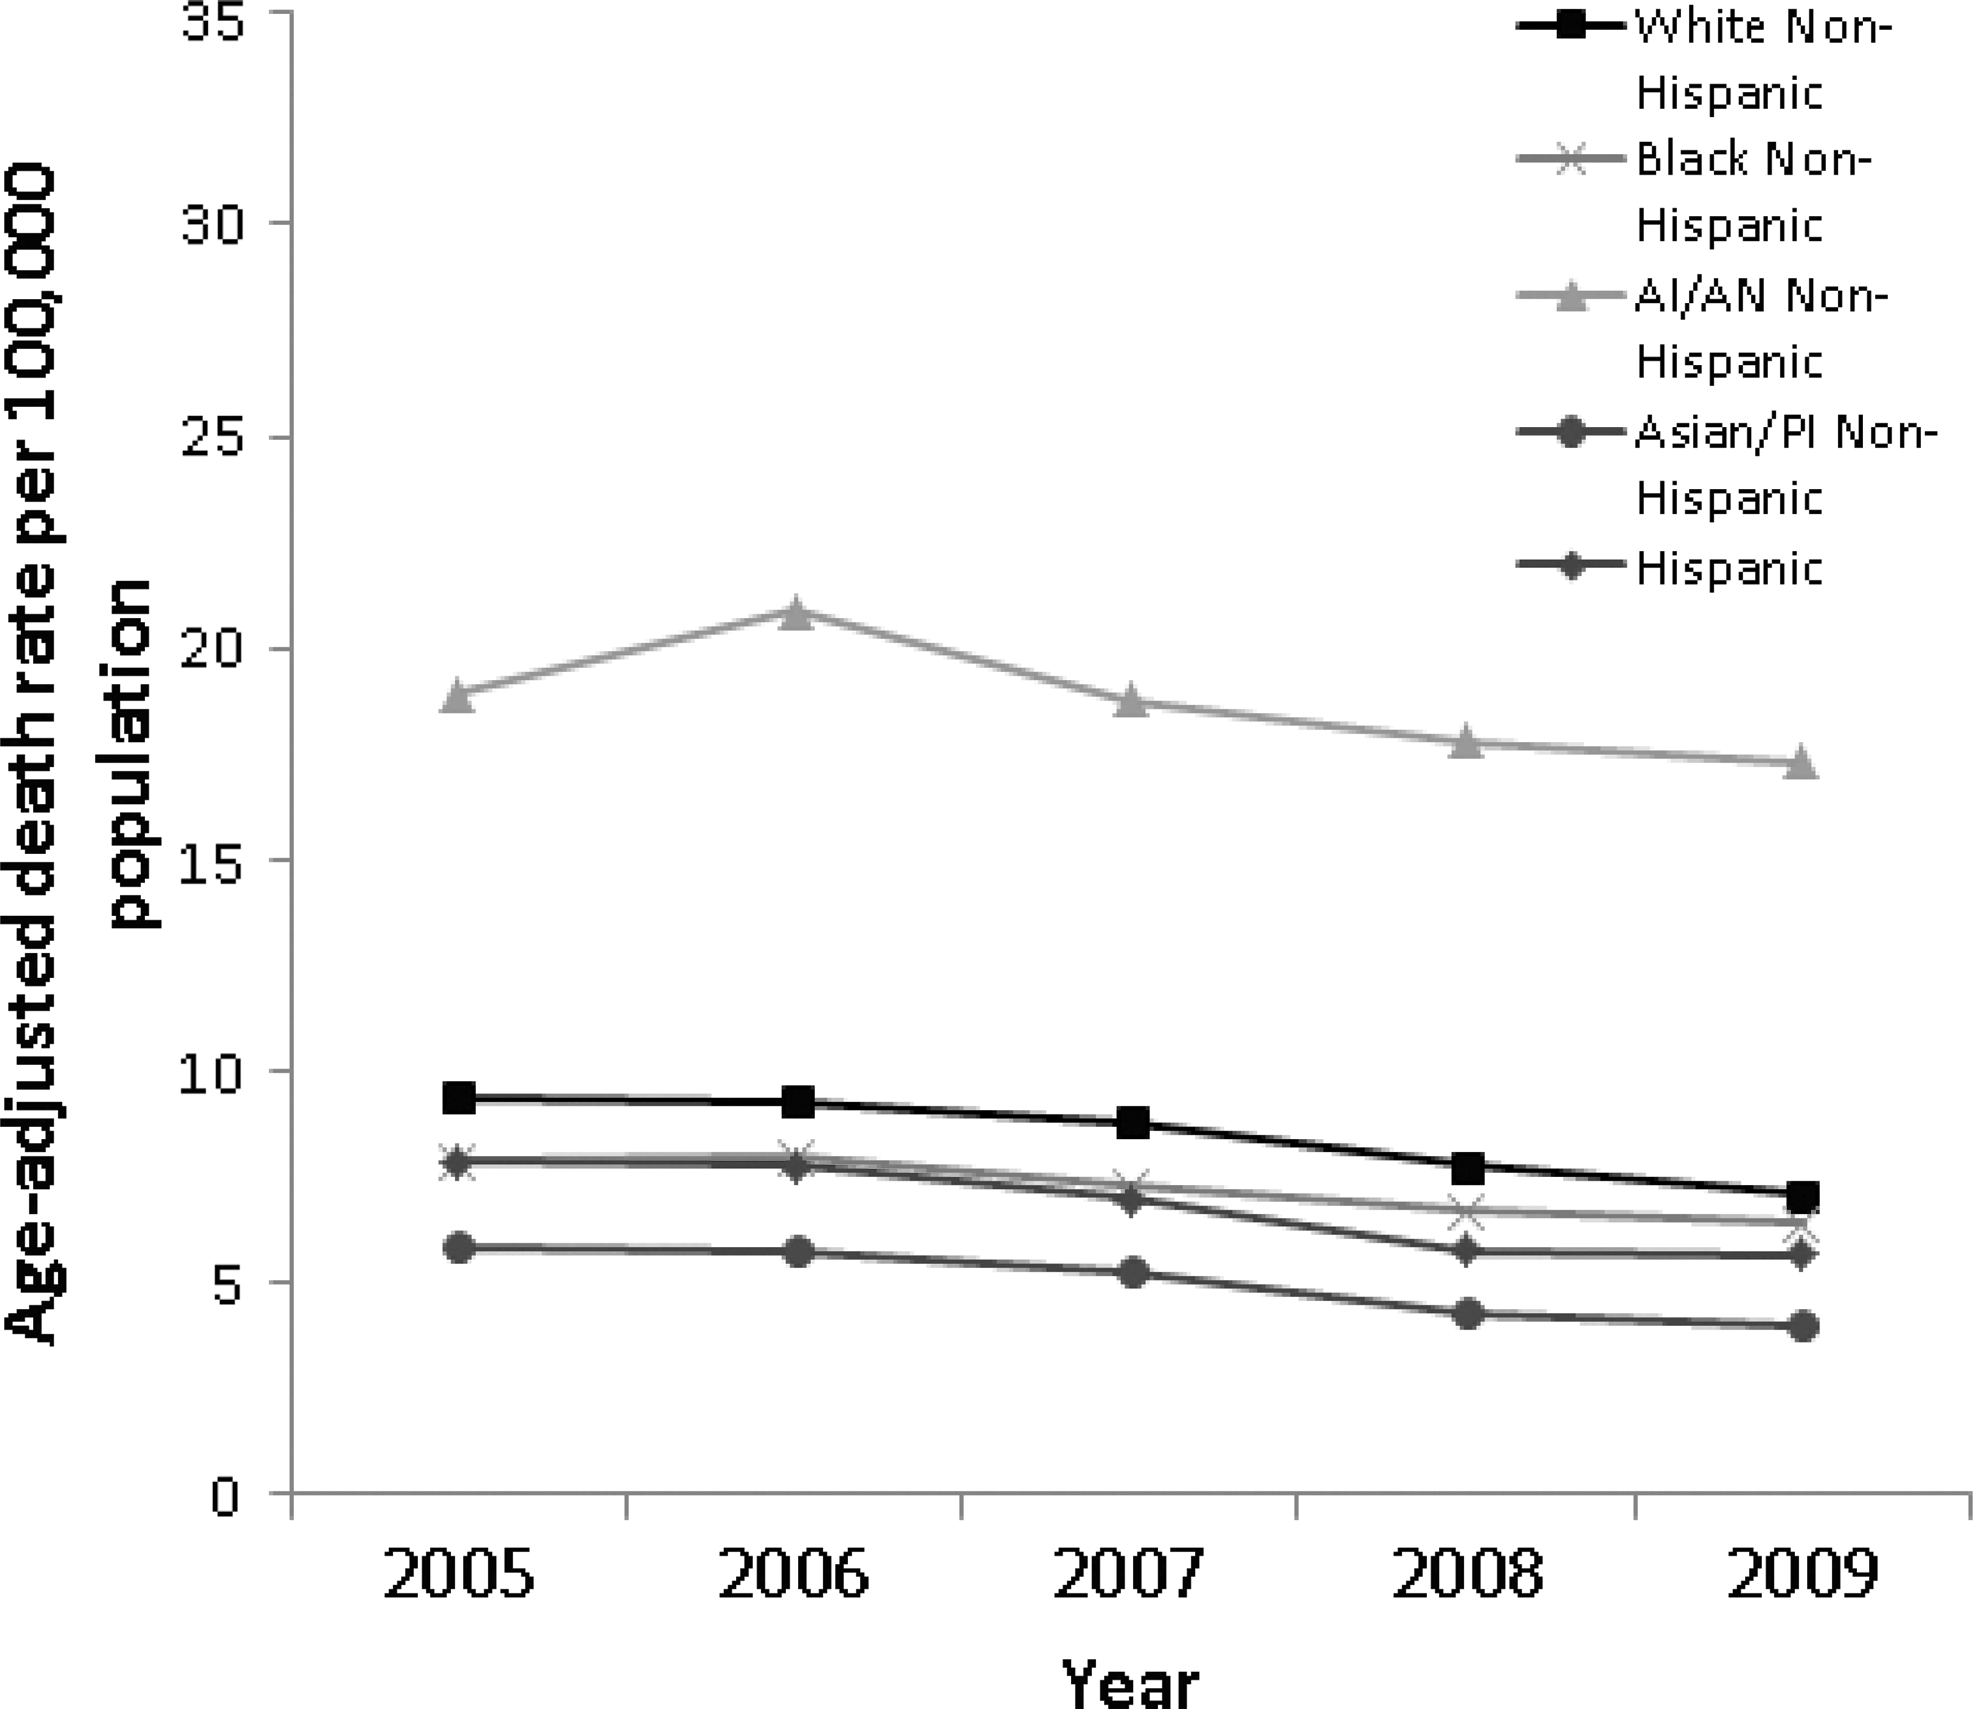
Motor vehicle-related deaths among females by race/ethnicity–National Vital Statistics System, United States, 2005 to 2009.
Discussion
Our findings revealed that females have seen significant declines in motor vehicle–related death rates from 9.0 deaths per 100,000 population in 2005 to 6.8 deaths per 100,000 population in 2009. In examining these rates more closely by race/ethnicity, we found that females of all races/ethnicities had significant declines in motor vehicle–related death rates between 2005 and 2009 with the exception of AI/ANs, who had the highest death rates. The finding that AI/ANs have higher rates of motor vehicle–related death among females is consistent with previous research exploring differences in the prevalence of motor vehicle–related risk and protective factors among racial/ethnic groups in the overall U.S. population. 2,4,5 Findings from these studies reveal interesting differences in factors such as seat belt use, child safety seat use, and alcohol-impaired driving.
The National Highway Traffic Safety Administration (NHTSA) found that among persons killed in crashes in 2006, AI/ANs had the highest percentage of seat belt nonuse (75% of passenger vehicle occupants), followed by blacks (62%), whereas A/PIs had the lowest percentage of nonuse (31%). 4 Seat belt nonuse is an important factor because seat belt use is among the most effective interventions available to reduce the likelihood of injury and death in the event of a crash. 6 Therefore, it is understandable that the estimates of seat belt nonuse align with our results: racial/ethnic groups with the highest and lowest percentages of restraint nonuse also had the highest and lowest motor vehicle–related death rates, respectively. Overall, seat belt use has increased during the past two decades in the United States from 58% in 1994 to 86% in 20126; however, millions of vehicle occupants still do not use belts. 6,7 The highest reported seat belt use rates are observed in states and on tribal reservations with primary seat belt laws (legislation allowing police to stop a vehicle solely for a safety belt violation), followed by those with secondary seat belt laws (legislation allowing police to administer a citation for a seat belt violation only after the vehicle has been stopped for another reason). 8 –10 In 2008, 91.8% of females in primary enforcement law states reported always using seat belts, whereas only 84.6% of females in secondary enforcement law states reported always using seat belts. 11 As of January 2013, 18 states did not have primary seat belt legislation in place. 12
Similarly for children, there are important differences in both death rates and child safety seat use by sex and race/ethnicity. 5 From 2006 to 2010, the overall motor vehicle–related death rate among female children (ages 0–8 years) was 2.4 deaths per 100,000 population, while that of AI/AN females was almost double at 4.6 deaths per 100,000 population. 1 Moreover, 2010 data from the NHTSA show that white and Asian children have higher restraint use rates than black and Hispanic children. 5 Safety seats reduce the risk for death among infants aged <1 year by 71% and by 54% among toddlers aged 1–4 years. 5 For children aged 4–7 years, booster seats can reduce the risk of injury by 59%, compared with seat belts alone. 13 Focused child restraint distribution and education programs can help increase restraint use among all children. 14,15
In addition to differences in restraint use, racial/ethnic groups with the highest motor vehicle–related death rates also have higher proportions of alcohol-involved motor vehicle–related crash deaths. In 2006, among all persons killed in crashes, AI/ANs had the highest proportion killed in alcohol-impaired crashes (48%), followed by Hispanics (36%), blacks and whites (both 31%), and A/PIs (23%). 4 Specifically among females, 43% of AI/ANs killed in crashes had blood alcohol concentrations (BACs) of 0.08 or higher, compared to 22% of the entire female population. 4 There are several known, effective strategies to reduce alcohol-impaired driving, including ignition interlock devices (devices that disable a vehicle's ignition after detection of alcohol in the driver's breath), sobriety checkpoints, minimum drinking age (21 years) laws, and 0.08 g/dL BAC laws, among others. 16,17
While our study found declines among females for most racial/ethnic groups, indicating great progress, motor vehicle–related injury deaths still carry a significant burden among females, especially AI/AN females. Further work is needed to reduce motor vehicle–related death rates among AI/AN populations.
Recognizing this disparity, CDC has been collaborating with tribes since 2004 to help reduce the burden of motor vehicle–related injuries and deaths among AI/ANs. Specifically, CDC's Injury Center funded four AI tribes, the Tohono O'odham Nation (TON), the Ho-Chunk Nation (HCN), the White Mountain Apache Tribe (WMAT), and the San Carlos Apache Tribe (SCAT), from 2004 to 2009 to tailor, implement, and evaluate evidence-based road safety interventions. CDC's AI/AN motor vehicle injury prevention programs do not focus solely on females because AI/AN males also have high motor vehicle–related death rates. CDC encourages Tribes to take an inclusive (i.e., all ages and both sexes) and multifaceted approach (i.e., incorporate education/awareness-raising activities, media campaigns, and enforcement components) to their programs. These programs have documented several important successes, including increases in seat belt use and child safety use and reductions in crashes. 15,18 Building upon this work, CDC is currently funding eight new tribes from 2010 to 2014 and will use the best practices and lessons learned from all 12 tribal programs to advise and guide future Tribal motor vehicle injury prevention programs.
This report is subject to at least one limitation; since NVSS data are extracted from death certificates and not self-reported, some racial misclassification is likely. 19
Conclusions
Despite the recent declines in motor vehicle–related death rates among females noted in this article, the need remains for increased use of evidence-based strategies to further reduce motor vehicle–related disparities in injuries and deaths among females, especially among AI/ANs. More translational research is warranted on the scalability of interventions that have successfully been tailored to males and nonminority groups so that communities of different racial/ethnic and cultural backgrounds including females and AI/ANs, can benefit from implementing these best practices.
Footnotes
Acknowledgment
The findings and conclusions in this report are those of the authors and do not necessarily represent the official position of the Centers for Disease Control and Prevention.
Author Disclosure Statement
No conflicts of interest or competing financial interests exist.