
Abstract
Background:
Approximately 10%–20% of women suffer from postpartum depression (PPD), important predictors of which are antenatal stressful life event (SLE) experiences. The association between women's state-level socioeconomic status (SES) and PPD has not been explored. This study aimed to examine whether the association between antenatal SLE and PPD symptoms was moderated by women's state-level SES.
Methods:
Data from the 2009–2011 Pregnancy Risk Assessment Monitoring System (PRAMS) were used. State-level women's employment/earnings and social/economic autonomy indices were computed from indicators published by the Institute of Women's Policy Research (IWPR). Multilevel multivariable logistic regression analyses were performed.
Results:
Among 91,253 women with valid responses, 11.3% had PPD symptoms, prevalence ranging from 7.1% in Illinois to 17.1% in Arkansas. Women who experienced all four stressor categories, including partner related, traumatic, emotional, and financial, had the highest odds (adjusted odds ratio [aOR]: 5.43; 95% confidence interval [CI]: 5.36–5.51) of PPD symptoms. The odds of experiencing PPD symptoms decreased with an increase in the state-level social/economic autonomy index (aOR: 0.75; 95% CI: 0.64–0.88). There was significant cross-level interaction between number of stressor categories experienced and state-level index.
Conclusions:
Screening for antenatal SLEs can help identify women at risk for PPD symptoms. That the odds of having PPD symptoms decreased with increasing state-level social/economic autonomy and women residing in states with lower indices were more vulnerable to the impacts of antenatal stressors, could have policy implications related to improving the SES of women in these states.
Introduction
P
Experiencing stressful life events (SLEs) during pregnancy is an important risk factor of PPD. 1,2,6,7 Among women in New York City, those who experienced six or more stressful events during the year before delivery had thrice the odds of having a PPD diagnosis, compared with those who did not experience any stressful event. 9 In Massachusetts, women reporting antenatal stressor(s) had a significantly higher prevalence of PPD symptoms. 10
In addition to the individual risk factors, contextual factors might play a role in PPD symptoms. A multiple determinants framework for perinatal health includes proximal risk factors, which are biomedical and behavioral responses to distal risk factors, such as the woman's physical, economic, social, and political environment. 11 As the state has increasingly become the unit to legislate, fund, and implement policies and programs in the United States, states with policies favoring gender equality in socioeconomic, political, and reproductive rights can encourage an environment that is friendlier toward women and family. 12,13 The high status of women in the society can favorably influence their mental health by providing higher wages, better standard of living, health insurance, and state funding for reproductive and child care. 13
The importance of state-level women's status has been examined in the context of violence against married women, 14 global and cause-specific mortality among women and men, 15 and low birthweight, teen pregnancy, and infant and teen mortality. 16 Women's state-level SES has been significantly linked to depressive symptoms in general, 13 with lower depression scores among women residing in higher ranked states.
Although studies have elucidated the relationship between maternal antenatal SLEs and PPD symptoms, women's state-level SES and its interaction with antenatal SLEs have not been considered in this context. The purpose of this study was to examine the relationship between antenatal SLEs and PPD symptoms, among women in the United States who have had a recent live birth, and explore whether state-level SES moderated the aforementioned relationship.
Materials and Methods
Dataset and study subjects
This study used data for 2009–2011, collected by the Pregnancy Risk Assessment Monitoring System (PRAMS), a surveillance project of the Centers for Disease Control and Prevention (CDC) and state health departments. A stratified systematic sample of 100–250 new mothers is drawn every month from a sampling frame of eligible birth certificates. 17 A detailed description of the methodology, including the sampling techniques used, can be found in the PRAMS website. 17 Sampling, nonresponse, and noncoverage weights are multiplied together to yield the analysis weight, which can be interpreted as the number of women like herself in the population that each respondent represents. 17 The standardized data collection methodology enables between-state comparisons and single-state or multistate analyses. 17
The PRAMS survey is conducted by mailed questionnaires with telephone follow-ups for nonrespondents and the responses are linked to extracted birth certificate variables. Mailings start 2–4 months after delivery. Topics include barriers to and content of prenatal care, obstetric history, physical abuse, contraception, economic status, maternal stress, and early infant development and health status. 18 The respondents in our analyses belonged to 30 states, including Alaska, Arkansas, Colorado, Delaware, Georgia, Hawaii, Illinois, Massachusetts, Maryland, Maine, Michigan, Minnesota, Missouri, Mississippi, Nebraska, New Jersey, New Mexico, New York, Ohio, Oklahoma, Oregon, Pennsylvania, Rhode Island, Tennessee, Texas, Utah, Washington, Wisconsin, West Virginia, and Wyoming.
Variables
PPD symptoms, the outcome of interest, were assessed by a woman's responses to whether she felt down, depressed, or sad; hopeless; or slowed down since her most recent childbirth. Depending on her responses ranging from “never” to “always” to each question, the total score ranged from 3 to 15. As recommended by the CDC, any woman scoring 10 or higher was categorized as having PPD symptoms. When data were available for only two or one question(s), the cutoffs were seven and four, respectively. 19
The exposure variable was antenatal SLE, assessed by whether each of the following events happened to a woman during the 12 months preceding the birth of her new baby: (1) a close family member was very sick and had to go to the hospital; (2) she got separated/divorced from her husband/partner; (3) she moved to a new address; (4) she was homeless; (5) her husband/partner lost his job; (6) she lost her job although she wanted to continue working; (7) she argued with her husband/partner more than usual; (8) her husband/partner did not want the pregnancy; (9) she had a lot of bills that she could not pay; (10) she was involved in a physical fight; (11) she or her husband/partner went to jail; (12) someone very close to her had a problem with drinking/drugs; (13) someone very close to her died. 18
Based on previous research, 2,20 women were classified as whether or not they experienced each of the following categories (“yes” to at least one item of that category) of stressors: traumatic (question numbers 4, 10, 11, or 12); emotional (questions 1 or 13); financial (questions 3, 5, 6, or 9); and partner related (questions 2, 7, or 8).
Women were grouped into those who experienced the following: (1) no stressor (reference group); (2) only partner-related stressor; (3) only traumatic stressor; (4) only financial stressor; (5) only emotional stressor; (6) traumatic and emotional stressors; (7) traumatic and financial stressors; (8) traumatic and partner-related stressors; (9) partner-related and emotional stressors; (10) partner-related and financial stressors; (11) financial and emotional stressors; (12) partner-related, traumatic, and financial stressors; (13) partner-related, traumatic, and emotional stressors; (14) traumatic, financial, and emotional stressors; (15) partner-related, financial, and emotional stressors; and (16) all four stressor categories.
Individual-level covariates were selected based on prior research on the correlates of
State-level indicators of women's SES, published by the Institute of Women's Policy Research (IWPR), were used to calculate composite employment and earnings, and social and economic autonomy indices, 21,22 the state-level variables used in our study. These indices, which have been used in previous research, 13,23 were computed following IWPR guidelines. 22 Employment and earnings index comprised median annual earnings of women working full term, year round; women-to-men ratio of median annual earnings; proportion (%) of adult female population in the labor force; and proportion (%) of employed women in managerial or professional occupations. The four indicators for each state were standardized by dividing with the comparable value for the entire United States, and were added to create a composite score giving equal weight to each component. 22
Social and economic autonomy index comprised the proportions (%) of 18–64 year old women with health insurance; women aged 25 and above with four or more years of college education; businesses owned by women; and women living above the poverty threshold. The standardized values obtained by dividing each component by the comparable national value were added to create a composite score, giving a weight of 4.0 to poverty and a weight of 1.0 to the rest. 22 For each index, a higher composite score implied better state-level women's SES. The averages of the indices for the years 2009–2011 were used in our analyses.
Analysis
Chi-square tests of independence were performed to examine the prevalence of PPD symptoms according to different levels of the individual-level variables. The prevalence was compared among the states. SAS procedures that account for survey design (Proc Survey) were employed to adjust for the analysis weights.
Multivariable analyses were performed using generalized linear mixed models (GLMMs) with the logit link function (multilevel logistic regression) to take into account clustering at the state level. Guidelines for multilevel analyses and approaches previously used were followed. 13,24 –26 The state-level indices were centered using grand mean centering, by subtracting the grand mean from their respective scores. All categorical variables were dummy coded. In the beginning, a null model without any predictor at any level and with the intercept for PPD symptom allowed to vary (random intercept model) was run to serve as a baseline for future comparisons.
The intraclass correlation (ICC) was calculated to quantify the similarity of observations within the same cluster. The individual and state-level variables were then introduced in a sequential manner. Each model was compared with the previous or less complicated model using the likelihood ratio test statistic, computed as the difference between the (−2) times log likelihood values with a chi-squared distribution equal to the difference in the number of parameters. The individual-level covariates that were statistically significant in bivariate analyses were included in a random intercept model (Model 1), and it was significantly better than the null model. Because of a high level of correlation (0.90) between the two state-level indices, we chose to use only the social/economic autonomy index, which was more strongly associated with state-level PPD symptom prevalence.
Model 2—a random intercept model with state-level social and economic autonomy index, as well as the individual-level variables—was significantly better than model 1. Adjusted odds ratios (aORs) and 95% confidence intervals (CIs) are reported from model 2. A multilevel logistic regression model (model 3) was run, with PPD symptoms as the outcome; the independent variables being number of stressor categories experienced (none; 1, 2, 3, and all 4), all other individual-level variables used in model 2, state-level social/economic autonomy index, and an interaction term between the number of stressor categories and the state-level index.
SAS 9.4 (SAS Institute, Inc., Cary, NC) was used for all analyses. SAS GLIMMIX Procedures with adaptive Gauss–Hermite quadrature method were used and analysis weights were adjusted for.
Results
Of 116,595 respondents to the PRAMS 2009–2011 dataset, 91,253 (78.3%) had valid responses to all our variables of interest and were utilized for the bi- and multivariate analyses. Sixty-two percent of the respondents were non-Hispanic whites (NHWs), 12.3% non-Hispanic blacks (NHBs), 18.3% Hispanics, 0.8% American Indians/Alaska Natives (AI/ANs), 4.8% Asians/Pacific Islanders (APIs), and the rest belonged to other/mixed races (Table 1). Eleven percent (11.3%) of women met the criteria for PPD symptoms; the prevalence ranging from 7.1% in Illinois to 17.1% in Arkansas (prevalence by state not shown in table). No antenatal stressor was experienced by 29% of the respondents (Table 1); 33% experienced only 1 category, 22% experienced 2 categories, 11.6% experienced 3 categories, and 4.3% experienced all 4 categories of stressors.
Individuals with valid responses to all the variables.
Among the total number of respondents, weighted percentage of the number of respondents in that category.
Among the total number of respondents in each category, proportion (weighted% and 95% CI) having PPD.
Among the total number of respondents in each category, proportion (weighted% and 95% CI) having PPD.
Chi-square p < 0.0001 for relationship of the selected correlate with prevalence of PPD.
Chi-square p < 0.05 for relationship of the selected correlate with prevalence of PPD.
CI, confidence interval; PNC, prenatal care; PPD, postpartum depressive; PRAMS, Pregnancy Risk Assessment Monitoring System; WIC, women, infants, and children.
In bivariate analyses (Table 1), a lower proportion (8.1%–11.0%) of women in the age group 25 years and above had PPD symptoms compared with younger women (14.1%–14.8%). The prevalence among NHBs (13.1%) and AI/ANs (14.8%) was higher than among NHWs (11.2%) and Hispanics (11.1%), while APIs had a lower prevalence (8.1%). Women with lower income and education had a higher prevalence than those with highest income and education, respectively.
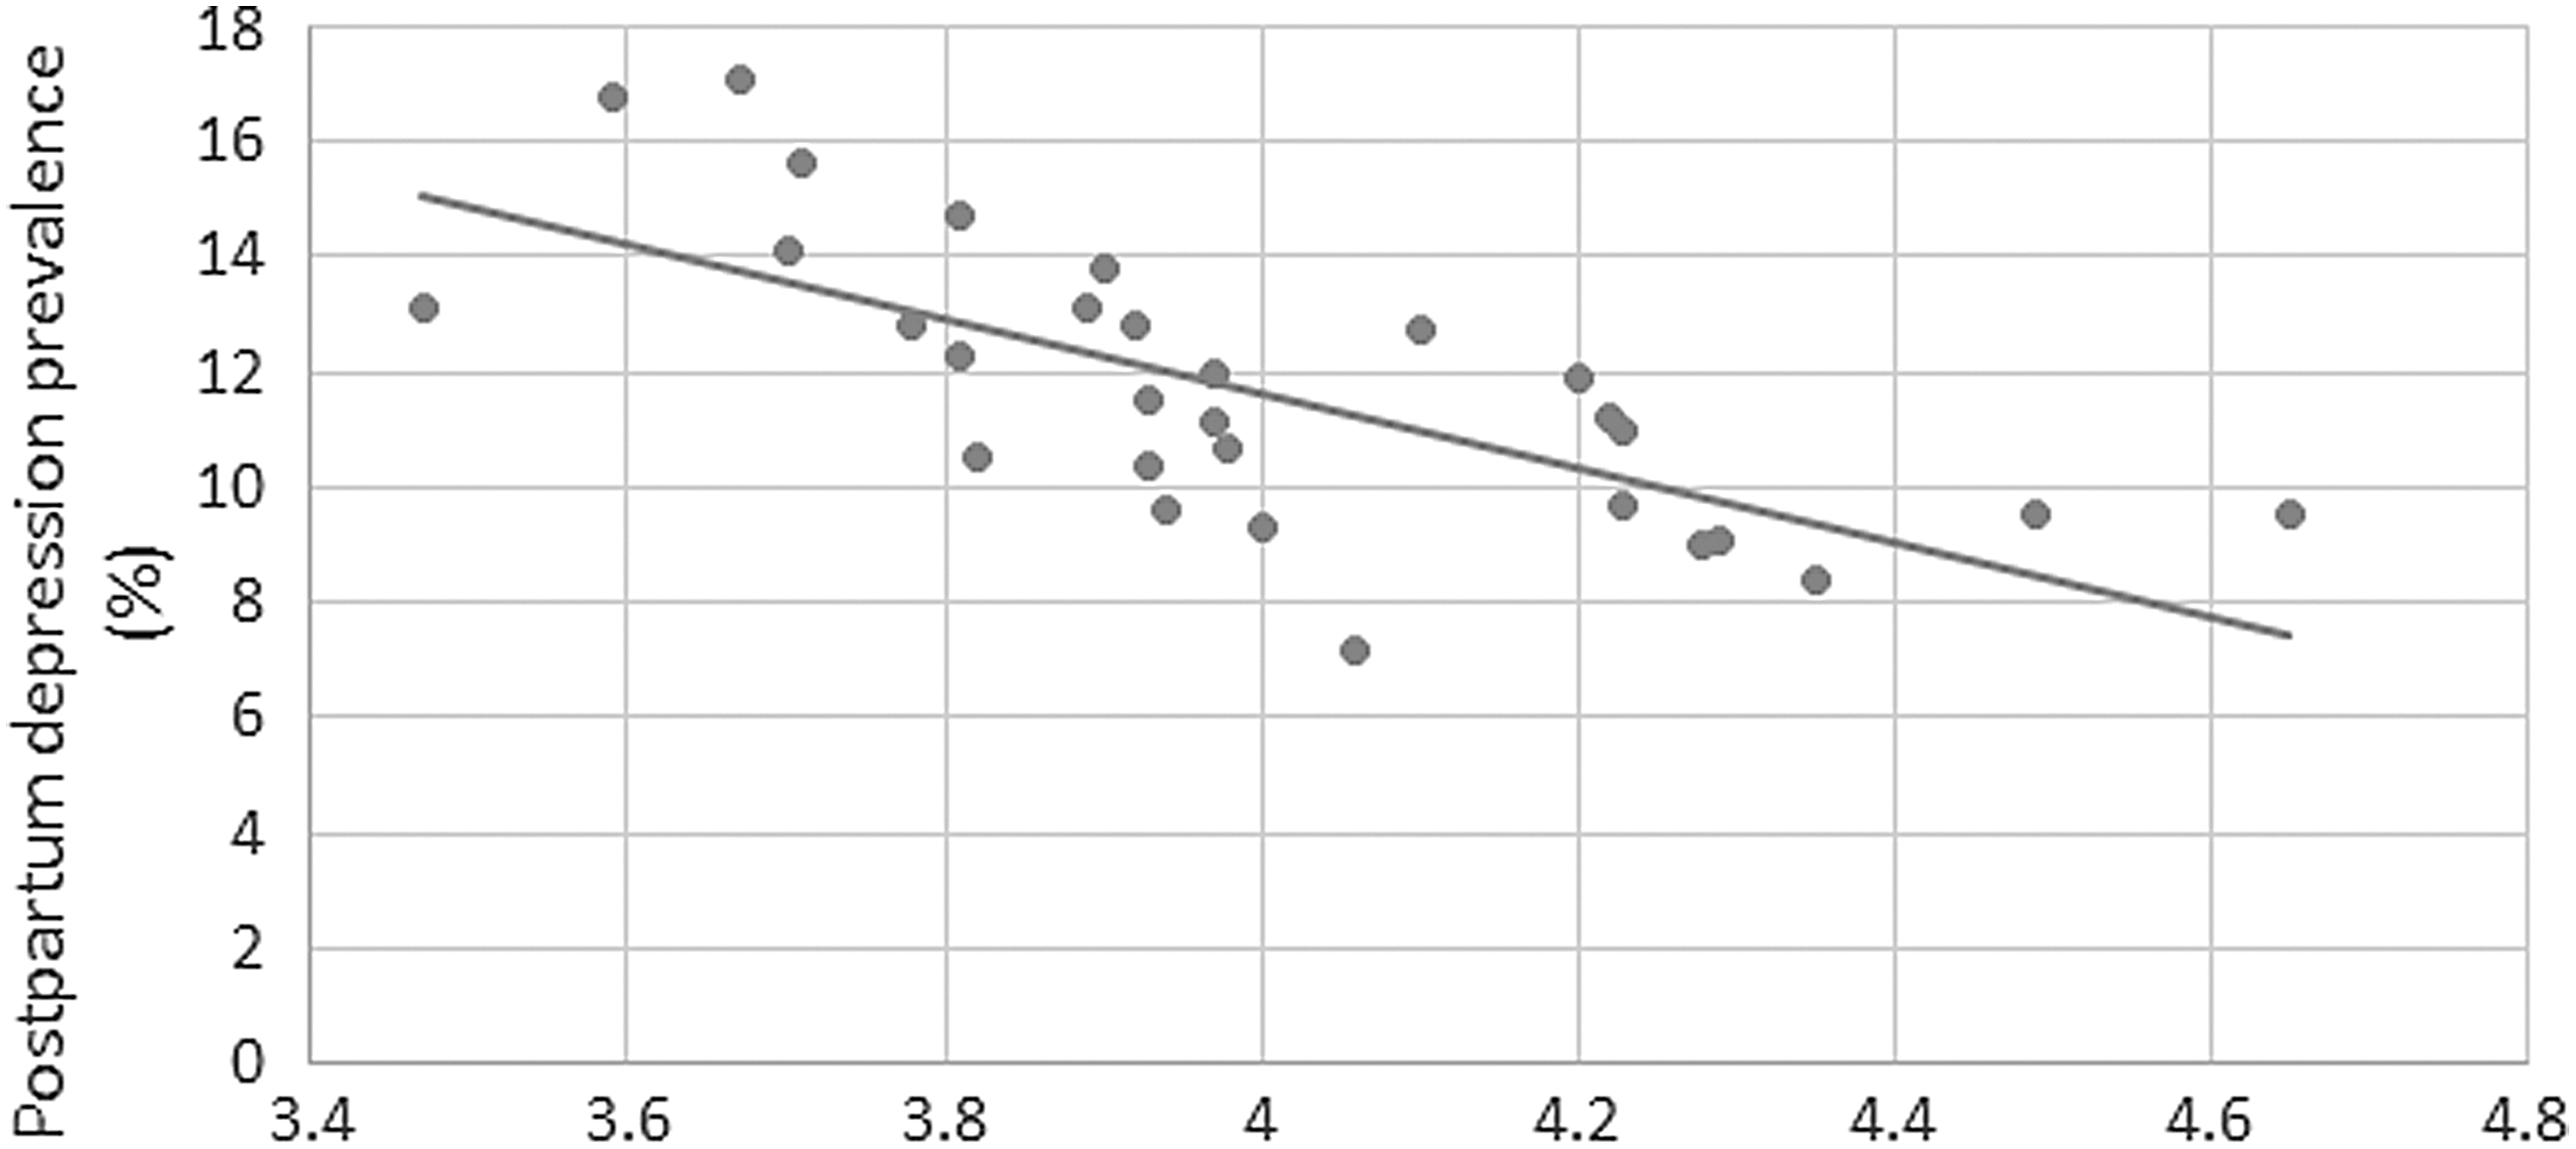
The prevalence of PPD symptoms was higher among women who experienced antenatal IPPV, those who reported that they did not intend to become pregnant even in the future or intended to be pregnant later than when they got pregnant, and those who went for a prepregnancy checkup or treatment for depression or anxiety. Women who experienced all four stressor categories had the highest prevalence (34.5%) of PPD symptoms, while the prevalence was the lowest (5.4%) among those who did not experience any stressor (Table 1). The graphs in Figures 1 and 2 suggest that in general, the state-level PPD symptom prevalence decreased with increase in the average state-level SES measures.
Women's state-level employment and earning index in the United States, PRAMS 2009–2011. PRAMS, Pregnancy Risk Assessment Monitoring System.

Women's state-level social and economic autonomy index in the United States, average 2009–2011.
The ICC was computed as 0.016, suggesting that ∼1.6% of the variability in PPD symptoms was accounted for by the states. The p value (<0.0001) of the random effect of the intercept suggested a statistically significant variability in the log odds of experiencing PPD symptoms between the states (results not shown).
Experiencing all four stressor categories (aOR: 5.43; 95% CI: 5.36–5.51) was the strongest correlate of PPD symptoms (Table 2). This was followed by experiencing partner-related, traumatic, and financial stressors (aOR: 3.69; 95% CI: 3.64–3.74); and partner-related, traumatic, and emotional stressors (aOR: 3.50; 95% CI: 3.41–3.60). Among those who experienced stressors of a single category, partner-related (aOR: 2.21; 95% CI: 2.18–2.25) and traumatic (aOR: 1.62; 95% CI: 1.57–1.66) stressors were strongly associated with PPD symptoms. Prepregnancy treatment/checkup for depression (aOR: 2.14; 95% CI: 2.13–2.16) was an important predictor of PPD symptoms (Table 2). Compared with NHWs, the odds of experiencing symptoms of PPD was lower for each racial/ethnic group.
Individuals with valid responses to all the variables.
aORs and 95% CIs are reported from the model 10 with all the individual-level correlates, random intercept for
a
Higher income groups had significantly lower odds of experiencing PPD symptoms, compared with the lowest income group. Women never intending to be pregnant had a higher likelihood (aOR: 1.47; 95% CI: 1.45–1.48) than those who wanted to be pregnant sooner. Antenatal IPPV and morbidity were strong correlates, even after adjusting for all covariates. The odds of PPD symptoms decreased with an increase in the state-level social/economic autonomy index (aOR: 0.75, 95% CI: 0.64–0.88). Table 3 shows the effects of the interaction; aORs of having PPD symptoms in states with 1 SD below average and 1 SD above average social and economic autonomy index were higher and lower, respectively, for women who experienced one to four stressor categories, compared with those who experienced none of those.
Individuals with valid responses to all the variables; odds ratios are adjusted for all other individual-level variables specified in Table 2, which include maternal age; race/ethnicity; education; income with respect to federal poverty level; marital status; prepregnancy checkup or treatment for depression or anxiety; number of previous live births; intention to get pregnant when she actually got pregnant with her new baby; adequacy of prenatal care; whether used special Supplemental Nutrition Program for WIC; whether experienced antenatal intimate partner physical violence; whether experienced any medical/obstetric complication during her most recent pregnancy; had vaginal delivery or not; and any adverse neonatal outcome.
Irrespective of the state of residence, the adjusted odds of PPD symptoms progressively increased from those who experienced only one stressor category to those who experienced all four stressor categories, compared with women who did not experience any (Table 3).
Discussion
The prevalence of PPD symptoms (11.3%) in our analysis is comparable to the commonly observed prevalence of 10%–20%. 1,2 The prevalence ranged from 7% in Illinois to 17% in Arkansas. In an analysis of 2004–2005 PRAMS data, Maine and New Mexico had the lowest (11.7%) and highest prevalence (20.4%), respectively. 2 However, the 2004–2005 PRAMS survey used a different instrument with two items to assess PPD symptoms and included data from 17 states, in contrast to the 30 states in our analysis. 2 Our prevalence is lower than that found in studies looking at rural women from a single state or region. 27,28
Despite having higher unadjusted prevalence, the adjusted odds of experiencing symptoms of PPD were lower among NHBs and AI/ANs, compared with NHWs. Similarly, women with lower levels of education had a higher prevalence of PPD symptoms compared to women with ≥16 years education; but the direction of association was the opposite in the multivariable model. On further exploration (results not shown), it appeared that income differences were largely responsible for the unadjusted distribution of PPD prevalence by race/ethnicity. In a study among preretirement adults, Hispanics and NHBs had higher frequencies of depression than NHWs, the difference being significant for the former. However, after adjusting for sociodemographic, health, and economic factors, depression was found to be significantly less frequent among NHBs, and there was no significant difference between Hispanics and NHWs. 29
Experience of IPPV during pregnancy, lack of pregnancy intention, and known risk factors of PPD were important correlates in our study. 30,31 Higher odds of PPD symptoms among women who had prepregnancy checkup or treatment for depression or anxiety might be indicative that they had a history of depression, another predictor of PPD. 3,5 Women in each stressor category had higher adjusted odds of PPD symptoms even after adjusting for covariates. Among those who experienced stressor of a single category, women experiencing partner-related stressor had the highest adjusted odds, followed by traumatic stressor. A previous analysis of Massachusetts PRAMS data also revealed the highest vulnerability to partner stress. 10
We found that experiencing financial stressor was an important correlate of PPD symptoms, even after adjusting for enrolment in WIC services and Medicaid use, which reduced the adjusted odds of PPD symptoms. Furthermore, we observed that the odds were generally higher among women who experienced multiple stressor categories, with those reporting all the four categories of stressors being more than five times likely to have PPD symptoms, compared with those who experienced none. This dose–response relationship is comparable to the findings of Stone et al., 10 where the prevalence of PPD symptoms was more than five times among women who reported having experienced seven or more antenatal SLEs, than those who experienced none. 10
In addition to the number of stressor categories, our results revealed that the stressor type was of paramount importance. Women experiencing multiple stressor categories had particularly higher odds of PPD symptoms if they experienced partner-related and traumatic stressors, irrespective of whether any other type of stressor was present.
After adjusting for individual-level correlates, residents in states with lower women's social/economic autonomy index were more likely to experience PPD symptoms compared with women in higher scoring states. This is comparable to the findings of Chen et al. on depression among women, 13 but different from the findings of McLaughlin et al., where no association was found between state-level women's status and 12-month mood and anxiety disorders. 23 McLaughlin et al. looked at DSM-IV psychiatric disorders, and not depressive symptoms, as the outcome. 23
Associations have also been found between state-level SES and other health outcomes. Living in states with lower median household income or higher proportion of adults below the poverty line was associated with significantly higher odds of hypertension, compared to states with higher median household income or lower proportion of adults below poverty line, respectively. 32 State SES can influence residents' physical environment, as well as the quality and quantity of social services. 32 Social/economic autonomy assesses women's economic security and access to opportunity. 33 States with higher indices may be more likely to have policies and programs that provide better material and social resources, and better life opportunities for women, thereby contributing to their better postpartum mental health. 10
Our observation of a dose–response relationship between the number of stressor categories and PPD symptoms, irrespective of the state of residence, may be compared with the findings of Liu and Tronick, 9 where women experiencing six or more antenatal SLEs had the highest unadjusted and adjusted odds of having a PPD diagnosis. However, the usage of PPD diagnosis, as opposed to PPD symptoms; the cumulative number of antenatal SLEs experienced, as opposed to the number of stressor categories; and data from New York City, as opposed to nationwide data, are some notable differences between the study by Liu and Tronick and that conducted by us.
Our results suggest that the relationship between the number of antenatal stressor categories experienced and PPD symptoms is stronger in states scoring lower in women's social/economic autonomy index, and vice versa. It is possible that higher social/economic autonomy buffers some impact of the antenatal stressors, by providing better access to necessary resources to cope with the situation, and decreases the likelihood of depressive symptoms after childbirth. Social safety nets, including programs like Temporary Assistance for Needy Families (TANF), Supplemental Nutrition Assistance (SNAP), and Supplemental Security Income (SSI) provide support to those who earn very low wages or are unable to work, and thus reduce the proportion of women in poverty. 33 Unfortunately, the benefits of such programs often fail to reach the women and families who have the highest needs. 33
It is likely that states with a lower percentage of women in poverty, one of the indicators of social/economic autonomy, have better mechanisms to ensure that the benefits of social safety nets reach those who would benefit the most. It is worth noting that the aforementioned difference in adjusted odds of PPD symptoms between a state with lower social/economic autonomy index and one with a higher index was the highest for those who experience all the four stressor categories. Thus it appears that the influence of the state-level index is higher with more stressors; the most vulnerable women are the ones most likely to benefit through an improvement of the state ranking.
Interactions between state-level SES in general and individual risk factors have been previously observed. A study evaluating the role of state-level SES on the prevalence of hypertension found that adults unable to work were most severely affected by low-state SES; they had the highest odds of reporting hypertension out of all employment status categories. 32 Low income women living in states with high income inequality had a higher risk of experiencing depressive symptoms, compared with low income women in low-income inequality states. 34
Limitations
There are a number of limitations to this study. According to the CDC guidelines, the 3-part PRAMS phase 6 PPD symptoms questionnaire has a sensitivity of 57% and a specificity of 87%, when all the three questions were answered and the cutoff of 10 was used. When only two or one question(s) were/was answered and using the recommended cutoff of sevens and four, the sensitivity and specificity were 95% and 49%, and 75% and 69%, respectively. Moreover, the positive-predictive value (PPV) of the instrument, given a PPD prevalence of 10%–20%, is in the range of 21%–38%, 17%–32%, and 32%–52%, for cutoffs of 4, 7, and 10, respectively.
19
The distribution of responses to each of the three parts of the PPD symptom questionnaire is summarized in the Supplementary Table S1; Supplementary Data are available online at
We also looked at the distribution of women in our sample responding to one, two, and all three questions, which were respectively 0.8%, 30.6%, and 68.6% (results not shown in table). Thus, although the instrument was not particularly accurate in terms of assessing women at risk of PPD, it is somewhat reassuring that nearly 70% of the respondents answered all the three questions, and therefore the cutoff of 10, with by far the best PPV, could be used. Moreover, a sensitivity analysis was performed, rerunning the GLMM among only those women who responded to all the three PPD symptom questions. The effect of state-level social/economic autonomy index persisted even among this subsample (aOR: 0.78; 95% CI: 0.69–0.89; results not shown in table). We also recommend replication of this study with clinically diagnosed PPD as the outcome.
Another limitation is that potential correlates of
The proportion of missing responses varied considerably between the states, which might have had an impact on our results. Data on other state-level women's status indices, such as political participation and reproductive rights, were not available for the years of interest. We did not have any information on more specific contextual factors that might depend on neighborhood or locality of residence. Also, self-reported PPD symptoms might be prone to subjective variation and social desirability bias. Last, all the data are cross-sectional, and temporal relationship cannot be established between the variables. This problem is partially obviated by the fact that an event during pregnancy must precede PPD.
Conclusions
Limitations notwithstanding, our study examined the relationship between antenatal SLE and PPD symptoms using a large population-based dataset from multiple states, after adjusting for a number of covariates. Our results suggest that screening for antenatal SLEs might help identify women at risk for PPD. This, to our knowledge, is the first study exploring the role of state-level women's SES indices on PPD. The finding that the odds of PPD decrease with increasing social/economic autonomy could have policy implications and motivate efforts to improve these indices, particularly in states that are below average.
Moreover, the interaction between number of antenatal stressor categories and state-level social/economic autonomy suggests that women residing in states with lower indices are more vulnerable to the impacts of antenatal stressors. It would be especially important to identify the at-risk women in these states so as to mitigate the impacts of antenatal stressors and decrease their probability of experiencing depressive symptoms after childbirth.
Footnotes
Acknowledgments
The authors would like to sincerely thank the PRAMS Working Group
Author Disclosure Statement
No competing financial interests exist.
References
Supplementary Material
Please find the following supplemental material available below.
For Open Access articles published under a Creative Commons License, all supplemental material carries the same license as the article it is associated with.
For non-Open Access articles published, all supplemental material carries a non-exclusive license, and permission requests for re-use of supplemental material or any part of supplemental material shall be sent directly to the copyright owner as specified in the copyright notice associated with the article.