
Abstract
Background:
Adequate assessment of depressive symptomatology is a necessary step toward decreasing income-related mental health treatment inequity. No studies have focused on comparing instruments used to detect depression in women from low-income backgrounds who are mothers of young children—a period of increased risk for depressive symptoms.
Methods:
To address this gap, two commonly used instruments (Center for Epidemiologic Studies Depression Scale [CES-D] and Hamilton Rating Scale for Depression [Hamilton]) were compared with a depression diagnosis (Diagnostic and Statistical Manual of Mental Disorders, Fifth Edition [DSM-V]) in a sample (n = 251) of mothers from low-income backgrounds with children ranging from 1 to 54 months old. Diagnostic utility was examined in light of contextual factors associated with maternal depressive symptoms.
Results:
In this sample, CES-D had better screening sensitivity and specificity than Hamilton. Our results suggest that Hamilton may underdiagnose cases of major depressive episodes (MDE) as defined by DSM-V among black and low-income mothers compared with CES-D. In addition, we identify items in CES-D, which do not contribute to alignment with DSM-V and are appropriate targets for future improvements. Our analysis identifies interpersonal relationships and mother's age as the primary risk factors, which differentiate between CES-D and Hamilton determinations versus MDE diagnosis. In addition, we find regional differences in CES-D and Hamilton.
Conclusions:
It is important to tailor the measure to the context, and a calibration sample should be considered for studies of sufficient size.
Introduction
D
Effective treatment of depressive symptoms is associated with improved mother and child outcomes. 10,11 Unfortunately, women with young children from low-income and ethnic/racial minority backgrounds often do not receive proper treatment for clinically significant depressive symptoms due, in part, to inadequate assessment. 12 –14 To address this health inequity, information is needed about the utility of depression instruments for women from low-income and ethnic/racial minority backgrounds of reproductive age. 15,16
To date, only one study has focused on comparing instruments that measure depressive symptomatology among mothers of young children from low-income and ethnic/racial minority backgrounds. 17 In that study, mothers attending a well-child care visit (infants ≤14 months of age) were screened for depressive symptoms with the Center for Epidemiologic Studies Depression Scale (CES-D) and, at a later time, completed the Beck Depression Inventory II (BDI-II), Edinburgh Postnatal Depression Scale (EPDS), and the Postpartum Depression Screening Scale (PDSS), which were compared with the Structured Clinical Interview for Diagnostic and Statistical Manual of Mental Disorders, Fourth Edition (SCID-IV), a diagnostic gold standard.
Although BDI-II, EPDS, and PDSS had similar performance, BDI-II and EPDS had lower sensitivity and specificity with the commonly used threshold scores. The authors suggest that lower cut scores may be needed to improve accuracy for minority women. Furthermore, all three tools decreased in sensitivity and specificity for mothers in the late (8–14) postpartum months compared with earlier postpartum month groups. This is noteworthy because women remain at risk for depression throughout their childbearing years 18 –21 and require instruments that perform well in later postpartum periods.
In fact, when depression is examined among mothers of young children, both persistence of depressive symptoms and new incidence of depression are common. 18 Despite the need to assess depressive symptoms beyond 12 months postpartum, few studies have examined potential depression tool utility in this period of time.
Some of the most common depression instruments used beyond the 12-month postpartum period include the Hamilton Rating Scale for Depression (Hamilton) and CES-D. 22 –24 Hamilton is commonly used in research studies to assess depressive symptoms; however, despite its common use, no studies have examined its utility for low-income or ethnic/racial minority women in the postpartum period. CES-D has clinical utility in Latino and low-income samples, 25 but less support exists for other minority mothers. 26 The only study examining the CES-D among low-income African American women postpartum supported using lower screening threshold scores than those typically used in the general population. 26
To address the gap in the literature on the utility of depression instruments for (low-income, ethnic/racial) minority mothers beyond 12 months postpartum, the present study included women between 1 and 54 months postpartum and chose to focus on two of the most commonly used measures in research for the population beyond 12 months postpartum, CES-D and Hamilton, with the following aims: (1) to understand the sensitivity and specificity differences and (2) to explore why these differences may occur by examining (a) their structural differences using principal component analysis (PCA) and (b) demographic characteristics, which associate differently in the identification of depressive symptoms for each measure.
Results from CES-D and Hamilton were compared with DSM-V clinical diagnosis. Based on recent studies focused on women from minority backgrounds, it was anticipated that in the current sample, threshold scores, which prioritize both specificity (correctly identifies nonsymptomatic) and sensitivity (correctly identifies symptomatic) equally, would be lower than the commonly used threshold scores developed from the general population. This study is the first to compare these instruments in a low-income minority-focused sample and provides a more detailed psychometric approach to evidence-based assessment of depression.
Methods
Participants
Analyses were performed on data collected from a randomized controlled trial (RCT) 7 testing the efficacy of an in-home adaptation of interpersonal psychotherapy (IPT) for mothers with depressive symptoms. Data from additional 25 mothers without depressive symptoms were combined with the 226 RCT participants for an analysis dataset comprising 251 participants. Data were from the initial baseline interview and assessment collected from mothers before randomization into two conditions (receiving in-home IPT or receiving an attention control health education course). All participants were mothers of a child enrolled in Early Head Start, a federal enrichment program for infants and toddlers from low-income households.
As reported elsewhere, 7 mothers from five different northeast and southeast Early Head Start programs participated in the study. On average, participants were 26 years of age (M = 26.00, SD = 5.8) and completed 12 years (M = 11.9, SD = 2.1) of formal education; 49% reported a GED or high school diploma, 43.6% of participants were employed, and 34% endorsed living with a partner. The average monthly family income reported was just over $950 (M = 963.00, SD = $741), reflecting incomes below the federal poverty guidelines and an average poverty ratio at 0.50 (M = 0.53, SD = 0.42). See the Measures section for poverty ratio calculation. The average age of children involved in the study was 25 months (M = 24.8, SD = 13.6) (Table 1).
Average monthly income (n = 223), some participants declined to answer this question or answered “I don't know.”
Average poverty ratio calculations were based on monthly total household income and federal poverty guidelines (weighted average for household size).
CES-D, Center for Epidemiologic Studies Depression Scale; Hamilton, Hamilton Rating Scale for Depression; SCID, Structured Clinical Interview for DSM Disorders.
Participants were contacted after referral from Early Head Start staff who were trained to obtain written informed consent and conduct preliminary screening with all mothers interested in the study. Communication and materials were provided in mother's preferred language (English or Spanish). Those who agreed to participate were scheduled for an in-home visit to obtain a second written informed consent and collect study data. To support participants with limited literacy, data collectors read consent materials, questions, and response options aloud to the mothers who were provided with a small notebook containing visual cues to response sets that corresponded to each instrument. Participants could point to their answer choice or verbally respond. Participants were compensated $25 for each study visit and received small gifts and cards (e.g., framed photos and holiday cards).
Measures
Demographic information
Participants completed a series of demographic questions about age, gender, race, ethnicity, education level, current work status, poverty ratio, languages spoken at home, disabilities, household composition (i.e., household members' relationship and ages), number of moves in the past year, and exposure to violence. Poverty ratio was calculated as yearly income divided by the federal poverty threshold for the corresponding household size and composition.
Interpersonal relationships
Support and conflict from relationships were measured using the support and conflict scale items from the Interpersonal Relationship Inventory-Short Form (IPRI-SF). 27 The IPRI-SF is a brief self-report measure that asks participants to respond to questions about their interpersonal relationships and their perceptions of social support and conflict. Response options are provided on a five-point Likert scale ranging from strongly disagree to strongly agree. The IPRI support and conflict scales have acceptable reliability (Cronbach's alpha = 0.80) in this sample.
Stress
Stress was measured using the Everyday Stressors Index (ESI). 28 The ESI asks participants to report the level of stress to common problems on 20 items. Responses are rated along a four-point Likert scale with responses ranging from not at all bothered to bothered a great deal. The ESI has adequate reliability (Cronbach's alpha = 0.85) in this sample.
Physical well-being
The norm-scaled physical aggregate score of the Medical Outcomes Study Short Form Health Survey (SF-12) 29,30 was administered to assess perceived physical and mental health. Response options are provided on a five-point scale ranging from excellent to poor. The SF-12 has excellent reliability (Cronbach's alpha = 0.83) in this sample.
Depression
Structured Clinical Interview for the Diagnostic and Statistical Manual of Mental Disorders, Fourth Edition, Research version
The SCID is a structured clinical instrument developed to assess Axis I disorders according to diagnostic and statistical (DSM) criteria. 31 It is considered a diagnostic gold standard to which other instruments are compared 32 and inter-rater reliability estimates exceed 0.90. 33 The depressive disorders module was administered to assess current major depressive episode (MDE). Depressive episode criteria were consistent with current DSM-V diagnoses, while mild depressive episode (MiDE) criteria were derived from minor depressive disorder in the DSM-IV, that is, the presence of at least two symptoms. If the mother did not meet full criteria for an MDE, but she experienced depressed mood (or loss of interest) in addition to at least one other symptom of depression, then she was classified as having an MiDE.
Center for Epidemiologic Studies Depression Scale
CES-D is a self-report depression screening tool widely used in epidemiological studies and clinical settings. Participants are asked to rate the frequency of 20 items on a four-point scale, ranging from less than 1 day in the past week to most of the time. 34 Total scores can range from 0 to 60, and a score of 16 or greater has commonly been considered a positive screen for depression. 34 CES-D demonstrates acceptable psychometric properties; reported levels of Cronbach's alpha are equal to 0.80 or higher. 35 –37 In this sample, the Cronbach's alpha was 0.92.
Hamilton Rating Scale for Depression
The Hamilton instrument, sometimes referred to as HAM-D or HRSD, is a brief depression symptom severity measure. 38 In this study, we refer to the 17-item version of Hamilton. Responses are rated on a Likert scale for each question. Unlike CES-D, which relies solely on self-report, Hamilton includes clinical judgment in scoring. Each item in the instrument was scored from either 0 to 4 or 0 to 2, depending on their weight in the final score, with 0 as least indicative and 4 as most indicative of depression. The total score is first summed across all items in the instrument to create a continuous score, which can range from 0 to 63. A score of 17 or greater is considered to exceed the clinical threshold. In the general population, the measure demonstrates adequate reliability (Cronbach's alpha = 0.80). 39,40 In this sample, Cronbach's alpha was 0.75.
Data analytic approach
IPRI, ESI, and SF-12 variables were normalized by their sample standard deviation, and age was scaled per decade. To examine how well depression instruments identified mothers diagnosed with MDE, the categorized scores for CES-D and Hamilton were each compared directly against an SCID diagnosis of MDE in terms of sensitivity and specificity. Then, using the SCID classification as the gold standard, receiver operating characteristic (ROC) curves and their respective areas under the curve (AUC) were calculated for CES-D and Hamilton.
The ROC curve plots sensitivity versus (1 minus) specificity of the measure for the sample at every potential cutoff score. Hence, a more desirable curve has a larger AUC score. DeLong's test, a one-sided nonparametric method, was used to compare whether the AUC score for CES-D was statistically greater than the AUC score for Hamilton, 41,42 thus determining whether one measure is better than the other in terms of identifying depression among the current sample of mothers.
To explore why CES-D and Hamilton depression measures might differentially identify mothers as exhibiting depressive symptoms, we used two approaches. First, PCA was used to identify the underlying structures of CES-D and Hamilton within our population. The number of components was determined using scree plots. The selected components were consistent with using a percentage of common variance threshold of 0.75. If the number of selected components exceeded 50% of the number of variables, then it was considered that no underlying structure was found. If an underlying structure was found, then the extracted components were each scaled as per their respective standard deviations and modeled multivariably against the dichotomous outcome of SCID using logistic regression to identify which substructures contributed most toward and against the alignment with SCID.
Second, we aimed to examine how demographic characteristics were associated with identification of depressive symptoms across measures. To do this, we used a single statistical model utilizing the generalized estimating equation (GEE) methodology that included all three depression measures in their dichotomous forms against 19 demographic characteristics, considered potential risk factors for depression, and their pairwise interactions with type of depression measure. The logistic link and unstructured correlation 3 × 3 matrix was used to account for the within-person correlation across the three measures.
The final parsimonious model was obtained using backward selection; the exit significance criterion was set at 0.05 for all selections. We first selected for interactions between all risk factors and the depression measure. Then, we set the significant interactions and their respective main effects as concomitant, and selected among the remainder of the main effects.
The following 17 risk factors and their interaction with type of test were included as covariates in the study: mother's age, child's age, child's gender, race, geographic region, mother's education, mother's disability status, participation in temporary assistance for needy families or similar programs, family conflict, mobility, poverty ratio, structure of the household, child exposure to household violence, support from relationships, conflict from relationships, stress, and physical well-being. Where interaction terms were significant after variable selection, the effects of those risk factors were produced separately for each depression measure.
Results
Sensitivity and specificity analysis
The categorization of each measure in the sample can be found in Table 1. Consistent with previous studies, CES-D had high sensitivity (0.91 [0.86–0.96]), but poor specificity (0.55 [0.46–0.64]), for MDE. Despite the lack of specificity, CES-D has larger AUC when compared with Hamilton (0.83 [0.78–0.88] versus 0.79 [0.74–0.85], respectively). A comparison plot of the two ROC curves is found in Figure 1; the CES-D AUC fares significantly better than the Hamilton AUC (DeLong's test z = 0.69, p = 0.046).
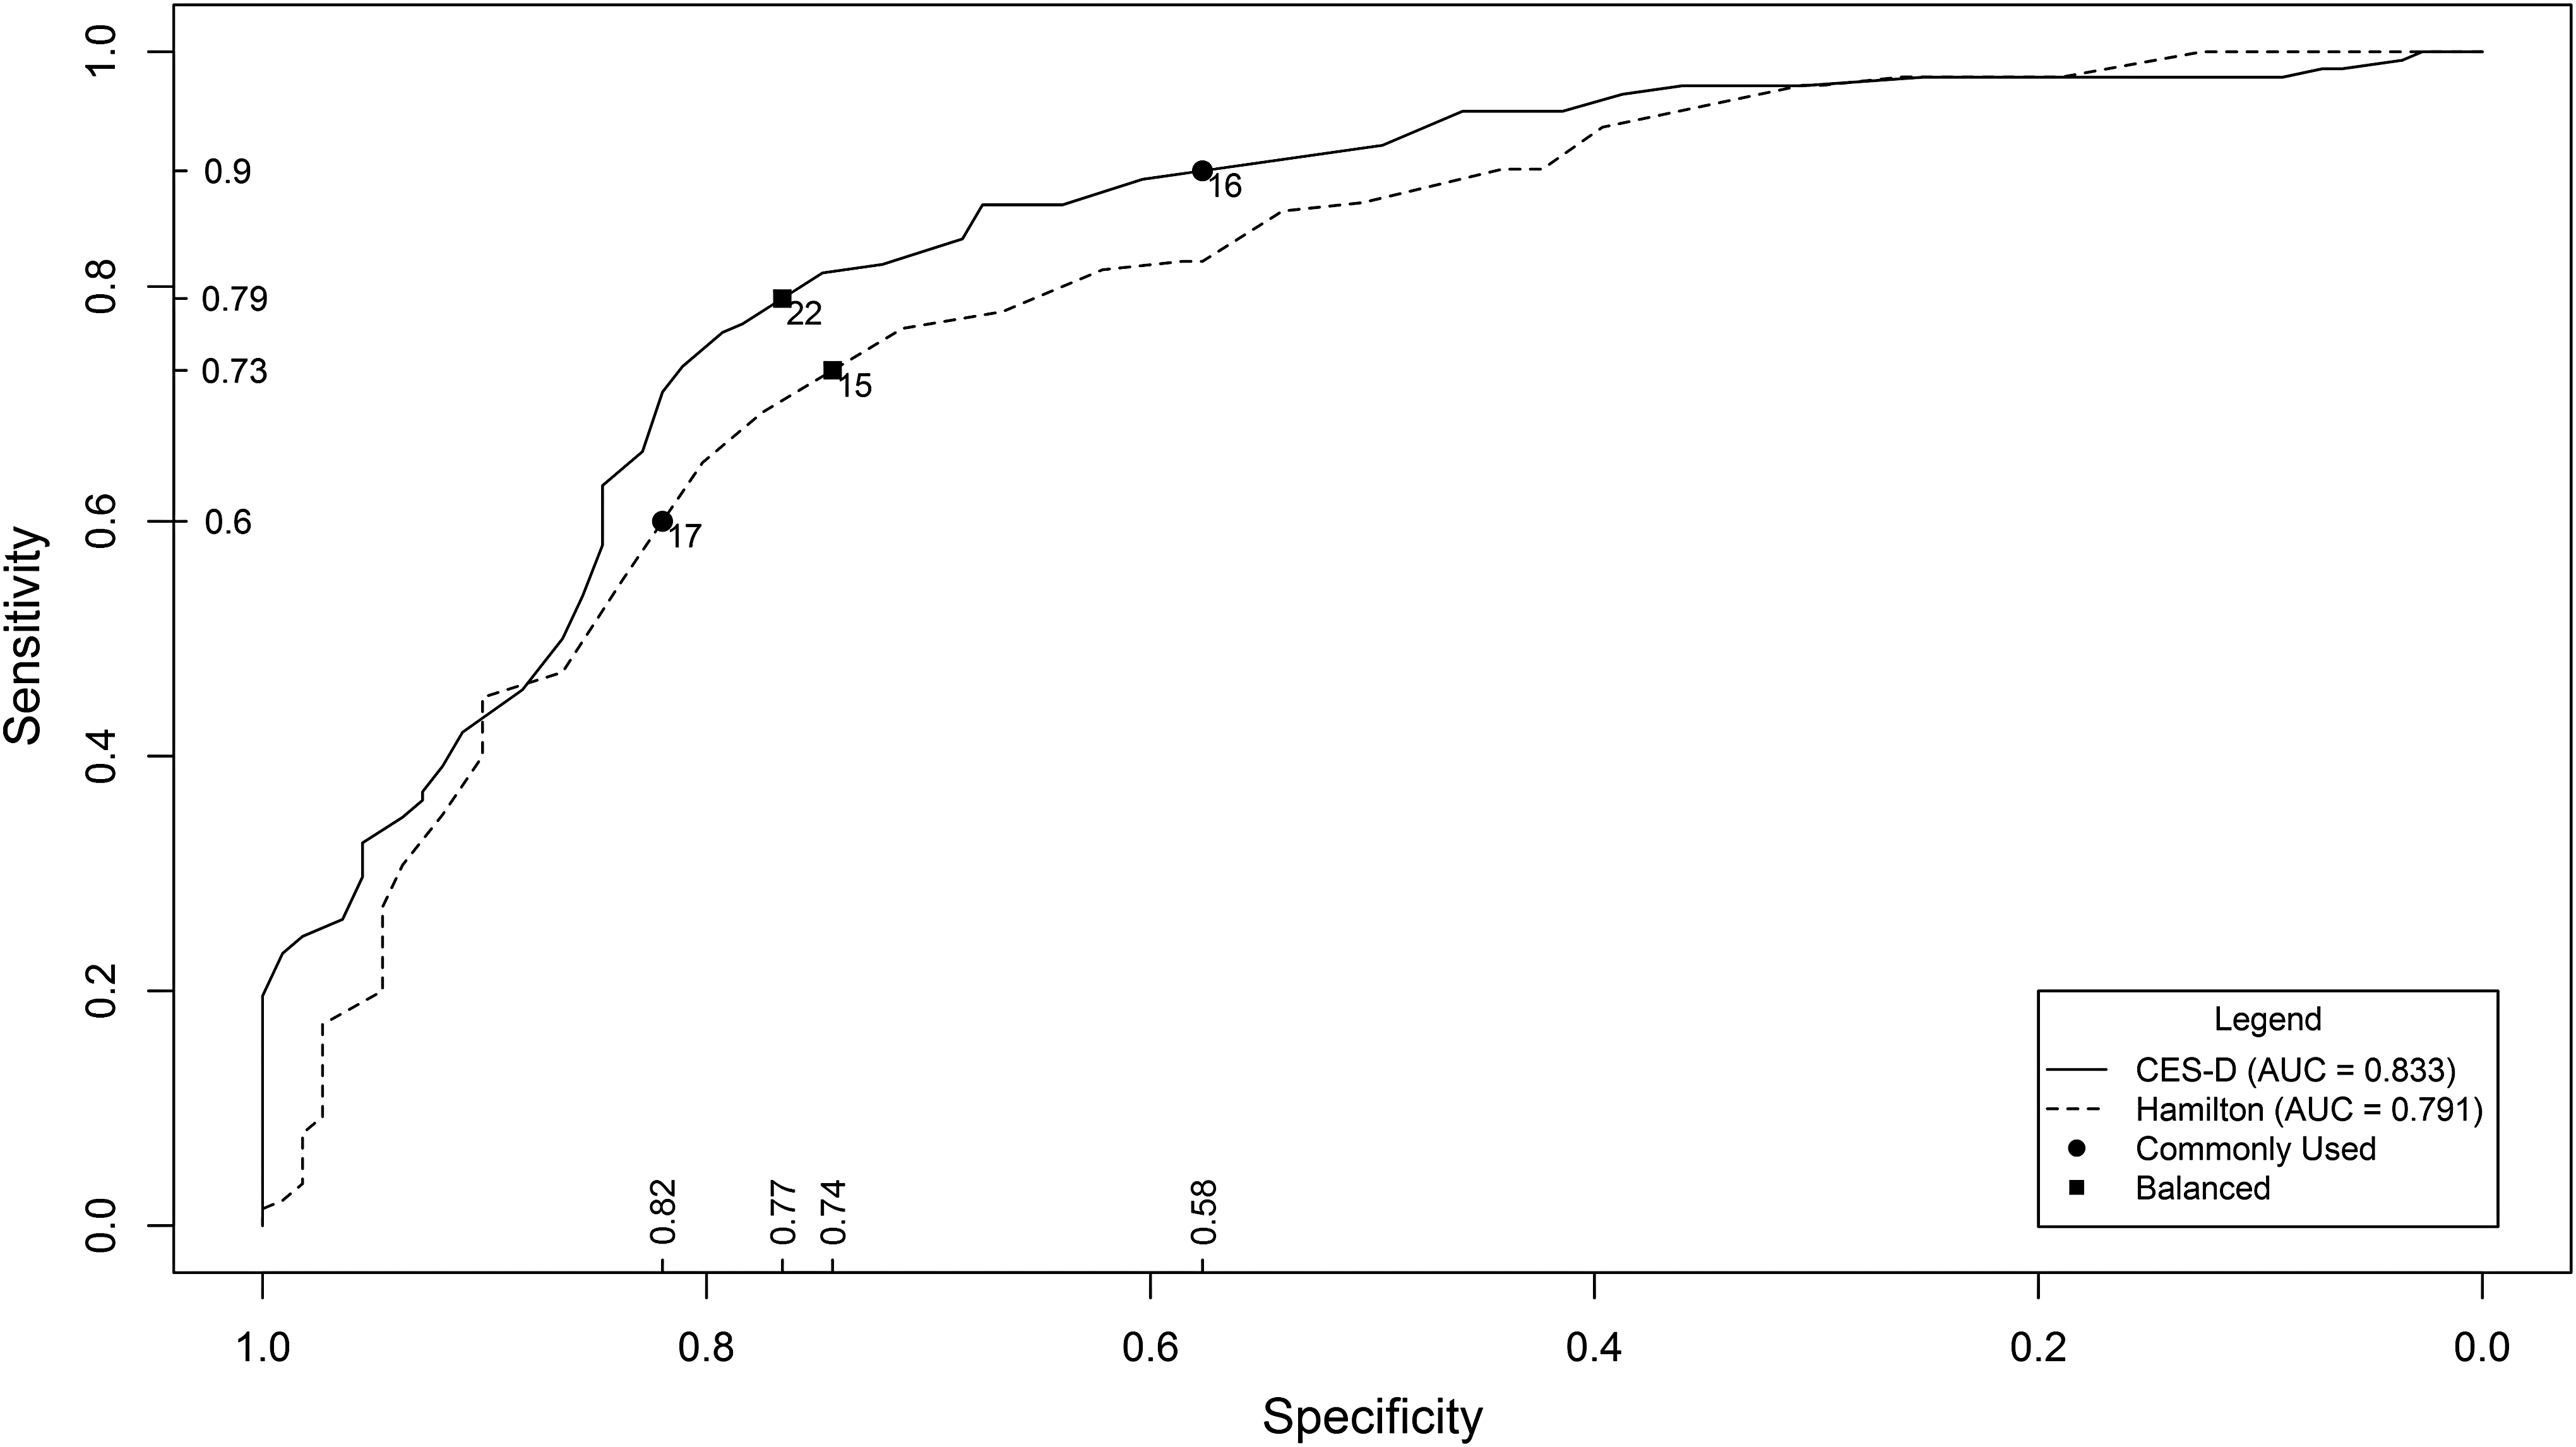
Receiver operating characteristic curves. Cutoff points are labeled with their respective thresholds for the measure. Labeled thresholds have minor ticks on the axes for their respective sensitivity and specificity. Balanced thresholds were calculated as the shortest distance to sensitivity = 1 and specificity = 1.
The comparison plot shows the cutoff points that demonstrate the trade-off between sensitivity and specificity. Optimal values that equally prioritize both of these measures were determined as those closest to the top left corner (i.e., sensitivity = 1, specificity = 1) and found to be 22 for CES-D and 15 for Hamilton. These threshold points result in sensitivity of 0.79 and specificity of 0.77 for CES-D and sensitivity of 0.73 and specificity of 0.74 for Hamilton. In addition, the typically used threshold points of 16 for CES-D and 17 for Hamilton are also marked. Finally, CES-D was able to better discriminate for MiDEs than Hamilton—of the 83 mothers categorized as having MiDE by the DSM-IV, 73 (88%) scored above threshold on CES-D, whereas only 42 (51%) scored above threshold on Hamilton (Table 2).
Principal component analysis
Four components were identified as substructures for the CES-D by PCA as selected via scree plots. These components encompassed four subscales, which we named as depressed mood (contributes to 41.5% of variance), outlook (9.8%), interpersonal relationships (5.8%), and somatic manifestations of depression (4.6%). Using a loading threshold of 0.25, the factors contained the following items: (1) depressed mood contained items—felt sad, had the blues, life had been a failure, and felt depressed; (2) outlook contained items—everything was an effort, as good as other people, restless sleep, enjoyed life, was happy, and hopeful about the future; (3) interpersonal contained items—people were unfriendly and felt that people disliked me; and (4) somatic contained items—had trouble keeping focus, felt fearful, crying spells, and life had been a failure.
In contrast, we were unable to determine any underlying structure for Hamilton, so no subscales were computed and it is treated as a single overall scale. Since no underlying structure was found for Hamilton, we only ran the logistic model for MDE against the CES-D four factors. This model showed that depressed mood (Factor 1) and somatic manifestations of depression (Factor 4), but not outlook or interpersonal relationships, were significantly associated (Table 3).
Odds ratios are calculated as increased odds for major depressive episode diagnosis given a one standard deviation increase of the factor in question.
p < 0.05, *** p < 0.0001.
Models using generalized estimating equations methods
The final parsimonious model (Table 4) contained the following covariates: geographic region, that is, residing in northeastern United States versus southeastern United States, child exposure to household violence, poverty ratio, mother lives with her significant other, mother's age, ESI, IPRI support, and IPRI conflict. Of those, retained interaction terms included residence, ethnicity, whether the mother lives with her significant other, mother's age, and IPRI conflict. While a positive result for the CES-D and SCID was inversely related to the mother residing in northeastern United States and the mother's age, there is no evidence to say the same for Hamilton. Thus, we suspect that there is an unknown effect possibly confounded with region, which aids the better alignment of CES-D and SCID.
Odds ratios for all categorical variables are the increased odds for a positive diagnosis if the risk factor is present versus not. Odds ratios for all continuous variables are the increased odds for a positive diagnosis if the risk factor is increased by one unit. For scales IPRI and ESI, this is an increase by one standard deviation of the original scores; for witness violence, one unit is equivalent to one additional instance of violence witnessed; for age, one unit is equivalent to a 10-year increment in age.
For risk factors with significant interaction terms.
p < 0.05, ** p < 0.01, *** p < 0.0001.
Interaction term p-value <0.05, ^^ p < 0.01.
IPRI, interpersonal relationship inventory; ESI, Everyday Stressors Index.
Discussion
The current study builds on the emerging literature regarding depression among women with young children from low-income and minority backgrounds by examining the psychometric utility of two common depression research instruments in a sample of families with a child enrolled in Early Head Start. Given that there are only two studies currently published on the accuracy of these depression instruments among this demographic, the present study makes a significant contribution toward improving screening accuracy for at-risk mothers. Limitations of this study include the sample is limited to northeast and southeast US populations, ethnic/racial groups composing the sample are not representative of the general population, and the analysis is cross sectional in nature.
The main goal of this study was to test and develop recommendations for use of CES-D and Hamilton among at-risk women who have been underrepresented in previous studies. First, within this sample, the internal reliability for CES-D was greater than what we found in literature, whereas Hamilton was slightly lower than what we found in literature. This may have been due to the difference in demographics. The sensitivity and specificity of CES-D and Hamilton comparisons are similar to previous results in the literature where CES-D has better sensitivity, but worse specificity, than Hamilton. 26,43,44 We showed that the area under the ROC curve for CES-D was significantly larger than that for Hamilton, suggesting that CES-D may be more accurate than Hamilton and appears to be a better screening tool for women from low-income and minority backgrounds who are mothers of young children. Consistent with previous studies of other depression tools, which suggest that a lower cut point is needed with minority women (e.g., Chaudron et al. 17 and Tandon et al. 26 ), there was support for use of a lower cut point on Hamilton. In contrast, CES-D appears adequate for minority women using the commonly used screening cut points. As such, CES-D shows promise as a tool to identify even mild cases of depression and mothers at risk for an MDE. By more accurately identifying mothers in need of intervention, costs and consequences associated with more severe depressive symptoms among mothers (e.g., hospitalization, child neglect, and negative outcomes such as developmental delays and poorer cognitive functioning) may be prevented.
The motivation for the PCA was to determine the structure of each measure and gain insight into differences and similarities in screening results between CES-D and Hamilton. We did not find an underlying structure for Hamilton; this was not surprising given inconsistent factor structure observed in multiple studies (e.g., Kobak 45 ; Shafer 46 ). In contrast, we expected CES-D to yield a four-factor structure similar to those found in much of the CES-D literature. 34 While we did identify a four-factor structure, the actual factors differed slightly from what is commonly cited in the literature, but this was not surprising based on less consistency found with ethnic/racial minority groups (e.g., Kim et al. 47 ). Modeling SCID diagnosis versus CES-D factors showed statistically significant effects for Factors 1 and 4. However, the effect size for Factor 1 is roughly five times that for Factor 4, implying that the alignment between CES-D and SCID could be largely due to both capturing depressed mood in this sample. CES-D items found in Factors 2 and 3 can be targets for improvement to align CES-D and SCID in future work.
The GEE models allowed examination into differences among the three measures through their respective risk factors. The results provide additional insight into why the CES-D shows more agreement with the SCID than the Hamilton does. Of the four risk factors that differ by measure, IPRI conflict significantly affects all three measures in varying degrees. The overall significance of IPRI conflict is expected; poor interpersonal relationships have been shown to be associated with current major depressive episodes. 48 However, CES-D and Hamilton clearly weigh the effect more heavily than the SCID, which may contribute toward discrepancies for both measures and agree with the PCA findings.
The same can be said for lives with significant other, which is also an indicator for a major interpersonal relationship. Residence is highly significant for CES-D and borderline significant for SCID. It seems that CES-D is less likely to be positive for mothers in the northeast, implying it may be worse at detecting underlying characteristics correlated with that geographic region. We can only speculate why this was observed. For example, the northeast has longer winters compared with the southeast, potentially creating more seasonal mood disorders or physiological symptoms that may be detected through Hamilton. Alternatively, the CES-D wording may be interpreted differently or perceived more favorably in the southeast. 49
Differences, including depressive symptomatology, have been attributed to residing in different regions of the United States, suggesting that geography can exert distinct cultural influences that could affect the performance of an instrument. 50,51 Although in the general population adults from the south have higher rates of depression, there are no comparable data on mothers of young children by region. Therefore, we felt it was important to include this risk factor in keeping with the goal of this study to look at how these screening tools worked in a heterogeneous minority population.
In comparison with the general population, women from low-income backgrounds are less likely to receive adequate assessment. Combined with minority status, proper assessment and intervention are even less likely, impacting their children's development and long-term outcomes at a particularly malleable period. Accurate screening is critical given the limited resources available to engage at-risk mothers into intervention. The effectiveness of routine screening as well as generalizability of research studies is limited by the accuracy of the screening tools used.
This study suggests that CES-D may be more favorable than Hamilton to attain generalizability to a low-income minority population and during a longer postpartum window. It also provokes further investigation into why CES-D and Hamilton may operate differently depending on location, including which measure may be more engaging to women of each region. Future qualitative work, including content analysis and cognitive interviewing, may be useful to better investigate these new questions.
When taken altogether, these analyses emphasize that using these measures as a one size fits all is problematic. There are many moving parts in determining the threshold for a screening tool that satisfies the demands of a particular study. While the sample was randomized, the use of common thresholds still showed a region effect, which may imply systematic bias. For large studies or programs that rely on these screening tools for eligibility, it may be advisable to use a preliminary calibration sample where SCID is administered alongside the selected screening measure.
Conclusions
Minority women from low-income and ethnic/racial minority backgrounds who are mothers of young children have elevated risk for both depressive symptoms and inadequate depression assessment and treatment. Hamilton and CES-D both may be useful in treatment studies with minority women as long as sensitivity and specificity are carefully considered. However, in this sample, examination of ROC curves shows an overall advantage of CES-D over Hamilton in terms of both sensitivity and specificity. CES-D may be a more accurate measure for detecting depression in this population while at the same time requiring less clinician training and time to administer. Our final recommendation is to emphasize the necessity of tailoring these measures to the specific population being studied.
Footnotes
Acknowledgments
The authors thank the families who participated in this research. This research was made possible by the National Institutes of Health, National Institute of Mental Health, R01MH065524 (HILDA GRANT). Principal Investigator: L.B., PhD, PMHCSN, APRN, BC, FAAN. This publication was made possible by grant number 2T32NR008856 from the National Institute of Nursing Research at the National Institutes of Health. Its contents are solely the responsibility of the authors and do not necessarily represent the official views of NINR.
Author Disclosure Statement
No competing financial interests exist.